P R O C E E D I N G S
Open Access
Examination of previously identified
associations within the Genetic Analysis
Workshop 19 data
Richard A. J. Howey
1, Jakris Eu-ahsunthornwattana
1,2, Rebecca Darlay
1and Heather J. Cordell
1*FromGenetic Analysis Workshop 19 Vienna, Austria. 24-26 August 2014
Abstract
We investigate the possible replication of“known”associated single-nucleotide polymorphisms (SNPs) with blood pressure and expression phenotypes. Previous studies have provided a list of 95 SNPs thought to be associated with blood pressure phenotypes, of which 44 were present in the Genetic Analysis Workshop 19 (GAW19) family-imputed genome-wide association studies (GWAS) data and 4 in the GAW19 unrelateds sequence data. Using only the real (not simulated) GAW19 data, we show through the use of statistical tests that account for family relatedness, using FaST-LMM (Factored Spectrally Transformed Linear Mixed Model), that none of our candidate SNPs yields a significant
pvalue. Furthermore, a study of epistasis, aiming to detect statistical interactions between loci with respect to their association with transcription levels has provided a list of 30 associated interacting SNP pairs, of which 13 are present in the GAW19 family GWAS and expression data. We show for this set of results, using the program GEMMA (genome-wide efficient mixed-model analysis) to account for family relatedness, that there is evidence of replication within the real GAW19 data. Two individual SNP pairs reach significance, and the set of remaining results give a combinedpvalue of 0.017 that at least 1 of these remaining SNP pairs interacts to influence an expression phenotype.
Background
Previous studies using very large data sets have provided a list of single-nucleotide polymorphisms (SNPs) believed to be associated with blood pressure and expression phe-notypes. We attempt to replicate these SNPs in the Genetic Analysis Workshop 19 (GAW19) family genome-wide association studies (GWAS) data set and GAW19 sequence data, which may indicate the feasibility of finding novel SNPs in the GAW19 data sets.
Methods
Family genome-wide association studies data
The GAW19 family GWAS data [1] consisted of 959 indi-viduals in 20 families with SNP data for odd chromosomes,
including both real and imputed SNP data, and phenotype data for systolic blood pressure (SBP), diastolic blood pres-sure (DBP), and hypertension (HTN). Quality control was performed identically to that by Eu-ahsunthornwattana et al. [2] on the Genetic Analysis Workshop 18 data. This resulted in 954 individuals in 20 families. The phenotype data consists of longitudinal data measured over 4 years with covariates for smoking, HTN medication, and age. Covariates and measurements over multiple time points were accounted for by transformation to a single“average” quantitative trait for each phenotype, as described by Eu-ahsunthornwattana et al. [2].
A meta-analysis study conducted by Tragante et al. [3] of 87,736 individuals provided 95 candidate SNPs associ-ated with blood pressure–related phenotypes; of these, 44 candidate SNPs were present in the GAW19 family data. Two extra phenotypes were created using the GAW19 phenotype data as defined by Tragante et al. [3]: * Correspondence:[email protected]
1Institute of Genetic Medicine, Newcastle University, Central Parkway,
Newcastle Upon Tyne NE1 3BZ, UK
Full list of author information is available at the end of the article
(a) median arterial pressure (MAP) = 2/3 DBP + 1/3 SBP; and (b) pulse pressure (PP) = SBP−DBP.
The 44 candidate SNPs were tested individually using FaST-LMM (Factored Spectrally Transformed Linear Mixed Model) with the realized relationship matrix (RRM) option to adjust for relatedness between individuals. To examine the overall association of a set of SNPs we de-fined a statistic inspired by Dudbridge and Koeleman’s rank truncated product statistic [4]:
−Xni¼1log10 pi
where pi is the p value of the ith SNP tested from n candidate SNPs. Candidate SNPs for each phenotype were considered together giving overall p values for DBP, MAP, PP, SBP, and HTN. The null hypothesis is formed by assuming that none of the SNPs are associ-ated with the phenotype in question. A set of p values can be generated by sampling U[0, 1], where the corre-lations (r2, calculated using PLINK) of nearby SNPs (<2 Mb) are accounted for [5]. The overall p value is then given by the proportion of simulated test statistics greater than the observed test statistic, from 500,000 replicates generated under the null hypothesis. An alternative method to control the false discovery rate for correlated test statistics is given by Yekutieli and Benjamini [6].
Estimates of the power to detect association, at signifi-cance level 0.05, for each of the tested SNPs with the ap-propriate phenotypes were calculated using the program Quanto (http://biostats.usc.edu/Quanto.html), assuming that the individuals are unrelated, thus providing upper limits for the power. Parameter estimates and minor allele frequencies were taken from Tragante et al. [3], and sample sizes were assumed to equal those of the GAW19 family GWAS data.
Unrelated sequence data
From the 95 previously associated SNPs, only 5 were found in the GAW19 sequence data. Data consisted of 1943 unrelated individuals (of which 92 had missing phenotype data), together with 1 covariate on HTN medication. PLINK was used to calculate p values using linear regression.
Expression data
A recent study by Hemani et al. [7], motivated by a desire to investigate the extent to which epistasis (the phenomenon whereby one polymorphism’s effect on a trait depends on other polymorphisms present in the genome) might influence complex traits, detected 30 gene–gene (SNP–SNP) interactions associated with transcription. We attempted to replicate these associations using the GAW19 family GWAS and expression data.
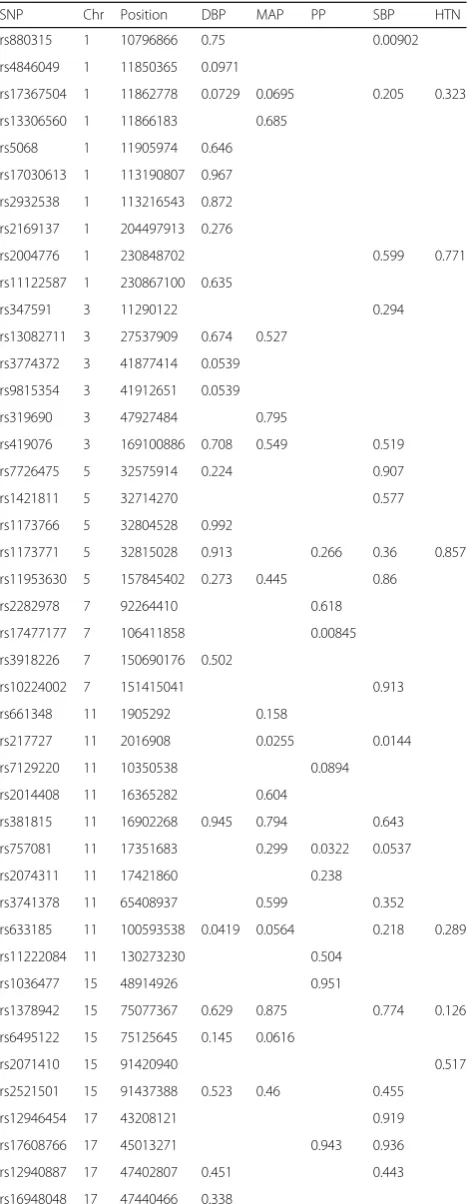
Table 1GWAS family data
SNP Chr Position DBP MAP PP SBP HTN
rs880315 1 10796866 0.75 0.00902
rs4846049 1 11850365 0.0971
rs17367504 1 11862778 0.0729 0.0695 0.205 0.323
rs13306560 1 11866183 0.685
rs5068 1 11905974 0.646
rs17030613 1 113190807 0.967
rs2932538 1 113216543 0.872
rs2169137 1 204497913 0.276
rs2004776 1 230848702 0.599 0.771
rs11122587 1 230867100 0.635
rs347591 3 11290122 0.294
rs13082711 3 27537909 0.674 0.527
rs3774372 3 41877414 0.0539
rs9815354 3 41912651 0.0539
rs319690 3 47927484 0.795
rs419076 3 169100886 0.708 0.549 0.519
rs7726475 5 32575914 0.224 0.907
rs1421811 5 32714270 0.577
rs1173766 5 32804528 0.992
rs1173771 5 32815028 0.913 0.266 0.36 0.857
rs11953630 5 157845402 0.273 0.445 0.86
rs2282978 7 92264410 0.618
rs17477177 7 106411858 0.00845
rs3918226 7 150690176 0.502
rs10224002 7 151415041 0.913
rs661348 11 1905292 0.158
rs217727 11 2016908 0.0255 0.0144
rs7129220 11 10350538 0.0894
rs2014408 11 16365282 0.604
rs381815 11 16902268 0.945 0.794 0.643
rs757081 11 17351683 0.299 0.0322 0.0537
rs2074311 11 17421860 0.238
rs3741378 11 65408937 0.599 0.352
rs633185 11 100593538 0.0419 0.0564 0.218 0.289
rs11222084 11 130273230 0.504
rs1036477 15 48914926 0.951
rs1378942 15 75077367 0.629 0.875 0.774 0.126
rs6495122 15 75125645 0.145 0.0616
rs2071410 15 91420940 0.517
rs2521501 15 91437388 0.523 0.46 0.455
rs12946454 17 43208121 0.919
rs17608766 17 45013271 0.943 0.936
rs12940887 17 47402807 0.451 0.443
rs16948048 17 47440466 0.338
From the 30 candidate SNP pairs, 11 were not considered because SNPs were on even chromosomes and 6 be-cause of missing gene-probe data. The gene probes in the GAW19 data were different from those used by Hemani et al. [7], and were adjusted to account for co-variates using the same method as was described for the blood pressure phenotypes. One gene (CTSC) had 2 gene probes.
To test for SNP–SNP interactions while allowing for family relatedness, GEMMA (genome-wide efficient mixed-model analysis) was used with an estimated kin-ship matrix. GEMMA does not have an interaction op-tion but it does allow covariates, which were used to encode SNP data through use of 2 linear mixed models. The first model encoded 3 variables: the number of minor alleles for each SNP and the intercept. The second model encoded an extra variable given by the product of the number of minor alleles of the 2 SNPs, thus imposing an additive × additive interaction model. The maximum likelihood estimates for each model were used to evaluate p values using the likelihood ratio test.
An overallpvalue for all 14 interaction tests was cal-culated using the method previously described for single SNP association analyses in the GAW19 family GWAS data, using 10 million replicates.
Results
Family genome-wide association studies data
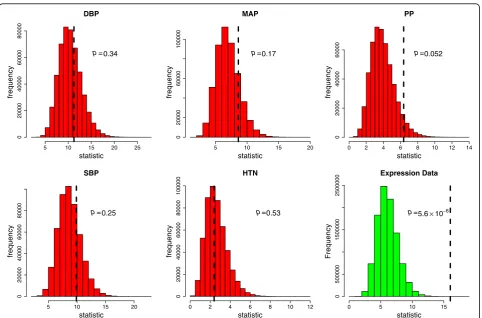
Table 1 lists the results for the SNP analyses using the imputed family GWAS data. It can be seen that no SNPs are below the Bonferroni correctedpvalue of 0.05/75 = 0.00067 for a family-wise error rate (FWER) of 0.05. Figure 1 shows the overall permutation distributions for the test statistics for each phenotype resulting in p values of 0.34, 0.17, 0.052, 0.25, and 0.53 for DBP, MAP, PP, SBP, and HTN respectively. This appears to provide some very weak evidence of association for PP; that is, at least 1 of the tested SNPs is significantly associated with PP.
Upper limits of the power to detect the tested SNP associations, at significance level 0.05, gave estimates ranging from approximately 0.080 to 0.30.
DBP
Unrelateds sequence data
Table 2 lists the results for SNP analyses using sequence data. No SNPs are below the Bonferroni correctedpvalue (0.05/12 = 0.0042) for a FWER of 0.05.
Expression data
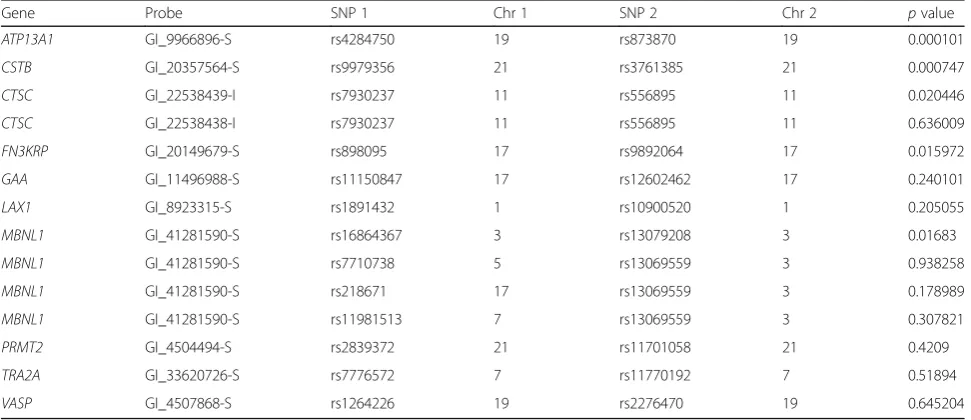
Table 3 lists the results for the SNP pair analyses using the GWAS and expression data. Two SNP pairs gavepvalues below the Bonferroni corrected p value of 0.0036 for a FWER of 0.05: rs4284750 and rs873870 on chromosome 19 interacted to influence gene expression at ATP13A1; and rs9979356 and rs3761385 on chromosome 21 inter-acted to influence gene expression atCSTB. Thepvalues are generally lower than expected with a median of 0.223. Furthermore, the overallpvalue for the 14 tests, as shown in Fig. 1, is 5.6 × 10⁻⁶, and with the 2 significant SNP pairs removed the remaining 12 tests give an overallpvalue of 0.017, which provides reasonable evidence that at least 1
of these SNP pairs also interacts to influence the corres-ponding gene expression measurement.
Discussion
The candidate SNPs and blood pressure phenotypes in-vestigated here were previously detected in large meta-analyses or other replicated studies, giving considerable confidence that these SNPs are in fact genuinely associated. However, the sample size in the GAW19 family GWAS data consists of only 954 related individuals, giving power (for nominalpvalue 0.05) expected to be less than 0.080 to 0.30; perhaps it is not too unexpected that no associa-tions were replicated. The sample size of the unrelateds sequence data, 1943 individuals, was greater, but nonethe-less did not replicate any previously observed associations. Although the low sample sizes are the most obvious rea-son for the nonreplication, there may also be more subtle reasons for the nonreplication, such as the relatedness and ethnicity of the samples used. The quality and accuracy of the measured phenotypes may also be relevant, in particu-lar whether individuals took HTN medicine or not.
The SNP–SNP interactions previously shown to be associated with transcription did, however, show some evidence of replication, with 2 SNP pairs showing sig-nificant evidence of association and the remaining SNP pairs giving an overall pvalue of 0.017, indicating that at least 1 additional SNP pair is associated. It is argued that the power to detect such associations may be greater because of the more direct link between SNPs and transcription. We note, however, that the interpret-ation of such findings as representing genuine interac-tions (as opposed to haplotype effects, possibly marking Table 2Unrelateds sequence SNP data
SNP Chromosome Position DBP MAP PP SBP
rs3774372 3 41877414 0.974
rs661348 11 1905292 0.497
rs217727 11 2016908 0.789 0.490
rs757081 11 17351683 0.375 0.375 0.432
rs3741378 11 65408937 0.942 0.772
rs2472304a 15 75044238 0.246 0.275 0.472
Replicationpvalues in the GAW19 sequence data for SNPs and phenotypes as indicated. Only previously associated SNP-phenotype combinations
were investigated
a
Using the proxy SNP rs1378942
Table 3Gene expression data and SNP–SNP interactions
Gene Probe SNP 1 Chr 1 SNP 2 Chr 2 pvalue
ATP13A1 GI_9966896-S rs4284750 19 rs873870 19 0.000101
CSTB GI_20357564-S rs9979356 21 rs3761385 21 0.000747
CTSC GI_22538439-I rs7930237 11 rs556895 11 0.020446
CTSC GI_22538438-I rs7930237 11 rs556895 11 0.636009
FN3KRP GI_20149679-S rs898095 17 rs9892064 17 0.015972
GAA GI_11496988-S rs11150847 17 rs12602462 17 0.240101
LAX1 GI_8923315-S rs1891432 1 rs10900520 1 0.205055
MBNL1 GI_41281590-S rs16864367 3 rs13079208 3 0.01683
MBNL1 GI_41281590-S rs7710738 5 rs13069559 3 0.938258
MBNL1 GI_41281590-S rs218671 17 rs13069559 3 0.178989
MBNL1 GI_41281590-S rs11981513 7 rs13069559 3 0.307821
PRMT2 GI_4504494-S rs2839372 21 rs11701058 21 0.4209
TRA2A GI_33620726-S rs7776572 7 rs11770192 7 0.51894
VASP GI_4507868-S rs1264226 19 rs2276470 19 0.645204
an untyped causal variant) can be flawed when the SNPs are close to one another [8].
Conclusions
There was no evidence of replication using the GAW19 data for previously found SNP associations with blood pressure phenotypes, possibly because of the low sample size. However, there was some evidence of replication for SNP–SNP interactions associated with transcription. This may be the result of a greater power to detect asso-ciations with transcription than with more distantly re-lated phenotypes.
Acknowledgements
Support for this work was provided by the Wellcome Trust (grant references 087436/Z/08/Z and 102858/Z/13/Z). JE receives scholarship and funding from Faculty of Medicine, Ramathibodi Hospital, Mahidol University, Bangkok, Thailand.
Declarations
This article has been published as part ofBMC ProceedingsVolume 10 Supplement 7, 2016: Genetic Analysis Workshop 19: Sequence, Blood Pressure and Expression Data. Summary articles. The full contents of the supplement are available online at http://bmcproc.biomedcentral.com/ articles/supplements/volume-10-supplement-7. Publication of the proceedings of Genetic Analysis Workshop 19 was supported by National Institutes of Health grant R01 GM031575.
Authors’contributions
RH conducted statistical analyses and drafted the manuscript. JE prepared data and helped conduct statistical analysis. RD prepared the sequence data. HJC conceived the overall study and critically revised the manuscript. All authors read and approved the final manuscript.
Competing interests
The authors declare they have no competing interests.
Author details
1Institute of Genetic Medicine, Newcastle University, Central Parkway,
Newcastle Upon Tyne NE1 3BZ, UK.2Division of Medical Genetics, Department of Internal Medicine, Faculty of Medicine Ramathibodi Hospital, Mahidol University, Rama VI Rd, Ratchathevi, Bangkok 10400, Thailand.
Published: 18 October 2016
References
1. Blangero J, Teslovich TM, Sim X, Almeida MA, Jun G, Dyer TD, Johnson M, Peralta JM, Manning AK, Wood AR, et al. Omics squared: human genomic, transcriptomic, and phenotypic data for Genetic Analysis Workshop 19. BMC Proc. 2015;9 Suppl 8:S2.
2. Eu-ahsunthornwattana J, Howey RA, Cordell HJ. Accounting for relatedness in family-based association studies: application to Genetic Analysis Workshop 18 data. BMC Proc. 2014;8 Suppl 1:S79.
3. Tragante V, Barnes MR, Ganesh SK, Lanktree MB, Guo W, Franceschini N, Smith EN, Johnson T, Holmes MV, Padmanabhan S, et al.
Gene-centric meta-analysis in 87,736 individuals of European ancestry identifies multiple blood-pressure-related loci. Am J Hum Genet. 2014;94(3):349–60.
4. Dudbridge F, Koeleman BP. Rank truncated product of P-values, with application to genomewide association scans. Genet Epidemiol. 2003;25(4):360–6.
5. Schumann E. Generating correlated uniform variates. COMISEF. 2009. http://comisef.wikidot.com/tutorial:correlateduniformvariates. 6. Yekutieli D, Benjamini Y. Resampling-based false discovery rate controlling
multiple test procedures for correlated test statistics. J Stat Plan Inference. 1999;82:171–96.
7. Hemani G, Shakhbazov K, Westra HJ, Esko T, Henders AK, McRae AF, Yang J, Gibson G, Martin NG, Metspalu A, et al. Detection and replication of epistasis influencing transcription in humans. Nature. 2014;508(7495):249–53. 8. Wood AR, Tuke MA, Nalls MA, Hernandez DG, Bandinelli S, Singleton AB,
Melzer D, Ferrucci L, Frayling TM, Weedon MN. Another explanation for apperent epistasis. Nature. 2014;514(7520):E3–5.
• We accept pre-submission inquiries
• Our selector tool helps you to find the most relevant journal • We provide round the clock customer support
• Convenient online submission • Thorough peer review
• Inclusion in PubMed and all major indexing services • Maximum visibility for your research
Submit your manuscript at www.biomedcentral.com/submit