STABILITY INDICATING METHOD DEVELOPMENT AND VALIDATION OF METFORMIN
AND ERTUGLIFLOZIN BY HIGH-PERFORMANCE LIQUID CHROMATOGRAPHY WITH PDA
DETECTION AND ITS APPLICATION TO TABLET DOSAGE FORM
KADALI JAGADEESH
1, ANNAPURNA N
2*
1Department of Basic Science, Shri Vishnu Engineering College for Women, Bhimavaram, Andhra Pradesh, India. 2Department of
Engineering Chemistry, AU College of Engineering (A), Andhra University, Visakhapatnam, Andhra Pradesh, India. Email: [email protected]
Received: 03 November 2018, Revised and Accepted: 04 January 2019 ABSTRACT
Objective: A sensitive, rapid, accurate, and precise stability indicating high-performance liquid chromatography method was developed and validated for the simultaneous estimation of metformin (MET) and ertugliflozin (ERT).
Methods: The planned chromatographic method was developed using Kromasil C18 column using 0.1 M sodium dihydrogen phosphate methanol (50:50, by volume, pH 4.0) as mobile phase system followed by peak area response measurement at 238 nm. The developed method was validated by means of ICH guidelines about system suitability, linearity, sensitivity, selectivity, accuracy, precision, robustness, and specificity.
Results: Calibration curves of MET and ERT are linear from 250 to 750 µg/ml and 3.75 to 11.25 µg/ml, respectively. Relative standard deviation is <2.0% and recovery is ̴ 100%. Successfully, the developed method was applied for the simultaneous determination of MET and ERT in tablets and to study degradation of MET and ERT in acidic, alkaline, oxidation, thermal, and photolytic degradation conditions. No obstructions from additional common excipients of tablets and degradants were observed.
Conclusion: The results recommended method suitability for the analysis of MET and ERT in quality control laboratories. Keywords: Antidiabetic agents, Metformin, Ertugliflozin, Degradation, Analysis.
INTRODUCTION
Ertugliflozin (ERT) is a selective inhibitor for sodium needy glucose cotransporters [1]. This cotransporter is responsible for reabsorption of glucose from glomerulus. ERT is prescribed for patients (adults) with Type II diabetes for controlling blood glucose level [2,3]. ERT belongs to gliflozins class of drug and is chemically described as (1S, 2S, 3S, 4R, 5S )-5-[4-Chloro-3-(4-ethoxybenzyl)phenyl]-1-(hydroxymethyl)-6,8-dioxabicyclo[3.2.1]octane-2,3,4-triol (Fig. 1).
Metformin (MET) is an antihyperglycemic drug which belongs to the biguanide category [4]. MET is an approved medication prescribed for the treatment of Type II diabetes. MET controls blood glucose level by decreasing hepatic production of glucose, decreasing gastrointestinal absorption of glucose, and increasing target cell sensitivity to insulin [5-7]. Chemically, MET is described as N,N-dimethylimidodicarbonimidic diamide (Fig. 1).
A fixed combination of ERT and MET was approved by FDA to control blood glucose level in Type II diabetic patients [8,9]. ERT and MET combination is used in addition to exercise and diet. ERT and MET combination is used for diabetic patients who are not satisfactorily controlled with a dosage containing ERT or MET alone.
A detailed survey for literature on ERT and MET combination reveals that no reported high-performance liquid chromatography (RP-HPLC) method for the assay of two drugs in combination. The current investigation aims at developing and validating rapid, simple, sensitive, accurate, and reproducible stability indicating RP-HPLC method to determine the concentration of ERT and MET for the application in tablets.
METHODS
Chemicals and materials
ERT and MET reference standard drugs were supplied by Lara drugs Pvt. Ltd., Hyderabad, India, and Rainbow Pharma Training Labs, Hyderabad, India. Segluromet™ (ERT 7.5 mg and MET 500 mg) tablets by Merck and Co., Inc., USA. Hydrogen peroxide, orthophosphoric acid, sodium dihydrogen phosphate, hydrochloric acid, and sodium hydroxide were purchased from Sd. Fine Chemicals Ltd., Mumbai, India. Methanol was purchased from Merck India Ltd., Mumbai, India. Water was acquired from a Milli-Q water system (Millipore, USA). For filtration of samples and mobile phase, 0.45 μm membrane filter was used.
Instruments and HPLC conditions
A waters alliance HPLC system (2695 module) coupled with photodiode array detector and equipped with an autosampler, degasser and column oven were used for the analysis. Empower 2 software was employed for data acquisition. Separation was performed using a Kromasil C18 column (250 mm×4.6 mm) with a particle size of 5.0 μm. The mobile phase consisting of 0.1 M sodium dihydrogen phosphate:methanol (50:50 v/v, pH 4.0) was delivered at 1.0 ml/minutes flow rate. Injection volume was 10 µl; detection wavelength was set at 238 and a total run time of 8 min. For quantification, the peak area response of ERT and MET was compared with corresponding calibration curves, wherein the peak area response of the calibration standards was plotted against their concentrations.
Preparation of stock and calibration standard solutions
ERT and MET stock solution was prepared in diluent (mobile phase) at a concentration of 5000 µg/ml (ERT) and 75 µg/ml (MET). Till its use, the stock solution was stored at 4°C. The calibration standard © 2019 The Authors. Published by Innovare Academic Sciences Pvt Ltd. This is an open access article under the CC BY license (http://creativecommons. org/licenses/by/4. 0/) DOI: http://dx.doi.org/10.22159/ajpcr.2019.v12i3.30626
solutions were made by successive dilution of the stock solution at the concentration ranges of 250–750 µg/ml and 3.75–11.25 µg/ml for ERT and MET, respectively.
Calibration graph
Five calibration solutions in the concentration range 250–750 µg/ml (MET) and 3.75–11.25 μg/ml (ERT and MET) were analyzed by the proposed method. For quantification, the peak area response of ERT and MET was compared with corresponding calibration curves, wherein the peak area response of the calibration standards was plotted against their concentrations. The intercepts and slopes of the calibration lines were also determined.
Assay of ERT and MET in combined tablet form
Ten tablets were weighed and powdered. Tablet powder corresponding to 500 mg of MET and 7.5 mg of ERT was transferred into 100 ml flask. 30 mL of mobile phase was added and then mixed. The solution was sonicated for 15 min and diluted to mark with mobile phase. The resultant solution was filtered using a 0.45 µm membrane filter and was appropriately diluted to get the test sample solution having 7.5 µg/ml (ERT) and 500 µg/ml (MET). Test sample solution (10 μl) was injected into the system and was analyzed using described HPLC conditions. The assay was repeated 3 times. The peak areas of ERT and MET were measured. The percentage of ERT and MET was calculated using a regression equation which was derived from the corresponding calibration curve.
Forced degradation studies
This was done by the following guidelines of an international conference on harmonization [10].
Acidic hydrolysis
An aliquot (10 ml) of tablet sample stock solution (75 μg/ml of ERT and 5000 µg/ml of MET) was transferred into 100 ml each volumetric flask, and then 10 ml of 0.1 N HCl was added. The contents of the flask were sonicated at room temperature for 30 min. Then, the flasks were cooled to room temperature, neutralized (by adding 0.1N NaOH) and diluted to 100 ml with mobile phase. Further, dilution with mobile phase was done to get 7.5 µg/ml for ERT and 500 µg/ml for MET. After filtration through 0.45 µm membrane filter, an aliquot (10 µl) from the solution was injected into the HPLC system. The proposed assay procedure is explained here.
Alkaline hydrolysis
An aliquot (10 ml) of tablet sample stock solution (75 µg/ml of ERT and 5000 µg/ml of MET) was transferred into 100 ml volumetric flasks, then 10 ml of 0.1 N NaOH was added. The flask with contents was allowed and sonicated at room temperature for 30 min. After cooling to room temperature, contents of the flasks were neutralized (by adding 0.1N HCl) and completed with mobile phase till the volume. Later, the solution was diluted with methanol to obtain 7.5 μg/ml for ERT and 500 µg/ml for MET, and then filtered using 0.45 µm membrane filter. An aliquot of 10 μl from the solution was applied into the HPLC system. The proposed assay procedure is explained here.
Oxidative degradation
An aliquot (10 ml) of tablet sample stock solution (75 µg/ml of ERT and 5000 µg/ml of MET) was transferred into 100 ml volumetric flasks, and then 10 ml of 30% H2O2 was added. The flask was allowed for sonication
at room temperature for 30 min and completed to 100 ml with mobile phase. To prepare the final concentration, further dilution was made with methanol to a concentration 7.5 µg/ml for ERT and 500 µg/ml for MET. After filtration through 0.45 µm membrane filter, 10 µl of solution was prepared and was applied into the HPLC system. The proposed assay procedure is explained here.
Thermal hydrolysis
Accurately weighed quantity of tablet powder corresponding to 500 mg
was heated in a hot air oven at 105°C for 30 min and was cooled to room temperature. The procedure is explained in section “Assay of ERT and MET in combined tablet form” is explained here.
Photolysis
An accurately weighed quantity of tablet powder equal to 500 mg of MET and 7.5 mg of ERT was placed in a Petrie dish. The Petric dish was kept under sunlight for 24 h. The Petric dish was cooled to room temperature, and this procedure is in section “Assay of ERT and MET in combined tablet form” is explained here.
RESULTS AND DISCUSSION Method development
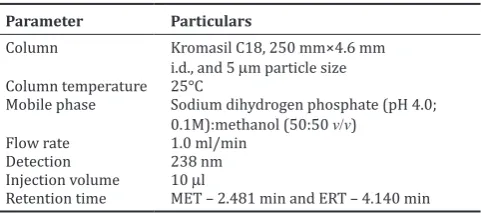
The experimental HPLC variables tested include the type of analytical column (Waters C18, Supelco C18, and Kromasil C18), type of buffer (orthophosphoric acid buffer and sodium dihydrogen phosphate buffer) pH of buffer (3, 4, and 5), percentage of methanol (40–60%), flow rate of mobile phase (0.8–1.2), and column temperature (25°C, 30°C, and 35°C). The overall chromatographic conditions for the separation of the studied drug peaks with adequate sensitivity, resolution, and peak shape are summarized in Table 1.The chromatogram obtained using optimized HPLC conditions and is presented in Fig. 2.
Method validation
This was done following guidelines of an international conference on harmonization [11].
System suitability
This parameter was used to evaluate the reproducibility of the HPLC system for the analysis of ERT and MET. In this method, using five duplicate injections of a standard drug solution containing 7.5 µg/ml of ERT and 500 µg/ml of MET were used. The parameters calculated were peak area, retention time, plate count, resolution, and peak symmetry (Table 2).
Selectivity
Selectivity of the proposed method was weighed by comparing the chromatograms obtained from the mobile phase blank, placebo blank, and tablet sample (7.5 µg/ml-ERT and 500 µg/ml–MET) with the chromatogram obtained from the standard drug solution (7.5 μg/ml–ERT and 500 µg/ml–MET). The chromatograms of the studied samples are shown in Fig. 3. No interfering peak was observed at the retention time of ERT and MET. Thus, it proved the method’s selectivity.
Linearity and sensitivity
Herein work, linear calibration graphs for MET and ERT were constructed by plotting the peak area of MET and ERT against MET and ERT concentrations. Regression data were summarized in Table 3. Linear regression analysis data of calibration graphs proved to be good linear association between the concentrations of studied drugs and their corresponding peak areas. The method showed linearity over
Table 1: HPLC parameters for the separation and analysis of ERT and MET
Parameter Particulars
Column Kromasil C18, 250 mm×4.6 mm i.d., and 5 µm particle size Column temperature 25°C
Mobile phase Sodium dihydrogen phosphate (pH 4.0; 0.1M):methanol (50:50 v/v)
Flow rate 1.0 ml/min
Detection 238 nm
Injection volume 10 µl
Retention time MET – 2.481 min and ERT – 4.140 min
Table 2: Test results for system suitability
Parameters Value obtained (mean of 5) RSD (%) Recommended value
Drug MET ERT MET ERT
-Retention time of drug (min) 2.480 4.135 0.046 0.105 RSD NMT 2%
Peak area of drug (mAU) 4786137 1246433 0.062 0.057 RSD NMT 2%
Plate count (N) 3659 7462 0.801 1.053 NLT 2000
Tailing factor (T) 1.428 1.523 0.313 0.293 NMT 2
Resolution (R) - 8.943 - 0.551 NLT
RSD: Relative standard deviation, NMT: Not more than, NLT: Not less than, MET: Metformin, ERT: Ertugliflozin
Fig. 1: Structure of metformin and ertugliflozin
Fig. 2: Ertugliflozin and metformin chromatogram obtained using optimized high-performance liquid chromatography conditions
the concentration range of 250–750 µg/ml and 3.75–11.25 µg/ml with a regression coefficient of 0.9999 and 0.9997 for MET and ERT, respectively.
Using limit of detection (LOD) and limit of quantitation (LOQ), the sensitivity of the method was assessed. The LOD and LOQ were calculated following ICH guidelines [11] and are presented in Table 3. Results point out good sensitivity of the proposed method.
Precision and accuracy
Precision and accuracy of standard drug solution (7.5 µg/ml–ERT and 500 µg/ml–MET) were used to verify the reproducibility of the developed HPLC method. Five replicate measurements were documented. Accuracy and precision were expressed in terms of percentage assay and percentage relative standard deviation, respectively. The values for accuracy and precision are good enough according to the ICH guidelines [11] as shown in Table 4.
Recovery test
Recovery tests (to further evaluate method accuracy) were carried out by adding standard drug at three different levels (50%, 100%, and 150% of label claim) to the preanalyzed sample solution [12,13]. The solutions were analyzed 3 times at each concentration level, using this method. The concentrations of MET and ERT were calculated from the corresponding calibration curve or regression equation. The results were shown in terms of percent recovery. Results shown in Table 5 represent good accuracy and no interference from the excipients of the tablet dosage form.
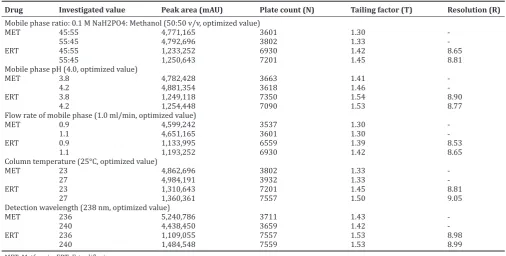
Robustness
In the present work, robustness was checked by determining the result of small changes in the HPLC experimental parameters. The parameters were studied in mobile phase composition, pH of the mobile phase,
column temperature, flow rate, and detection wavelength. It was observed that small differences in the HPLC experimental conditions did not considerably influence the results. This indicates that the new HPLC method is robust for the analysis of ERT and MET (Table 6).
MET and ERT forced degradation
Forced degradation testing of MET and ERT was carried out with tablet sample using ICH prescribed stress conditions [10]. Percentage degradation of MET and ERT under stress conditions applied was estimated and listed in Table 7. Degradation results indicate that ERT and MET are degraded more in thermal condition and less in oxidative condition. The retention times of degradants in all the conditions are present in Table 7. As the developed HPLC method could separate MET and ERT from their degradation products effectively, this method can be employed as a stability indicating method (Fig. 4). The MET and ERT peak purity was tested using a PDA detector. For peak purity testing, peak purity angle and peak purity threshold were determined in all the stress conditions. The values are shown in Table 7. MET and ERT peaks remain pure in all stressed samples using HPLC parameters.
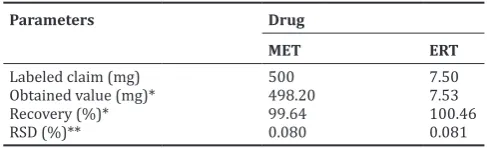
Application of the developed HPLC method
The HPLC method is applied for the determination of MET and ERT in their combined tablet form. The results (Table 8) indicate that the developed HPLC method is suitable for the assay of MET and ERT with good recoveries and low relative standard deviation. There are no interferences from commonly encountered excipients. The results recommend this method for its suitability in the analysis of MET and ERT in quality control laboratories.
CONCLUSION
Validated stability indicates that the HPLC method was developed for analyzing MET and ERT simultaneously. This method demonstrated a linear range of 250–750 µg/ml and 3.75–11.25 µg/ml for MET and ERT, respectively. Total analyzing time was <9 min which proved the quickness of the proposed method. The method is able to quantify MET and ERT in the presence of forced degradation products selectively and specifically, and the result shows that this is stability indicating method. The present method is applied with good accuracy and precision for the quantitation of MET and ERT in tablets. The results recommend the suitability of the method for the analysis of MET and ERT in quality control laboratories.
ACKNOWLEDGMENTS
Author, Kadali Jagadeesh, would like to thank Dr. G. Srinivasa Rao, Principal, Shri Vishnu Engineering College for Women, Bhimavaram and Dr. T. Sree Rama Murthy, Head, Department of Basic Sciences for providing necessary facilities to carry out the research work.
Table 3: Summary of regression data and sensitivity for MET and ERT
Parameters Value obtained
Drug MET ERT
Linearity (µg/ml) 250–750 3.75–11.25 Regression
equation PA=9559.784 x+4652.2 PA=164851.84 x+6929.4 Regression
coefficient (R2) 0.9999 0.9997
LOD (µg/ml) 0.563 0.038
LOQ (µg/ml) 1.878 0.127
PA: Peak area of drug, x: Concentration of drug, MET: Metformin, ERT: Ertugliflozin, LOD: Limit of detection, LOQ: Limit of quantitation
Table 4: Precision and accuracy of the proposed method
Drug Concentration (µg/ml) Peak area (mAU)* Determined (µg/ml)* Precision (%RSD)** Accuracy (%assay)*
MET 500 4784206 499.80 0.066 99.66
ERT 7.5 1244899 7.49 0.227 99.38
*Mean of five determined values; **relative standard deviation for five determined values, MET: Metformin, ERT: Ertugliflozin
Table 5: Recovery analysis of MET and ERT
Drug Spiked level Labeled claim (mg) Spiked (mg) Value obtained
Recovered (%)* RSD (%)**
MET 50 500 250 99.88 0.131
100 500 500 99.63 0.044
150 500 750 99.63 0.068
ERT 50 7.5 3.75 100.19 0.269
100 7.5 7.5 100.61 0.134
Table 6: Robustness test data for MET and ERT
Drug Investigated value Peak area (mAU) Plate count (N) Tailing factor (T) Resolution (R)
Mobile phase ratio: 0.1 M NaH2PO4: Methanol (50:50 v/v, optimized value)
MET 45:55 4,771,165 3601 1.30
-55:45 4,792,696 3802 1.33
-ERT 45:55 1,233,252 6930 1.42 8.65
55:45 1,250,643 7201 1.45 8.81
Mobile phase pH (4.0, optimized value)
MET 3.8 4,782,428 3663 1.41
-4.2 4,881,354 3618 1.46
-ERT 3.8 1,249,118 7350 1.54 8.90
4.2 1,254,448 7090 1.53 8.77
Flow rate of mobile phase (1.0 ml/min, optimized value)
MET 0.9 4,599,242 3537 1.30
-1.1 4,651,165 3601 1.30
-ERT 0.9 1,133,995 6559 1.39 8.53
1.1 1,193,252 6930 1.42 8.65
Column temperature (25°C, optimized value)
MET 23 4,862,696 3802 1.33
-27 4,984,191 3932 1.33
-ERT 23 1,310,643 7201 1.45 8.81
27 1,360,361 7557 1.50 9.05
Detection wavelength (238 nm, optimized value)
MET 236 5,240,786 3711 1.43
-240 4,438,450 3659 1.42
-ERT 236 1,109,055 7557 1.53 8.98
240 1,484,548 7559 1.53 8.99
MET: Metformin, ERT: Ertugliflozin
Table 7: Forced degradation and peak purity test results of MET and ERT
Degradation type Drug Degradation (%) Purity angle Purity threshold Retention time of degradants (min)
Acidic hydrolysis MET 11.44 0.265 0.590 3.293 and 3.833
ERT 11.98 0.301 0.686
Alkaline hydrolysis MET 9.23 0.282 0.687 1.675 and 2.087
ERT 9.71 0.210 0.586
Oxidative degradation MET 8.39 0.378 0.787 1.453, 1.919, 2.138, 3.259, 3.728, 6.124, and 6.795
ERT 9.00 0.201 0.483
Thermal degradation MET 12.42 0.382 0.786 3.273, 3.798, 6.303, and 6.779
ERT 13.09 0.298 0.581
Photolysis MET 11.32 0.282 0.687 0.802, 1.568, 3.273, and 3.794
ERT 11.73 0.300 0.584
MET: Metformin, ERT: Ertugliflozin
AUTHOR’S CONTRIBUTIONS
KJ has done this investigation work under the guidance of Dr. NA.
CONFLICTS OF INTEREST
Authors declare that none of the conflicts of interest present in this investigation.
REFERENCES
1. Marlene B. FDA Approves SGLT2 Inhibitor Ertugliflozin for Type 2 Diabetes. Medscape; 2017. Available from: https://www.medscape. com/viewarticle/890446.
2. From the medical letter on drugs and therapeutics. Ertugliflozin for Type 2 diabetes. JAMA 2018;319:2434-35.
3. Cinti F, Moffa S, Impronta F, Cefalo CM, Sun VA, Sorice GP, et al.
Spotlight on ertugliflozin and its potential in the treatment of Type 2
diabetes: Evidence to date. Drug Des Devel Ther 2017;11:2905-19. 4. Wang YW, He SJ, Feng X, Cheng J, Luo YT, Tian L, et al. Metformin:
A review of its potential indications. Drug Des Devel Ther 2017;11:2421-9.
5. Rena G, Hardie DG, Pearson ER. The mechanisms of action of metformin. Diabetologia 2017;60:1577-85.
6. Madiraju AK, Qiu Y, Perry RJ, Rahimi Y, Zhang XM, Zhang D, et al.
Metformin inhibits gluconeogenesis via a redox-dependent mechanism
in vivo. Nat Med 2018;24:1384-94.
7. Madiraju AK, Erion DM, Rahimi Y, Zhang XM, Braddock DT, Albright RA, et al. Metformin suppresses gluconeogenesis by inhibiting mitochondrial glycerophosphate dehydrogenase. Nature 2014;510:542-6.
8. FDA Approves Segluromet. Available from: https://www.drugs. com/newdrugs/fda-approves-segluromet-ertugliflozin-metformin-hydrochloride-type-2-diabetes-4669.html.
9. Ertugliflozin/Metformin (By Mouth). PubMed Health, 2018. Available from: https://www.ncbi.nlm.nih.gov/pubmedhealth/ PMHT0031142/?report=details.
10. International Conference on Harmonization (ICH) of Technical Requirements for the Registration of Pharmaceutical for Human Use Stability Testing of New Drugs Substance and Products. Geneva, Switzerland: Q1A (R2); 2003.
11. International Conference on Harmonization; Validation of Analytical Procedures: Text and Methodology, Q2 (R1). Geneva, Switzerland: IFPMA; 2005.
12. Hemant KJ, Umakant SJ. Development and validation of RP-HPLC method for estimation of darunavir ethanolate in bulk and tablets. Int J Pharm Pharm Sci 2015;7:386-9.
13. Babu GR, Rao AL, Rao JV. A rapid RP-HPLC method development and validation for the quantitative estimation ribavirin in tablets. Int J Pharm Pharm Sci 2015;7:60-3.
Table 8: Quantification of MET and ERT by the proposed HPLC method
Parameters Drug
MET ERT
Labeled claim (mg) 500 7.50
Obtained value (mg)* 498.20 7.53
Recovery (%)* 99.64 100.46
RSD (%)** 0.080 0.081