37
Volume LIX 5 Number 1, 2011
EVALUATION OF SOIL CONSERVATION
TECHNOLOGIES FROM THE PERSPECTIVE OF
SELECTED HYDRO-PHYSICAL SOIL PROPERTIES
AND INFILTRATION CAPACITY OF THE SOIL
M. Dumbrovský, I. Kameníčková, J. Podhrázská, F. Pavlík, V. Sobotková
Received: September 10, 2010
Abstract
DUMBROVSKÝ, M., KAMENÍČKOVÁ, I., PODHRÁZSKÁ, J., PAVLÍK, F. SOBOTKOVÁ, V.: Evaluation of soil conservation technologies from the perspective of selected physical soil properties and infi ltration capacity of the soil. Acta univ. agric. et silvic. Mendel. Brun., 2011, LIX, No. 1, pp. 37–48
This paper evaluates diff erent technologies of soil cultivation (conventional and minimization) in terms of physical properties and water regime of soils, where infi ltration of surface water is a major component of subsurface water. Soil physical properties (the current humidity, reduced bulk density, porosity, water retention capacity of soil, pore distribution and soil aeration) is determined from soil samples taken from the organic horizon according to standard methodology. To observe the infi ltra-tion characteristics of surface layers of topsoil, the drench method (double ring infi ltrometers) was used. For the evaluation of fi eld measurements of infi ltration, empirical and physically derived equa-tions by Kostiakov and Philip and the three-parameter Philip-type equation were used. The Philip three-parameter equation provides physical based parameters near the theoretical values, a good es-timation of saturated hydraulic conductivity Ks and sorptivity C1. The parameter S of Philip’s equation describes the real value of the sorptivity of the soil. Experimental research work on the experimental plots H. Meziříčko proceeded in the years 2005–2008.
infi ltration capacity, minimization tillage, conventional tillage, soil erosion, hydraulic conductivity
Soil belongs among the irrecoverable natural trea-sures of our country and is a characteristic compo-nent of the landscape. Fertility, which is infl uenced by many factors (soil processing technologies, crop-plant stands establishment), is an important charac-teristic of soil. The preservation of soil fertility and its ecological functions should always be the con-cern of the soil management (Hůla, 1997). Methods of soil processing infl uence the soil resistance to wa-ter and wind erosion. Currently, more than a half of the area of the topsoil in the Czech Republic is po-tentially endangered by water erosion and nearly 10 % of the topsoil is endangered by wind erosion (Janeček et al., 2002). The increasing erosion of soil is a global problem with high economical and envi-ronmental impact.
The infi ltration capacity is an important fac-tor within the soil protection against water ero-sion. When the infi ltration capacity of the surface layers of the soil is low, the required water infi ltra-tion doesn’t happen and surface drain and related negative phenomena take place. The proper infi ltra-tion capacity of the soil infl uences a wide range of soil parameters, hydro-physical soil properties, and chemical and biological soil properties.
When soil is processed in a conventional way, a homogeneous layer with horizontal structure of the pores originates; when it is processed by the minimization, a vertical structure of the pores (earthworms, fi ssures) originates. The minimization soil processing off ers an increase of the conductivi ty and infi ltration capacity, the reduction of surface drain and the erosion risk. Conservative technology can reduce the surface drain and increase the infi l-tration (Schipitalo et al., 2000).
MATERIALS AND METHODS
Description of the Experimental Area The experimental areas are situated in the cadas-tre of Horní Meziříčko, Jindřichův Hradec district, near the Jilem-Strmilov road. From the geological point of view, it belongs to the area of the Mrákotín Highlands. The terrain is hilly with large diff erences in altitude. The elevation of the plots is 645 m above the sea-level.
The western part of the monitored area is situated in the basin of Nežárka; the eastern part in the basin of the river Dyje. The drainage network is composed of a number of small streamlets that run through terrain depressions from west to east and, gradually, leave the area of interest.
For the characterization of climatic conditions of the location, the data related to the closest weather station – Telč (527 m a. s. l.) – were used. It is a slightly cool area where the average year temperature is around 6.5 °C and the average year precipitation amount is 617 mm (The Climate of Czechoslovakia – charts, Hydrometeorological Institue Prague 1960).
Both experimental areas are situated close to each other; they are slightly steep with southern expo-sure. The layout of soil profi le:
• 0–30 cm: Ap – topsoil horizon created by plough-ing and common cultivation,
• 30–40 cm: B – transitional horizon, • 40 cm and more: C–parent material.
On the soil forming substrate of paragneisses, the dystric cambisol emerged through weathering. The depth of the soil is limited by strong skeletal soil. The structure of the soil is indistinctive, the humus content reaches 1.5 %. Basic soil type: light soil – loamy sand.
The Stagra Studená Company processes the soil by minimization since 1992. It uses the HORSCH SE3 No-Till Seed Drills, whose function is based on a shallow cutting of the top layer of the soil up to the depth of 150 mm with simultaneous printed sowing. The cutter creates a base for the seed which is then covered by the soil and post-harvest remains. The ploughs are not used for soil preparation. The private farmer Mr. Matoušek uses a conventional method of farming, based on a yearly ploughing with ploughs to the depth of 300 mm with subse-quent operations aimed to prepare the land for sowing.
Since 2005, the lands were seeded alternatively with winter and spring crops. In the conventional way of soil processing: fi eld pea (Pisum sativum L.), winter wheat (Triticum aestivum L.), spring barley (Hordeum vulgare L.) and rapeseed (Brassica napus L.); using the minimalization way of soil processing: fi eld pea (Pisum sativum L.), Triticale, corn (Zea mays L.), winter wheat (Triticum aestivum L.). With regard to the diff erent composition of cultivated crops, the results of the examination of infi ltration character-istics of the soil processed by diff erent technologies were mainly compared from the point of view of agrotechnical operations (winter and spring crops) at the same time and under the same conditions, but also for particular crops cultivated within the particu lar year.
Physical Characteristics of the Soil
Each experimental area was characterized by a borrow pit near the drench infi ltration experi-ments, from which disturbed and undisturbed soil samples were taken (KV with a uniform volume of 100 cm3) from the plough layer (10, 20, 30 cm) in
three repetitions.
In the pedology laboratory of the Institute of Landscape Water Management of the Faculty of Civil Engineering at the University of Technology in Brno, the physical properties of the soil (the cur-rent humidity, reduced bulk density, porosity, water retention capacity, presentation of individual pores and aeration) were evaluated according to the stan-dard methodology, i.e. by a basic analysis of intact soil samples, which was completed by pycnometric determination of density (Jandák, 2003).
In the monitored period 2005–2008, the taking of soil samples was performed at the same time as monitoring of the infi ltration capacity of the soil on experimental areas.
Drench infi ltration
The drench infi ltration experiments using the double-cylinder method were carried out repeat-edly on experimental areas. Four sets of infi ltration cylinders were used, with inner diameters of: 25.4, 26.3, 35.7 and 35.8 cm. Outer cylinder diameters: 35.2, 35.7, 51.37 and 52 cm.
From 2005 to 2008, 10 sets of measurements were carried out. In 2005, two measurements were per-formed in June and one in August. In 2006, two measurements were performed in April and two in August. In 2007, two sets of measurements were performed in April and June and one in October. In 2008, two measurements were performed in each month of April, June and August.
in-fusion of water doses. The cumulative infi ltration it, depending on the time t was monitored in the in-ner cylinder; the infi ltration of water from the outer cylin der ensured the verticality of the stream lines in the inner cylinder. During the experiment, the same minimum water level, overpressure minimali-zation (1–3 cm), was maintained in both cylinders.
The measurements were performed by adding a known amount of water (1 lt) over the reference level stabilized by the measurement spire (1 or 1.5 cm). The time of adding the dose of water was recorded. The particular experiments were ter-minated when a constant rate of infi ltration was reached. In the case of cylinders with slow infi ltra-tion speed, the experiments were limited by time, each lasting a minimum two hours. Before the infi l-tration started, samples had been taken to evaluate the current humidity which infl uences the infi ltra-tion process at the beginning.
Algebraic infi ltration equations, both empiric and physically derived, were used for the evalua-tion (Kutílek et al., 1994). The equaevalua-tions of the above mentioned authors were selected due to the shallow soil horizon and the expected deformation of the vertical component.
The Kostiakov’s equation is based on a
hyper-bolic shape of the curve; it is suitable for the initial stage of the process. The infi ltration speed vt and cu-mulative infi ltration itare calculated from the fol-lowing relations:
vt = v1 × t−, (1)
v1
it = × t1−, (2)
1− where:
v1 – infi ltration speed at the end of the fi rst time unit [cm.min−1],
t – time elapsed from the beginning of the infi ltra-tion [min],
– exponent depending on the characteristics of the soil and the beginning moisture.
The linear form of the equation for the evaluation of the infi ltration is quoted in the following form:
v1
log it = log (1−) log t× t1−, (3) 1−
which can be taken as the equation of the line y = ax + b, where y = log it, a =1 − , x = log t, b = log v1/1 − .
The parameters of the a, b line are determined by line ar regression of the minimalization of the squares of the deviations.
The Philip’s equation is based on a
semi-ana-lytic solution of the vertical infi ltration by the per-turbation method in the form of an infi nite number series; it is suitable for relatively short and medium time periods. The algebraic equation only considers its fi rst two members:
vt = 1/2 St−1/2 + A, (4)
it = St1/2 + At, (5)
where:
S – sorptivity [cm.min−1/2], cumulative amount of
water infi ltrated within the time t = 1.
A – parameter with the speed proportion [cm. min−1].
The parameters S, A are determined from a system of two equations with two unknowns using the de-terminants or using the GEM.
The parameter S of the equation (5) is the approxi-mation of sorptivity; it favorably represents the real value of sorptivity, the error of approximation is theo retically not higher than 10 % (Kutílek et al., 2004).
The three-parameter Philip-type equation
con-siders only the fi rst three members:
1 3
vt = C1t−1/2 + C
2 + C3t1/2, (6)
2 2
it = C1t1/2 + C
2t + C3t3/2, (7)
where:
C1 – estimation of sorptivity [cm.min−1/2],
C2, C3 – equalizing process parameters, C2 [cm. min−1], C
3 [cm.min−3/2].
It is solved as a system of three equations with three unknowns using the determinants or using the GEM.
From the equation (7), the “limit“ time lyis deter-mined, as well as the speed of infi ltration K within this time period, which represents a good estimation of the saturated hydraulic conductivity:
C1
tlim = 3C , (8)
3
K = (C1C3)1/2 + C
2. (9)
To estimate the saturated hydraulic conductivity Ks from the drench infi ltration measurement, the three-parameter Philip-type equation (7) and a rela-tion derived from it were used.
RESULTS AND DISCUSSION
Physical Characteristics of the Soil The results of physical characteristics of the soil are listed in the form of a table. Tab. I.a and I.b rep-resent the average values of physical characteristics depending on the depth of taking from the topsoil horizon in the individual examination years for ex-perimental fi elds with diff erent types of soil pro-cessing.
The current humidity () shows the current content of water in the soil; it infl uences the infi ltration pro-cess at the beginning.
com-pression. The bulk density increases with the depth of the soil profi le as well as in the individual years of examination. In the last year, a decrease is noted and the values are, in eff ect, nearly the same as in the fi rst year of examination. In the case of minimization technology, the bulk density is higher than in the case of ploughing and it increases more uniformly with increased depth. The critical values, evidencing a harmful concretion of the soil (Lhotský, 1984: loamy sand d critical = 1.6 g.cm−3) were demonstrated
in the case of conventional processing only in 2007 at the depth of 20 cm and, in the case of minimiza-tion, in the years 2007–2008 in major depths of the topsoil. According to the values of bulk density, the structural situation of humus horizon was roughly evaluated; in both technologies of soil processing it is characterized as unsatisfactory d = 1.4–1.6 g.cm−3
(Kutílek, 1978).
The porosity refl ects the instantaneous represen-tation of the volume of the pores within the total volu me of the soil. It is one of the main indicators of the spatial layout of the soil mass; in the pores, all physi cal, physiochemical and biological pro-cesses take place. In the soil pores, the development and growth of rootlets takes place. A small amount of pores or their unsatisfactory size disables the de-velopment of the root system. Based on the porosity values, the settlement of the soil and, indirectly, the soil structure is evaluated. The critical values of po-rosity (Lhotský, 1984: PK < 40) were evidenced in both methods of soil processing. In the case of con-ventional processing, the critical values were
evi-denced in major topsoil depths; in the case of min-imization, since 2006. The soil can be classifi ed according to the porosity (Bretfeld). In the case of conventional processing, the topsoil was settled (P = 40–50 %) during the whole period of monitoring. In the case of minimization, the topsoil was settled in the fi rst half of the period of monitoring and very settled (P < 40) in its second half.
The water retention capacity (RK) characterizes the humidity of the soil that remains in the soil for a lon-ger period a er it being moisturized by seepage forces. It approximately characterizes the volume of the so-called capillary pores. It is practically iden-tical with the fi eld retention capacity. In the moni-tored period, both experimental areas showed pro-gressive decrease of the retained water in the soil, related to the regional climatic conditions (decrease of precipitations, increased air temperature). In the particular years studied, the maximums are reached in the top layer of the topsoil and the values de-crease with major depth. The retained water quickly disappears from the topsoil horizon to major depths of the soil profi le (loamy sand). Its representation is signifi cantly below the average, which manifests in the form of an unsatisfactory representation of capil lary pores.
The capillary pores (Pk) lead the water against gravi-tation; their value is approximately the same as the value of the water retention capacity. The optimal share of capillary pores is about 2/3 of the values of porosity. An abundance of capillary pores makes the infi ltration more diffi cult. The soil receives too lit-I: a) Physical parameters of the soil, conventional soil processing
Year 2005 2006 2007 2008
Depth [m] 0.10 0.20 0.30 0.10 0.20 0.30 0.10 0.20 0.30 0.10 0.20 0.30
d [g.cm−3] 1.45 1.47 1.49 1.47 1.45 1.43 1.51 1.60 1.57 1.45 1.45 1.54
[% vol.] 26.13 25.25 23.00 25.20 26.42 21.20 18.60 21.31 20.81 17.30 18.75 17.56
RK [% vol.] 25.36 24.80 21.60 25.01 23.00 18.62 23.34 21.71 21.90 21.72 20.26 19.71 P [% vol.] 45.00 43.20 42.80 43.48 42.85 41.71 42.12 38.00 40.38 42.10 40.73 37.25 PK [% vol.] 25.36 24.80 21.60 25.01 23.00 18.62 23.34 21.71 21.90 21.72 20.26 19.71
PS [% vol.] 9.15 10.50 9.25 7.88 10.29 7.78 8.88 9.26 9.06 8.59 8.38 6.84
PN [% vol.] 12.10 8.94 12.64 10.58 9.56 12.31 9.90 7.03 9.42 11.79 12.10 10.70
VZ [% vol.] 18.87 17.95 19.80 18.28 16.44 20.51 23.53 16.68 19.57 24.79 21.98 19.69
I: b) Physical parameters of the soil, minimization soil processing
Year 2005 2006 2007 2008
Depth [m] 0.10 0.20 0.30 0.10 0.20 0.30 0.10 0.20 0.30 0.10 0.20 0.30
d [g.cm−3] 1.49 1.55 1.58 1.51 1.55 1.60 1.57 1.61 1.64 1.45 1.55 1.57
[% vol.] 26.00 25.19 22.35 26.36 24.46 22.50 18.32 21.01 17.94 18.42 18.07 17.47
RK [% vol.] 27.20 24.15 21.05 24.15 22.18 18.16 23.58 22.55 19.86 22.56 20.90 19.85 P [% vol.] 43.20 41.00 40.00 42.22 40.10 39.50 39.63 37.74 38.24 41.41 37.14 36.65 PK [% vol.] 27.20 24.15 21.05 24.15 22.18 18.16 23.58 22.55 19.86 22.56 20.90 19.85
PS [% vol.] 8.45 8.95 10.00 6.35 6.82 9.10 8.38 9.54 11.96 7.47 6.57 7.05
PN [% vol.] 11.05 10.12 12.65 10.02 9.53 12.23 7.68 5.65 6.43 11.33 8.37 9.51
tle water, the moisturization only works in shallow depths, the precipitations are not effi ciently used and surface drainage occurs with the danger of slope erosion.
The non-capillary pores (Pn) enable the water to enter the soil and reach major depths. An abundance of those does not make the surface layer more humid, as the speed of the infi ltration cannot ensure the satu ration of capillary pores. The roots of the plant are not supplied with suffi cient water.
The semi-capillary pores (Ps) are a transition category between the capillary and the non-capillary pores; the gradual fi xation of the groundwater level hap-pens in them. They enable a good penetration of the water into the soil and, by its retention, enable the saturation of capillary pores in major depths. In both technologies of soil processing, the shares of the particular types of capillary pores are relatively negative during the whole period of examination. The representation of capillary pores does not reach the optimum level (ca. 55 %), and the share of non-capillary pores is also relatively high. In the case of conventional processing, they are prevalent
practi-cally all the time; in the case of minimalization, only in 2005, 2006, and 2008. There is not enough water for the vegetation in the soil, the water is outside the reach of the roots of the plants.
The aeration of the soil (instantaneous) indicates the proportion of the volume of the air in the sam-ple and the column of the samsam-ple; it depends on the humidity of the soil. The optimum aeration of top-soil horizons in a good cultural condition is about 18–24 % vol. If the aeration is low, the change of the air in the soil is too slow; a high value indicates an excessive activity of the aerobic organisms and a fast degradation of the humus. The optimum aeration was not reached, in the case of conventional pro-cessing, at a depth of 0.20 m within the years 2005– 2007. In the case of minimalization, the aeration of the topsoil layer is insuffi cient in the fi rst half of the monitored period; in the following year, it is only noted at a depth of 0.20 m.
From the results achieved we can appreciate the fact that physical characteristics of the soil are dis-tinctively better in the case of conventional tech-nology, compared to the minimization. The
cam-II: The evaluation of the constant speed of infi ltration and the total cumulative infi ltration – conventional soil processing
Crop Year
Measurement
measured Kostiakov Philip three-parameter Philip-type eq.
time infi ltrat.cumul. constant speed of infi ltration
cumul. infi ltrat.
constant speed of infi ltration
cumul. infi ltration
constant speed of infi ltration
cumul. infi ltration
tc iT vc iT vc iT vc iT
min cm cm.min−1 cm cm.min−1 cm cm.min−1 cm
fi eld
pea
2005
1 122.18 36.56 0.19 33.77 0.24 36.07 0.22 35.77
2 121.88 19.91 0.06 16.42 0.10 18.60 0.14 19.39
3 130.08 36.73 0.22 37.73 0.26 38.88 0.22 37.96
winter wheat 2006
4 105.40 17.95 0.09 16.74 0.12 17.83 0.13 18.05
5 110.00 18.00 0.09 17.54 0.12 17.85 0.13 18.07
6 128.17 12.42 0.05 10.87 0.07 12.19 0.09 12.49
7 121.70 38.48 0.27 39.26 0.27 38.42 0.23 37.68
spring barley 2007
8 118.67 45.88 0.21 40.28 0.30 45.15 0.32 45.56
9 135.67 28.02 0.10 25.14 0.13 27.50 0.15 27.92
10 150.80 44.76 0.24 53.03 0.18 46.93 0.20 43.45
11 165.22 18.43 0.04 15.12 0.07 17.16 0.13 18.86
rapeseed 2008
12 150.00 21.72 0.06 21.73 0.06 21.77 0.08 22.38
13 119.13 13.92 0.05 12.47 0.08 13.99 0.08 14.01
14 129.42 25.67 0.09 22.81 0.13 24.61 0.19 25.92
15 151.58 12.93 0.04 13.18 0.03 12.80 0.04 13.20
16 138.37 14.92 0.05 13.01 0.07 14.53 0.09 14.79
17 125.42 57.12 0.32 61.31 0.28 57.53 0.24 56.64
ø 130.81 27.26 0.13 26.49 0.15 27.17 0.16 27.18
ø winter crops 127.92 23.31 0.11 22.89 0.12 23.15 0.13 23.32
ø spring crops 134.93 32.90 0.15 31.64 0.18 32.90 0.20 32.70
ø fi eld pea 124.72 31.07 0.16 29.31 0.20 31.18 0.19 31.04
ø wheat 116.32 21.71 0.13 21.10 0.15 21.57 0.15 21.57
ø barley 142.59 34.27 0.15 33.39 0.17 34.18 0.20 33.95
bisol refl ects the change of the technology of soil processing quite quickly and signifi cantly; it pres-ents a higher variance of results of the indicator and a higher vulnerability.
Field Infi ltration Measurements In the years 2005–2008, 35 infi ltration experi-ments were performed on the experimental areas with diff ering technologies of soil processing. The experiments were evaluated using the algebraic empiric equations (Kostiakov) and physically de-rived equations (Philip, three-parameter Philip-type equation). The results of the experimental measure-ments were processed using Excel and are sum-marized in the tables, Tab. II–IV, and in diagrams, Fig. 1–8.
In the upper part of the tables II and IV, the total time of the realization of the experiment tc is stated, as well as the measured and calculated cumulative infi ltration it and the constant speed of infi ltration vc. In the lower part of the table, the averages, i.e. the arithmetic average of all infi ltration experiments for every experiment area, are stated depending on the agrotechnical operation performed (winter crop,
spring crop) and for the crop grown in the particu-lar year.
In the upper part of the tables III and V, the pa-rameters of infi ltration equations are stated, as well as the estimation of the saturated hydraulic conduc-tivity Ks for individual infi ltration experiments.
In the lower part, the average parameters of infi l-tration equations and the Ks of all values reached for every experiment area are stated, depending on the agrotechnical operation performed (winter crop, spring crop) and for the crop grown in the particu-lar year.
Since the data volume is not extensive, the average values can only serve as orientation indicator for the assessment of the diff erences between the results of the particular measurements.
For the evaluation of the infi ltration experiments, the most effi cient, from the point of view of the fl ex-ibility, time stability and quality of infi ltration data smoothing, is the use of a three-parameter Philip-type equation, which off ers a good estimation of the saturated hydraulic conductivity K, and the pa-rameter C1 can be awarded a physical importance (good sorptivity approximation). The parameter S of the Philip equation favorable represents the real
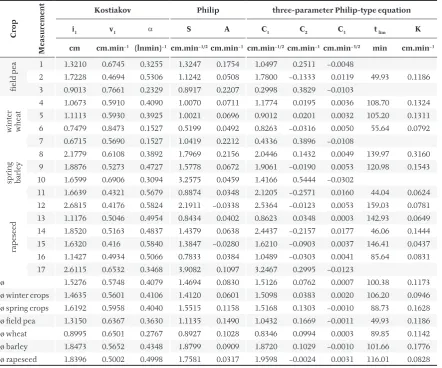
III: Infi ltration equations’ parameters – conventional soil processing
Crop
Measurement
Kostiakov Philip three-parameter Philip-type equation
i1 v1 S A C1 C2 C3 t lim K
cm cm.min−1 (lnmin)−1 cm.min−1/2cm.min−1 cm.min−1/2cm.min−1 cm.min−3/2 min cm.min−1
fi eld
pea 12 1.72281.3210 0.46940.6745 0.32550.5306 1.32471.1242 0.17540.0508 1.04971.7800 −0.13330.2511 −0.00480.0119 49.93 0.1186
3 0.9013 0.7661 0.2329 0.8917 0.2207 0.2998 0.3829 −0.0103
winter wheat
4 1.0673 0.5910 0.4090 1.0070 0.0711 1.1774 0.0195 0.0036 108.70 0.1324
5 1.1113 0.5930 0.3925 1.0021 0.0696 0.9012 0.0201 0.0032 105.20 0.1311
6 0.7479 0.8473 0.1527 0.5199 0.0492 0.8263 −0.0316 0.0050 55.64 0.0792
7 0.6715 0.5690 0.1527 1.0419 0.2212 0.4336 0.3896 −0.0108
spring barley
8 2.1779 0.6108 0.3892 1.7969 0.2156 2.0446 0.1432 0.0049 139.97 0.3160
9 1.8876 0.5273 0.4727 1.5778 0.0672 1.9061 −0.0190 0.0053 120.98 0.1543
10 1.6599 0.6906 0.3094 3.2575 0.0459 1.4166 0.5444 −0.0302
11 1.6639 0.4321 0.5679 0.8874 0.0348 2.1205 −0.2571 0.0160 44.04 0.0624
rapeseed
12 2.6815 0.4176 0.5824 2.1911 −0.0338 2.5364 −0.0123 0.0053 159.03 0.0781
13 1.1176 0.5046 0.4954 0.8434 0.0402 0.8623 0.0348 0.0003 142.93 0.0649
14 1.8520 0.5163 0.4837 1.4379 0.0638 2.4437 −0.2157 0.0177 46.06 0.1444
15 1.6320 0.416 0.5840 1.3847 −0.0280 1.6210 −0.0903 0.0037 146.41 0.0437
16 1.1427 0.4934 0.5066 0.7833 0.0384 1.0489 −0.0303 0.0041 85.64 0.0831
17 2.6115 0.6532 0.3468 3.9082 0.1097 3.2467 0.2995 −0.0123
ø 1.5276 0.5748 0.4079 1.4694 0.0830 1.5126 0.0762 0.0007 100.38 0.1173
ø winter crops 1.4635 0.5601 0.4106 1.4120 0.0601 1.5098 0.0383 0.0020 106.20 0.0946
ø spring crops 1.6192 0.5958 0.4040 1.5515 0.1158 1.5168 0.1303 −0.0010 88.73 0.1628
ø fi eld pea 1.3150 0.6367 0.3630 1.1135 0.1490 1.0432 0.1669 −0.0011 49.93 0.1186
ø wheat 0.8995 0.6501 0.2767 0.8927 0.1028 0.8346 0.0994 0.0003 89.85 0.1142
ø barley 1.8473 0.5652 0.4348 1.8799 0.0909 1.8720 0.1029 −0.0010 101.66 0.1776
value of soil sorptivity. A higher sorptivity was evi-denced in the case of conventional soil processing, where also a good conformity of parameters S and C1 was noted. In the case of minimalization, the in-fi ltration capacity of the top layers of the soil is sig-nifi cantly lower (53–60 %) and practically does not change (winter crops, spring crops, individual types of crops); the conformity of the S and C1 parameter was not demonstrated, as it was in the case of con-ventional processing.
For graphical representation, all equations were unifi ed in time and, using the Philip equation, the cumulative infi ltrations it and the infi ltration speeds
vt in the time t = 1, 5, 10, 15, 30, 60, 90 and 120 min-utes were calculated. The results are presented as averages, i.e. arithmetic average for experimental areas, in relation with the agrotechnical operation performed (winter crop, spring crop) and for the crop grown in the particular year, Fig. 1–8. The av-erage cumulative infi ltration is signifi cantly higher
in the case of conventional processing compared to the minimalization. This fact clearly results from the graphic presentation of cumulative infi ltration it(t) and the intensity of infi ltration vt(t), Fig. 1–8. Both experimental areas, depending on the agrotechni-cal operation performed, show a higher cumulative infi ltration in the case of spring crops; in the case of winter crops it is over 70 %. From the point of view of individual examination years, the highest cumu-lative infi ltration was reached on the spring barley fi eld (conventional processing) and the lowest, at the wheat fi eld (minimalization).
The estimated values of saturated hydraulic con-ductivity Ks are demonstrably higher in the case of conventional processing; in the case of minimaliza-tion they reach one third (spring crops average) to one half (total average, winter crops average). Similar results were documented by other authors, Šindelář et al., 2007, Matula et al., 2003.
IV: The evaluation of the constant speed of infi ltration and the total cumulative infi ltration – minimalization soil processing
Crop Year
Measurement
measured Kostiakov Philip 3PPT
time infi ltrationcumul. constantspeed of infi ltration
cumul. infi ltrat.
constant speed of infi ltration
cumul. infi ltrat.
constant speed of infi ltration
cumul. infi ltration
tc iT vc iT vc iT vc T
min cm cm.min−1 cm cm.min−1 cm cm.min−1 cm
fi eld
pea
2005
1 121.68 5.46 0.01 5.10 0.01 5.14 0.03 5.59
2 127.00 30.40 0.09 25.41 0.15 28.89 0.21 29.87
3 120.00 6.08 0.03 5.58 0.04 5.87 0.04 5.87
triticale 2006
4 126.00 9.06 0.03 7.85 0.04 8.81 0.06 9.32
5 135.80 14.35 0.06 13.57 0.07 14.31 0.08 14.36
6 135.00 17.19 0.06 14.87 0.08 16.27 0.11 16.92
corn 2007
7 180.00 29.54 0.08 28.11 0.11 31.30 0.10 30.69
8 203.25 13.82 0.02 11.08 0.03 13.31 0.06 13.98
9 169.18 27.99 0.06 24.20 0.11 26.25 0.13 27.86
10 152.83 14.81 0.03 13.27 0.03 13.27 0.05 14.42
11 163.28 16.59 0.04 13.99 0.06 15.28 0.09 16.13
12 207.00 3.50 0.002 3.02 0.003 3.35 0.02 3.35
w. wheat 2008
13 157.30 11.99 0.03 11.18 0.03 11.74 0.05 12.30
14 169.67 14.74 0.02 11.32 0.05 14.42 0.07 14.96
15 153.35 12.49 0.04 12.41 0.03 12.07 0.04 12.30
16 176.18 10.13 0.02 10.10 0.02 9.90 0.03 10.10
17 107.28 9.87 0.05 9.21 0.07 9.87 0.08 9.96
18 147.28 5.00 0.05 4.57 0.02 4.84 0.03 4.97
ø 152.89 14.06 0.04 12.49 0.05 13.61 0.07 14.05
ø winter crops 145.32 11.65 0.04 10.56 0.05 11.36 0.06 11.69
ø spring crops 143.49 14.82 0.04 12.94 0.06 14.38 0.08 14.82
ø fi eld pea 122.89 13.98 0.04 12.03 0.06 13.30 0.09 13.78
ø triticale 132.27 13.53 0.05 12.10 0.06 13.13 0.08 13.53
ø corn 153.79 15.24 0.03 13.40 0.05 14.92 0.07 15.33
V: Infi ltration equations’ parameters – minimalization soil processing
Crop
Measurement
Kostiakov Philip three-parameter Philip type equation
i1 v1 S A C1 C2 C3 t lim K
cm cm.min−1 (lnmin)−1 cm.min−1/2cm.min−1 cm.min−1/2cm.min−1 cm.min−3/2 min cm.min−1
fi eld
pea 12 1.30142.5620 0.28430.1737 0.71570.5263 1.63460.8274 −0.03280.0824 2.52221.1610 −0.2160−0.1327 0.01520.0066 55.3758.15 0.01960.1792
3 0.2658 0.6360 0.3640 0.2439 0.0267 0.2443 0.0265 0.00001 70.14 0.0288
triticale
4 1.0272 0.4205 0.5795 0.6515 0.0119 1.0233 −0.0090 0.0065 52.61 0.0511
5 0.7351 0.5937 0.4063 0.7406 0.0418 0.7886 0.0294 0.0007 75.15 0.0713
6 1.1957 0.5139 0.4861 0.9668 0.0373 1.3570 −0.0701 0.0068 66.85 0.0959
corn
7 1.8746 0.5214 0.4786 1.6315 0.0523 1.4100 0.1062 −0.0030
8 1.6872 0.3541 0.6459 0.8934 0.0028 1.3491 −0.0973 0.0050 89.76 0.0451
9 2.4007 0.4503 0.5497 1.2924 0.0558 2.1025 −0.0860 0.0068 102.32 0.1218
10 1.5489 0.4319 0.5681 0.8867 0.0242 1.7966 −0.1732 0.0103 58.25 0.0622
11 1.9850 0.3777 0.6223 1.0648 0.0082 1.7438 −0.1534 0.0090 64.34 0.0640
12 1.2575 0.1645 0.8355 0.3823 −0.0104 1.7438 −0.0988 0.0041 65.55 0.0015
w. wheat
13 1.7550 0.3660 0.6340 1.1599 −0.0178 1.5100 −0.1033 0.0049 103.31 0.0045
14 2.2000 0.3190 0.6810 0.8724 0.0180 1.2935 −0.0789 0.0052 82.89 0.0632
15 1.1830 0.4670 0.5330 1.1652 −0.0154 1.3258 −0.0561 0.0024 187.25 0.0408
16 1.1333 0.4229 0.5771 1.0440 −0.0225 1.2350 −0.0665 0.0023 177.42 0.0262
17 0.5511 0.6023 0.3977 0.4467 0.0489 0.5962 0.0058 0.0028 69.85 0.0772
18 0.5382 0.4286 0.5714 0.3856 0.0011 0.5754 −0.0458 0.0027 70.93 0.0219
ø 1.4001 0.4182 0.5651 0.9050 0.0174 1.3210 −0.0677 0.0049 80.56 0.0573
ø winter crops 1.1465 0.4593 0.5407 0.8258 0.0115 1.0783 −0.0438 0.0038 98.47 0.0502
ø spring crops 1.4331 0.3351 0.5204 0.8658 0.0223 1.3699 −0.0746 0.0050 62.44 0.0573
ø fi eld pea 1.3764 0.3647 0.5353 0.9020 0.0254 1.3092 −0.1074 0.0073 61.22 0.0759
ø triticale 0.9860 0.5094 0.4906 0.7863 0.0303 1.0563 −0.0166 0.0047 64.87 0.0728
ø corn 1.4615 0.3204 0.5130 0.8477 0.0208 1.4003 −0.0582 0.0039 63.18 0.0589
ø w.wheat 1.2268 0.4343 0.5657 0.8456 0.0021 1.0893 −0.0575 0.0034 115.28 0.0390
0,0 5,0 10,0 15,0 20,0 25,0 30,0
0 20 40 60 80 100 120 t [min]
i
t
[c
m
]
it - conv.t. it - min.t.
1: Cumulative infiltration it(t) – conv. and min. t. (total averages)
0,0 0,1 0,2 0,3 0,4 0,5 0,6 0,7 0,8 0,9
0 20 40 60 80 100 120 t [min]
v
t
[
c
m.
mi
n
-1]
vt - conv.t. vt - min.t.
0,0 5,0 10,0 15,0 20,0 25,0
0 20 40 60 80 100 120 t[min] i t [c m ] 0,00 0,10 0,20 0,30 0,40 0,50 0,60 0,70 0,80 0,90 vt [c m .m in -1]
it - conv.t., w.crops it - min.t., w.crops
vt - conv.t., w.crops vt - min.t., w.crops
3: Cumulative infiltration it(t) and intensity of infiltration vt(t) – conv. and min. t. (spring crops)
0,0 5,0 10,0 15,0 20,0 25,0 30,0 35,0
0 20 40 60 80 100 120 t [min] i t [c m ] 0,00 0,20 0,40 0,60 0,80 1,00 v t [ c m. mi n -1 ]
it - conv.t., s.crops it - min.t., s.crops vt - conv.t., s.crops vt - min.t., s.crops
4: Cumulative infiltration it(t) and intensity of infiltration vt(t) – conv. and min. t. (winter crops)
0,00 5,00 10,00 15,00 20,00 25,00 30,00 35,00
0 30 60 90 120
t [min] it
[c
m
]
it - conv.t., field pea it - conv.t., wheat it - conv.t., s. barley it - conv.t., rapeseed
5: Cumulative infiltration it(t) – conv. t. (field pea, wheat, spring bar-ley, rapeseed) 0,0 0,2 0,4 0,6 0,8 1,0 1,2
0 20 40 60 80 100 120
t [min] vt [cm. m in -1]
vt - conv.t., field pea vt - conv.t., wheat vt - conv.t., s. barley vt - conv.t., rapeseed
6: Intensity of infiltration vt(t) – conv. t. (field pea, wheat, spring bar-ley, rapeseed) 0,00 2,00 4,00 6,00 8,00 10,00 12,00 14,00 16,00
0 20 40 60 80 100 120 t [min]
it
[c
m
]
it - min.t., field pea it - min.t., triticale it - min.t., corn it - min.t., w. wheat
7: Cumulative infiltration it(t) – min. t. (field pea, triticale, corn, w. wheat) 0,000 0,100 0,200 0,300 0,400 0,500 0,600
0 20 40 60 80 100 120 t[min] vt [c m .m in -1]
vt - min.t., field pea vt - min.t., triticale vt - min.t., corn vt - min.t., w. wheat
SUMMARY
During the years 2005–2008, the measurements of hydro-physical soil properties were performed on two experimental plots with diff erent ways of soil cultivation, and area of minimizing cultivation (Stagra Studená) and a conventionally cultivated area (Matoušek company) in the Jindřichův Hra-dec District near the road Jilem – Strmilov. From the geological point of view this area belongs to the Mrakotin Highlands. The terrain is hilly with large diff erences in altitude. The altitude of the land is 645 m above the sea level. On the soil forming substrate of paragneisses, the dystric cambisol emerged through weathering. The depth of the soil is limited by strong skeletal soil. Basic soil type: light soil – loamy sand.
The Stagra have been farming by minimizing technology since 1992. This technology is based on shallow cutting the top layer of soil to the depth of 150 mm, together with printed sowing. The private farmer uses a conventional way of farming, based on ploughing by ploughs into the depth of 300 mm with subsequent operations to prepare land for sowing. There has been a rotation of winter crops and spring crops since 2005. Each experimental area was characterized by a borrow pit near the drench infi ltration experiments. Disturbed and non-disturbed soil samples were picked from there (KV with a uniform volume of 100 cm3) from the plough layer (10, 20, 30 cm) in three repetitions. The
physi-cal properties of soil (the current humidity, reduced bulk density, porosity, water retention capacity of individual pores and aeration) were evaluated according to standard methodology, i.e. by a basic analysis of intact soil sample, which was completed by pycnometric determination of density (Jandák, 2003). At the same time, the drench infi ltration experiments using the double-cylinder method were carried out. Four sets of infi ltration cylinders were applied, with inner diameters of: 25.4, 26.3, 35.7 and 35. 8 cm. The outer cylinder diameters were 35.2, 35.7, 51.37 and 52 cm. In 2005–2008, 10 sets of measurements were carried out.
During the reporting period 2005–2008 no signifi cant changes in soil physical properties connected with the used soil treatment technologies were observed. For assessment of the structural condition of the soil as an indicator of the impact of the technology of soil cultivation, the values of porosity and density (the critical value of soil compaction, structural condition of organic horizon) were used. The experimental areas show considerably compressed topsoil and the structural condition of the organic horizon is characterized as unsatisfactory. Due to the long-term degradation of agricultural land in the Czech Republic, the adjustment will be slow and depending on many factors.
The state of the soil can be assessed on the basis of water movement in the soil, thus by measuring of the infi ltration. The infi ltration capacity of soils is signifi cantly higher in the conventional treatment, while in the case of minimization it is less than half. This corresponds to the estimated values of satu-rated hydraulic conductivity Ks, which are one-third to one-half in size in the case of minimization. If that area showed a long-term decline in the values of Ks, then more negative eff ects would arise, i.e. compression of surface layers, increase of surface runoff , erosion hazards and reduction of crop yields.
If we classify the permeability of the soil according to the hydraulic conductivity K [m.day−1], the plot
with conventional cultivation belongs to diff erent group of soils than the plot with minimizing pro-cessing (Holý et al., 1984). According to Němec, the plot with the conventional treatment showed high permeability and the plot with minimizing treatment medium permeability, according to Kutílek it is moderate to large and medium, respectively.
To increase the infi ltration and retention capacity of soil with minimizing processing a consultation with specialist is required to propose appropriate agricultural measures promoting the infi ltration ca-pacity of soils.
Acknowledgements
The paper was elaborated with the support of the research project of the Ministry of Agriculture, Na-tional Agency for Agriculture Research, No. QH72203 “Proposals of Appropriate Agricultural Tech-nologies and Determination of New Indicators for the Assessment of Landscape Ecological Functions and Water Retention Capability”.
REFERENCES:
HOLÝ, M. et al., 1984: Odvodňovací stavby. SNTL/Alfa, Prague, 28.
HŮLA, J. et al., 1997: Zpracování půdy, 1st ed. Naklada-telství Brázda, s.r.o, Prague. ISBN 80-209-0265-1.
JANDÁK, J., 2003: Cvičení z půdoznalectví. MZLU Brno, 36–43.
JANEČEK, M. et al., 2002: The Soil protection from the Erosion. ISV, Prague.
Address
doc. Ing. Miroslav Dumbrovský, CSc., Ing. Ivana Kameníčková, Ph.D., Ing. František Pavlík, Ing. Veronika Sobotková, Ústav vodního hospodářství krajiny, Fakulta stavební, Vysoké učení technické v Brně, Veveří 95, 602 00 Brno, Česká republika, e-mail: [email protected], [email protected], pavlik.f@ fce.vutbr.cz, [email protected], Ing. Jana Podhrázská, Ph.D., Výzkumný ústav meliorací a ochrany půdy, v.v.i., pracoviště Brno, Lidická 25/27, 602 00 Brno, Česká republika, e-mail: podhrazska@vumopbrno. cz
KROULÍK, M., HŮLA, J., ŠINDELÁŘ, R., ILLEK, F., 2007: Water infi ltration into soil related to the soil tillage intensity. Soil & Water Research 2, 15–24. KUTÍLEK, M., 1978: Vodohospodářská pedologie. SNTL/
Alfa, Prague, 78.
KUTÍLEK, M. et al., 1994: Soil Hydrology. Catena Ver-lag, Germany.
PIMENTEL, D. et al., 1995: Environmental and economic cost of soil erosion and corservation bene fi ts. Science, 267, 1117–1123.