Design and Implementation of Energy
Efficient Environment Monitoring System
Nikita Gaikwad1, Prof. Kiran L. Inamdar 2, Prof.Yogita Mistry 3
P.G. Student, Department of Electronics &Telecommunication Engineering, Pillai HOC College of Engineering ,
Rasayani , Navi Mumbai , India1
Asst. Professor, Department of Electrical Engineering, Pillai HOC College of Engineering,
Rasayani, Navi Mumbai, India2
Asst. Professor, Department of Electronics & Telecommunication Engineering, , Pillai HOC College of Engineering ,
Rasayani ,Navi Mumbai , India3
ABSTRACT: This paper presents Energy Efficient Environment monitoring system with real time data collection capacity which monitors the environmental parameters temperature, humidity and LPG gas. Energy Efficiency of the system is achieved with power management technique. In this power management technique that is duty cycling with changing the sampling interval is proposed to reduce the power consumption of sensors and communication module. This system consists of wireless sensor node and network capable application processor (NCAP) PC. In order to achieve energy efficiency, wireless sensor node uses low power consumption, low cost PIC16F877 microcontroller and a low power and noise free zigbee S2 communication module with temperature, humidity and LPG gas sensors. Network capable application processor NCAP is nothing but a personal computer with graphical user interface (GUI).The wireless sensor node collects the data of all sensors and sends to the NCAP PC via Zigbee communication module. NCAP PC shows the monitoring parameters and finally data is stored in the database server for future analysis. Power consumption analysis of sensor node of system is also done.
KEYWORDS: Energy Efficiency, Environment Monitoring, Power management, Duty Cycling, WSN, Sampling Interval
I. INTRODUCTION
In recent years, wireless sensor network comes into prominence because it has the potential to revolutionize many segments of our life and economy.WSN gain attention and importance in many applications from environment monitoring and industrial production, to heath monitoring and transportation. It also plays a vital role in home automation, power management in intelligent building and most important to increase comfort and safety of human being and inhabitant [1].
In recent studies, environmental pollution is one of the major problems. One of the most important aspects of pollution is air pollution because the hazardous gases can spread suddenly in atmosphere. Air pollution can affect the people comfort, health and safety [3]. It causes various diseases like asthma, coronary artery, lung cancer, nausea, dizziness etc. There are various hazardous gases such as carbon dioxide, volatile organic compound; suspended Particulate matter etc. one of the hazardous gas is LPG that is liquefied petroleum gas. The leakage of unburned LPG gas is a major source of urban methane hydrocarbons in air. These Methane hydrocarbons are important precursor to the formation of ground level ozone. Therefore, to improve air quality it is necessary to monitor LPG gas concentration.
Environment monitoring is the field of protection and control. It also provides a real time system and communicates with the physical world. Environment monitoring system is a measurement embedded device which monitors the environmental parameter temperature, humidity and hazardous gases etc. It consists of sensor nodes and base station. Sensor node communicates with the base station wirelessly and transmits the collected sensor data. Collected data from the base station is finely sent to the server for user interface. It also consists of data logger for further storage.
Energy efficiency addresses the power consumption. One of the most challenging problem of wireless sensor network based embedded environment monitoring system is power consumption. When monitoring system is deployed in remote areas, recharging or replacing of batteries is not possible due to environmental constraints. It also affect the system lifetime. In the area of environment monitoring system low power consumption is desired because monitoring systems are powered by batteries. Power management can be done both at sensor node level and network level [4]. But in embedded based environment monitoring system, Power sources are located at sensor node level. Therefore, energy efficiency of environment monitoring system can be achieved by reducing the power consumption of sensor node that can be possible with the proper power management technique and using low power consumption hardware.
II. RELATEDWORK
There are numerous systems for monitoring outdoor and indoor environmental parameters with different power management techniques. Literature survey details of some monitoring systems with their energy management techniques are summarised below.
Octavian A. Postolache et.al [5], in 2009 developed a Wi-Fi based indoor-outdoor environment monitoring system which monitors the environmental parameter temperature, humidity, CO2, methane. A Wi-Fi card bus adapter DWL-G650 is used as a main control and processing unit and collected data is send to the TCP/IP communication unit through Ethernet. In outdoor monitoring, DWL-G810 wireless bridge is used for data transmission to communication unit. System power dissipation also evaluated which shows that wireless bridge sensor node consumes more power because of Wi-Fi modem.
R.V. Prasad et.al [6] in 2011 proposed a wireless pollution monitoring system for gases monitoring. In this Libelium WASP mote is used as basic wireless communication module which consists of processing unit and communication unit. Sensors are interface with the WASP mote on rotational basis which form a multihop mesh network and then collected samples are send to the base station. In this resistive heating based sensors are used that increases the power consumption of wireless sensor node and detrimental the network lifetime.
Pekoslawski et al. [7] in 2013 presented a greenhouse environment monitoring system which monitored temperature and soil moisture. In this system small size solar cells are used as power source for sensor node. In this Network coordinator is also powered by separate DC power supply. In this system solar cell energy is processed by especially designed DC/DC converter and stored and stored in super capacitor for peak power consumption. This increases hardware and cost.
Sherin Abraham et al. [8] in 2014 proposed indoor and outdoor air quality monitoring system. In this system two separate sensor shields are design to make sensor node compact, handy and to reduce power consumption. Power consumption is more because the trasreceiver and gases used consumes more power because it continuously monitors the environmental parameters.
transmission of communication module consumes more power that decreases the lifetime of sensor node. This system does not reduce the power consumption of transceiver used.
III.SYSTEMDEVELOPMENT
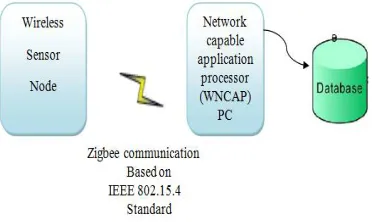
The system is design for measuring the environmental parameters. Environment monitoring system consists of sensor node and Network capable application processor (NCAP) with database as shown in figure.1.
Figure 1. Block diagram of environment monitoring
In figure.1 the wireless sensor node is linked to the wireless network capable application processor through zigbee communication. The wireless environmental monitoring system is used for monitoring environmental parameters. Sensor node performs sensing , processing and integration and then sensors result are send to the network capable application processor ( NCAP) PC through Zigbee module and display on the graphical user interface running on PC. Further data is save in the database server for future analysis.
Figure 2. Wireless sensor node
and display on the graphical user interface running on PC. Next sampling interval is depends on the previously collected samples result.
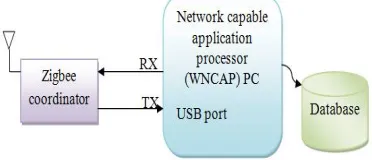
Figure 3. Network capable application processor (NCAP)
Network capable application processor as shown in figure.3 is the personal computer with graphical user interface (GUI) which displays the measured environmental parameters temperature, humidity and LPG gas sensor. Further the data is stored in the database server for future analysis. This unit performs the function of data reception from sensor node, visualization and data storage in database server. Basically it has two parts, Zigbee coordinator and Graphical user interface. The interface between zigbee coordinator and PC is through USB port.USB based interface provide various advantages such hot pluggable, low cost, low power consuming and reliable
IV.POWER MANAGEMENT TECHNIQUE
DUTY CYCLING
Duty cycling approach is used to reduce the average energy consumption of wireless sensor node. Figure 4. Shows the graphical representation of duty cycling principal. Its principal is that lower average power consumption can be achieved by keeping it inactive whenever possible.
Figure 4. Graphical representation of Duty cycling principal
Figure 4. Shows the Graphical representation of duty cycling principal. In this T is the total time, Tactive is the on time and Tinactive is the sleep or off time. Duty cycling can be applied to different modules of sensor node. Here the duty cycle approach is applied to sensor modules. Usually sensors do not have low power state or sleep state that means they have to be switch off.
Power consumption depends on the duty cycle
Power in inactive state (Psleep) is lower than the (Pactive) power in active state, so the average power consumption is,
As previously explain duty cycle approach wake up all the sensors at the predefined time for sampling. In this the sampling interval is not fixed but it changes according to the previous samples of monitoring parameters.
For implementing the concept of duty cycling switching circuit is designed by using transistor an NPN transistor. This circuit is also called as power management circuit as it turn off the all the sensors after sampling, this reduces the power consumption. The Emitter terminal of transistor is connected to the ground, base terminal is connected to the I/O pin of PIC microcontroller through resistor R of 1KΩ and output is tied to the collector terminal. LED is connected at the collector terminal to indicate on or off condition.
V. EXPERIMENTAL RESULTS
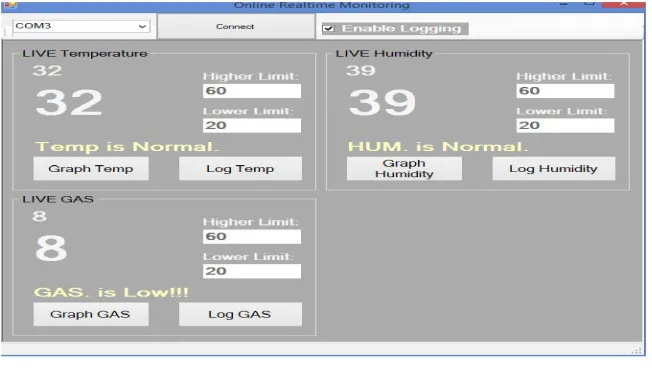
Environment monitoring system was implemented on real time basis. The figure 5 shows the main graphical user interface (GUI) window which shows live temperature, humidity and gas monitoring value. It shows the calibrated value of temperature, humidity and gas. Temperature is in degree centigrade, humidity and gas concentration is in percentage. The main GUI window which consists of communication port number, connect button, enable logging, log module, graph module and sensor monitoring window.
Figure 5 Main GUI window
TABLE I
Measured parameter range
Environment Temperature (°C)
Humidity (% RH)
LPG gas (%) Indoor 29 – 32 30 – 46
3 – 18
Table I shows the measured range of temperature and humidity in indoor and outdoor environment. It also shows the range of LPG gas. The temperature range is in degree centigrade, humidity is in percentage and LPG gas concentration is also calibrated in percentage because here measurement of gas concentration is in air.
TABLEII
Power consumption analysis
Devices Mode Current draw (mA) Duty cycle (%) Average Current (m A) Working Voltage (V)
Sensors Active Sleep
102 0
33.33 % 66.67 %
33.99 5
MCU Active 2.2 100% 2.2 5
Zigbee S2 module Active Ideal Tx=40 Rx=40 15 0.88 % 99.12 % 0.704 14.86 3.3
I/O peripherals Active 24 100% 24 5
Power management circuit Active Sleep 250 0 33.33 % 66.67 %
83.32 5
LM 1117 voltage regulator
Active 10 100% 10 5
Voltage regulator 7805
Active 5 100% 5 9
Total average power consumption ∑ ( I *V) = 832.911 mW
The above table II shows the power consumption analysis of sensor node. For measuring a current of sensors, controller and IO peripherals (LCD, buzzer) digital multimeter is used. In the current set up to calculate the duty cycle of sensors, we assume that the sensors get the data from the environment every 10 second and take 5 seconds for each time in a one hour considering the average equal interval but it changes according the temperature level. Zigbee series S2 transmits data every 15 seconds after sampling and takes transmits time of 1.08 milliseconds as calculated below, T transmits (n) = ×( ). The above table also shows the power consumption of voltage regulators, power management circuit and I/P peripherals LCD, buzzers.
VI. CONCLUSION
The prototype system consists of sensor node and NCAP module which is successfully developed along with the database server. The developed system is energy efficient as it uses the power saving technique of duty cycling with changing sampling interval that reduces the power consumption of all sensors and also reduces the number of data transmission that reduced the communication module power consumption which reduces the total power consumption of sensor node. From table II the total average power consumption of sensor node is 832.911 m W.
REFERENCES
[1] M. F.Othmana, K.Shazali, “Wireless Sensor Network Applications: A Study in Environment Monitoring System” International S symposiums on R robotics’ and Intelligent sensors 2012.
[2] Rasul G., Q. Z. Chaudhry, A. Mahmood, K. W. Hyder, “Effect of Temperature Rise on Crop Growth & Productivity, Pakistan Journal of Meteorology, Vol. 8, Issue 15.
[4] Sebastian Bader, “Enabling Autonomous Environmental Measurement Systems with Low-Power Wireless Sensor Networks” ISSN 1652-8948 mid Sweden University Licentiate Thesis 2011.
[5] O. A. Postolache, J. M. D. Pereira, and P. M. B. S. Girao, “Smart sensors network for air quality monitoring applications,” IEEE Trans. Instrum.Meas., vol. 58, no. 9, pp. 3253-3262, Sep. 2009.
[6] R.V. Prasad, M.S.Baig, R.K. Mishra, P. Rajalakshmi, U. B. Desai5 and S.N. Merchant “Real Time Air Pollution Monitoring System” ICTACT Journal on Communication Technology June 2011, Vol – 2.
[7] Bartosz Pkosawski, Piotr Krasiski, Micha Siedlecki, Andrzej Napieralski,“ Autonomous Wireless Sensor Network for Greenhouse Environmental Conditions Monitoring” 20th International Conference "Mixed Design of Integrated Circuits and Systems", June 20-22, 2013, Gdynia, Poland
[8] Sherin Abraham, Xinrong Li, “A Cost-Effective Wireless Sensor Network System for Indoor Air Quality Monitoring Applications’’ The 9th International Conference on Future Networks and Communications, 2014 Elsevier.
[9] A Kumar, GP Hancke, “Energy efficient environment monitoring system based on the IEEE 802.15. 4 Standard for low cost requirements” Sensors Journal, IEEE 2014.
[10] A. Kumar, H. Kim, and G. P. Hancke, “Environmental monitoring system: a review,” IEEE Sensors J., vol. 13, no. 4, pp. 1329–1339, April 2013.
[11] R. Yan, H. Sun, and Y. Qian, “Energy-aware sensor node design with its application in wireless sensor networks,” IEEE Trans. Instrum. Meas., vol. 62, no. 5, pp. 1183-1191, May 2013.
[12] Sandra Sendra, Jaime Lloret, Miguel Garcia and José F. Toledo, “Power saving and Energy optimization techniques for Wireless sensor network” Journal of communication, Vol. 6, No. 6, Sep 2011.
[13] Goran Horvat, Damir Šoštarić, Drago Žagar, “Power consumption and RF propagation analysis on Zigbee modules XBee ATPC’’ February 21, 2012, Ministry of Science, Education and Sports of the Republic of Croatia under project 165-0362027-1479.
[14] Cesare Alippi, Giuseppe Anastasi, Mario Di Francesco, Manuel Roveri, “ Energy management in wireless sensor networks with energy hungry sensors”, IEEE Instrumentation and Measurement Magazine Vol. 12, N. 2, April 2009, pp. 16-23.