VALIDATION OF REVERSE PHASE-HPLC METHOD
FOR THE QUANTITATIVE ESTIMATION OF
NORFLOXACIN IN PURE AND PHARMACEUTICAL
FORMULATION
Babu Giriya Gowda
1, Doddamani Hanumanthanaik
21
Department of Chemistry, Maharani’s Science College for Women, Bangalore, Karnataka (India)
2
Government First Grade College, Mangalore,Yelaburga Taluk, Koppala District, Karnataka (India)
ABSTRACT
An accurate, simple, reproducible HPLC method for the determination of Norfloxacin (NRF) has been
developed and validated. The separation of NRF was achieved on a reversed phase Syncronis C18 (10µm, 250 x 4.6 mm i.d) column using UV detection at 275 nm. The mobile phase was consisted of (850:150, v/v) of
buffer:acetonitrile (buffer 1 cm3 orthophosphoric acid to 1000 cm3 distilled water. The linear range of detection for NRF was found to be 0.43 % μg/ml (r2 = 0.9987). Intra and inter day assay relative standard deviations were less than 1 %. The method has been applied successfully to the determination of NRF in various
pharmaceutical preparations. There was no interference from drugs commonly administered with NRF. The
method has been shown to be linear, reproducible, specific and rugged.
Keywords
: Norfloxacin, RP-HPLC, Pharmaceutical Formulation
I. INTRODUCTION
Norfloxacin (NRF) is a first generation synthetic antibacterial agent used for the treatment of common
and complicated urinary tract infections [1, 2]. Other applications include prostatitis due to E.coli [3,
4] and in ophthalmic preparations for the treatment of conjunctival infections [5, 6]. It is also
administered along with a nitroimidazole for the treatment of amoebiasis associated with diarrhea
symptoms. It is a broad spectrum antibacterial agent and like other fluoroquinolones it inhibits
bacterial DNA gyrase and Topoisomerase II and IV [7, 8]. However, norfloxacin has got limited
applications due to resistance against several bacteria or its associated side effects. Chemically it is
Figure 1.
Chemical structure of norfloxacin
The commonly available marketed formulations of norfloxacin include tablets and ophthalmic preparations. An
extensive literature review presents a large number of analytical techniques for the estimation of norfloxacin, its
degradation products and its metabolites from solutions, from body fluids like blood and urine samples [9, 10],
ground water samples [11-13], sediments [14] and from poultry feeds and products [15-17]. These techniques
mainly involved spectrophotometric methods [18, 19], liquid-liquid micro extraction, liquid chromatography
coupled with - tandem mass spectrometry [11, 12,14, 20], fluorescence detection [16] and UV detection [15, 16,
20, 21]. Most of the reported chromatographic techniques mentioned the use of a C18 column and a phosphate
buffer in combination with an organic modifier like acetonitrile or methanol as mobile phase. However, very
few reported the estimation of NX from marketed formulations [22, 23]. Also these methods were less precise
and more time consuming. In this study we reported a simple, rapid and less time consuming technique for the
estimation of this drug from the marketed formulation. The simplicity of this method presents the importance of
this technique in regular analysis of this drug from marketed formulations including solid dosage forms and
ophthalmic preparations.
II EXPERIMENTAL
Materials and apparatus:
Pharmaceutical grade (> 99%) Norfloxacin was obtained from Global Calcium, Hosur, TN India. Acetonitrile
(s.d Fine-Chem, Ltd., India) and water (Rankem Ltd., India) used were of HPLC grade. All HPLC
measurements were made on a Shimadzu Corporation system (Analytical Instruments division, Kyoto, Japan)
consisting of a LC-2010 CHC binary gradient solvent pump, SPD-10A detector and a data station with win
chrome software version 3.1. The elusion was performed on reversed phase Syncronis C18 (10µm, 250 x 4.6
mm i.d) column. A 850:150 v/v mixture of buffer: acetonitrile was used as a mobile phase at a rate of 1.5
ml/min. Hamilton 702 μR injector with a 25 μl loop was used for the injection of the samples. Detection was
done at 254 nm. The mobile phase was filtered through 0.45μ Millipore membrane filter and degassed. The
separation was carried out at room temperature.
Stock solutions
NRF (12.49 mg) was accurately weighed into 50 ml calibrated flask and dissolved in the mobile phase by
sonicating for 5 minutes and filled up to volume with the mobile phase. The solutions were diluted as and when
Standard working solutions
Standard working solutions were prepared in mobile phase. A suitable aliquot from working solution was
diluted with mobile phase to yield a solution with final concentration of 200 μg/ml of NRF. Studies on the
stability of analytes in standard working solution showed that there was no decomposition product in the
chromatogram and difference in area-ratios during the analytical procedure and even after storing for 2 days at
+4ºC.
Pharmaceutical preparation
Twenty tablets of the selected drug were finely powdered. An amount equivalent to 20 mg of the drug was
weighed accurately and transferred into a 50 ml volumetric flask. 25 ml of mobile phase was added and the
powder was completely disintegrated. The solution was filtered and the filtrate was made up to 50 ml with the
mobile phase. Further transferred 3.0 ml of the solution into 25.0 ml volumetric flask, diluted up to the mark
with diluents and mixed well.
III. PROCEDURE
Chromatographic conditions
LC analysis was performed by isocratic elution with flow rate of 1.5 ml/min. The mobile phase of 850:150 v/v
mixture of buffer : acetonitrile acetonitrile was used throughout. Buffer solution was prepared by dissolving
1cm3 of orthophosphoric acid into 1000 cm3 of distilled water. After addition of buffer, the pH of mobile phase
was 3.0 ± 0.05. All solvents were filtered through a 0.45μ Millipore membranes filter before use and degassed
in an ultrasonic bath. The flow rate was maintained at 0.8 mL/min. Quantification was effected by measuring
at 275 nm and the chromatographic run time was 5 min.
Throughout the study, the solubility of the chromatographic system was monitored by calculating the capacity
factor (k), the resolution (R), the selectivity (σ) and the peak asymmetry (T).
Establishment of calibration
Working standard solutions of NRF (1.5-55 μg/ml) was prepared in mobile phase. Triplicate 20 μl injections
were made for each standard solution to see the reproducibility of the detector response at each concentration
level. The peak area of standard was plotted against the concentration of the drug to obtain the calibration
graph. The results were subjected to regression analysis to calculate calibration equation and correlation
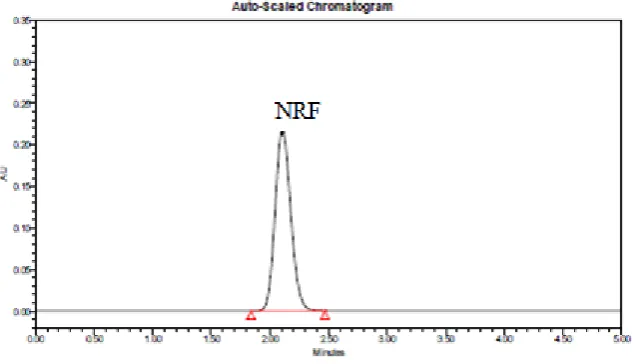
Figure 2. Chromatogram for NRF (retention time = 2.2 min)
Analysis of tablet
An aliquot of the drug obtained by following the procedure described for analysis of pharmaceutical
preparations was taken and analysed. The chromatogram at 275 nm showed a complete resolution of the peak.
IV RESULTS AND DISCUSSION
Method development
The mobile phase was chosen after several trials with methanol, acetonitrile, isopropyl alcohol, triethylamine,
water and buffer solutions in various proportions and at different pH values. A mobile phase consisting of
buffer: acetonitrile (850:150 v/v) was selected to achieve the maximum separation and sensitivity. The effects
of flow rates in the range of 0.5 and 2.0 ml/min were examined. A flow rate of 1.5 ml/min gave an optimal
signal-to-noise ratio with a reasonable separation time. Using reverse phase C18 column, the retention time
was observed to be of 2.2 min. The total time of analysis was less than 10 min.
The solution containing NRF exhibited maximum absorption at 275 nm and hence, this wavelength was chosen
for the analysis.
Linearity
The calibration curves were linear in the studied range of 0.02-0.8 µg/ml. The calibration curve equation is x =
bx + c and the response was measured as peak area. The mean equation of the calibration curve (n = 9)
obtained was y = 33115x + 62494. Excellent linearity was obtained for NRF between peak area and
concentrations of 0.02-0.8 µg/ml with r2 = 0.9985.
Limit of detection and limit of quantification
Limits of detection (LOD) were established at a signal-to-noise ratio (S/N) of 3 while limits of quantification
(LOQ) were established at a signal-to-noise ratio (S/N) of 9. The LOD and LOQ were experimentally verified
by nine injections of NRF at the LOD and LOQ concentrations. The limit of detection was calculated to be 0.43
µg/ml and the limit of quantification was calculated to be 0.550µg/ml.
The chromatographic parameters such as tailing factor, selectivity and peak symmetry were evaluated for the
selected drug. The tailing factor for NRF in standard solution was found to be 1.50 while the theoretical plate
was observed to be 1000. The capacity factor (k1) was found to be 1.0 while the peak asymmetry (T) value was
observed to be 1.10.
Precision
The precision (Table 1) of the method (within-day variations of replicate determinations) was checked by
injecting nine times of NRF at the LOQ level. The precision of the method expressed as the relative standard
deviations (R. S. D., %) at the LOQ level, were 2.41.
Table 1. Precision parameters
Parameters
Intra-day
% RSD
Inter-day
Day1
Day2
Day3
% RSD
Peak Area
9517899
0.21
9516889
9518898
9516897
0.03
Peak RT
2.20
0.10
2.12
2.11
2.11
0.47
Amount
(mg/Tab)
399.82
0.21
397.45
397.28
397.58
0.05
Accuracy
A standard working solution containing NRF to give final concentration 20µg/ml was prepared. The prepared
solution of standard was injected nine times as a test sample. From the area counts, the concentration of the
NRF was calculated using the detector responses. The accuracy, defined in terms of % deviation of the
calculated concentrations from the actual concentrations is listed in Table 2.
Table 2. Accuracy parameters (recovery)
Tablet
Formulation
Drug Labelled
Amount of Drug (mg/tab) Amount mg/tab found % label claim (n=6)
Recovery Tablet Studies (n = 9)
Total Amt. after spiking(mg) Amt recovered (mg) Mean ±SD % Recovery % Mean Recover % RSD Normax Tab (Ipca)
NRF 400 399.97 99.99 360 359.53±3.97 99.77 99.99 0.254
440 440.79±1.78 100.22
480 479.79±4.09 99.99
Ruggedness
The ruggedness of the HPLC method was evaluated by carrying out the analysis of the standard working
solution, the same chromatographic system and the same column on different days. Small differences in area
ratios and good constancy in retention times were observed after 48 h time period. The R.S.D. value of less than
intra-day analysis), and 0.47 % (for inter-intra-day analysis). The low R.S.D. values indicated the ruggedness of the
method. The comparable detector responses obtained on different days indicated that the method is capable of
producing results with high precision on different days.
Similarly, injecting the standard working solution into a different HPLC unit tested the ruggedness of the
method. The high degree of reproducibility of the detector response and the retention times indicate that the
method is fairly rugged.
Specificity of the method
Specificity of the chromatographic analysis was confirmed by the fact that the drugs such as ibuprofen,
chlorpheniramine maleate, amoxicillin, cloxacillin, pseudoephedrin hydrochloride, cefadroxil, methdilazine
hydrochloride dichlofenac sodium, and ciprofloxacin did not interfere in the determination, as evident from their
retention times which are different from those of NRF.
Analysis of pharmaceutical preparation
The proposed method was successfully applied to the analysis of NRF in tablet (labelled to contain NRF 400 mg
as active substances) and the results were shown in Table 2. The low values of relative standard deviation
indicated high precision of the method.
V CONCLUSIONS
The data obtained in the proposed method demonstrated that the method has acceptable linearity, precision and
accuracy over the concentration range. The method described is rapid since the developed method is relatively
simple and the total chromatographic run time is about 10 min. The limit of quantification values for NRF was
observed to be 0.43 µg/ml. High percent recovery values show that the method was free from interference by
the excipients used in the preparations. The proposed chromatographic method can be used to analyse a large
number of samples each day in analytical laboratories, since they need same reversed-phase column, mobile
phase, detection system and sample preparation. Hence, the present method could be used for routine quality
control as well as to analyse biological fluids.
VI ACKNOWLEDGEMENTS
We gratefully acknowledge the financial support of University Grants Commission, New Delhi, India (F. No.
42-308/2013 (SR) Dated, 28/03/2013). We thank Global Calcium Ltd., Hosur, India for supplying gift samples
of Norfloxacin. Thanks are also due to the Principal, Maharani’s Science College for Women, Bangalore for
providing necessary infrastructural facility.
REFERENCES
[1] Oliphant C.M., Green G.M., Quinolones: A comprehensive review, Clin. Pharmacol. 2002, 65, 455- 464. 2.
[2] Tadesse E., Teshome M., Merid Y., Kibret B., Shimelis T., Asymptomatic urinary tract infection among
pregnant women attending the antenatal clinic of Hawassa Referral Hospital, Southern Ethiopia, BMC Res.
[3] Seo Y., Lee G., Antimicrobial resistance pattern in Enterococcus faecalis strains isolated from expressed
prostatic secretions of patients with chronic bacterial prostatitis. Korean J. Urol. 2013, 54, 477-481.
[4] Andriole V.T., Use of quinolones in treatment of prostatitis and lower urinary tract infections, Eur. J. Clin.
Microbiol. Infect. Dis. 1991, 10, 342-350.
[5] Chisari G., Sanfilippo M., Reibaldi M., Treatment of bacterial conjuntivitis with topical ciprofloxacin and
norfloxacin: a comparative study, Infez. Med. 2003, 11, 25-30.
[6] Miller I.M., Vogel R., Cook T.J., Wittreich J., Topically administered norfloxacin compared with topically
administered gentamicin for the treatment of external ocular bacterial infections. The World wide
Norfloxacin Ophthalmic Study Group, Am. J. Ophthalmol. 1992, 113, 638-644.
[7] Abraham D.J., Burger’s medicinal chemistry and drug discovery, 6th ed. John Wiley and Sons. 2003, 5,
583-587.
[8] Williams D.A., Lamke T.L., Foye’s principles of medicinal chemistry. Lippincott Williams and Wilkins.
USA. 5th ed., pp.829-830.
[9] Nada A.H., Sharaf M.A., El Gholmy Z.A., Khalafallah N.M., Comparative bioavailability of norfloxacin
tablets based on blood and urine data, Med. Princ. Pract. 2007, 16, 426-431.
[10] Mascher H.J., Kikuta C., Determination of norfloxacin in human plasma and urine by highperformance
liquid chromatography and fluorescence detection, J. Chromatogr. A. 1998, 812, 381-385.
[11] Zhou J.L., Kang Y., Matrix effect in high-performance liquid chromatography-tandem mass spectrometry
analysis of antibiotics in environmental water samples, J. Sep. Sci. 2013, 36, 564-571.
[12] Vázquez M.M., Vázquez P.P., Galera M.M., García M.D., Determination of eight fluoroquinolones in
groundwater samples with ultrasound-assisted ionic liquid dispersive liquid-liquid microextraction prior to
high-performance liquid chromatography and fluorescence detection, Anal. Chim. Acta. 2012, 748, 20-27.
[13] Ramos-Payán M., Villar-Navarro M., Fernández-Torres R., Callejón-Mochón M., Bello-López M.A.,
Electromembrane extraction (EME)—an easy, novel and rapid extraction procedure for the HPLC
determination of fluoroquinolones in waste water samples, Anal. Bioanal. Chem. 2013, 405, 2575- 2584.
[14] Mutavdžić Pavlović D., Pinušić T., Periša M., Babić S., Optimization of matrix solid-phase dispersion for
liquid chromatography tandem mass spectrometry analysis of 12 pharmaceuticals in sediments, J.
Chromatogr. A. 2012, 1258, 1-15.
[15] Moema D., Nindi M.M., Dube S., Development of a dispersive liquid-liquid microextraction method for
the determination of fluoroquinolones in chicken liver by high performance liquid chromatography, Anal.
Chim. Acta. 2012, 730, 80-86.
[16] Galarini R., Fioroni L., Angelucci F., Tovo G.R., Cristofani E., Simultaneous determination of eleven
quinolones in animal feed by liquid chromatography with fluorescence and ultraviolet absorbance
detection, J. Chromatogr. A. 2009, 1216, 8158-8164.
[17] Yi Y.N., Li G.R., Wang Y.S., Zhou Y.Z., Zhu H.M., Simultaneous determination of norfloxacin and
lomefloxacin in milk by first derivative synchronous fluorescence spectrometry using Al (III) as an
[18] Liu C., Nanaboina V., Korshin G.V., Jiang W., Spectroscopic study of degradation products of
ciprofloxacin, norfloxacin and lomefloxacin formed in ozonated wastewater, Water Res. 2012, 46,
5235-5246.
[19] Maia A.S., Ribeiro A.R., Amorim C.L., Barreiro J.C., Cass Q.B., Castro P.M., Tiritan M.E., Degradation of
fluoroquinolone antibiotics and identification of metabolites/transformation products by liquid
chromatography-tandem mass spectrometry, J. Chromatogr. A. 2014, 1333, 87-98.
[20] Córdoba-Borrego M ., Córdoba-Dıaz M ., Córdoba-D ́ ı́az D ., Validation of a high-performance liquid
chromatographic method for the determination of norfloxacin and its application to stability studies
(photo-stability study of norfloxacin), J. Pharm. Bio. Anal. 1999, 18, 919-926.
[21] Nageswara Rao R., Nagaraju V., Separation and determination of synthetic impurities of norfloxacin by
reversed-phase high performance liquid chromatography, J. Pharm. Biomed. Anal. 2004, 34, 1049- 1056.
[22] Oliveira P.R., Bernardi L.S., Mendes C., Cardoso S.G., Sangoi M.A., Silva M.R., Liquid chromato graphic
determination of norfloxacin in extended-release tablets, J. Chromatogr. Sci. 2009, 47, 739- 744.
[23] Oliveira P.R., Mendes C., Klein L., Sangoi Mda S., Bernardi L.S., Silva M.A., Formulation development