UC Santa Barbara Electronic Theses and Dissertations
Title
Geographic Knowledge Graph Summarization Permalink https://escholarship.org/uc/item/04h696z4 Author Yan, Bo Publication Date 2019 Peer reviewed|Thesis/dissertation
University of California Santa Barbara
Geographic Knowledge Graph Summarization
A dissertation submitted in partial satisfaction of the requirements for the degree
Doctor of Philosophy in Geography by Bo Yan Committee in charge:
Professor Krzysztof Janowicz, Chair Professor Werner Kuhn
Professor Konstadinos Goulias
Professor Werner Kuhn
Professor Konstadinos Goulias
Professor Krzysztof Janowicz, Committee Chair
Geographic Knowledge Graph Summarization
Copyright c 2019 by
Acknowledgements
There are many people I am grateful for during the course of my life as a Ph.D. student at UC Santa Barbara. This incredible journey would not have been possible without them. To be honest, I am a bit emotional while writing this acknowledgement.
First and foremost, I would like to thank my advisor, Krzysztof Janowicz, who for the past six years has spent a great amount of time and effort chiseling me to who I am today as a competent researcher. This dissertation is the result of a close collaboration with him, who has given me invaluable feedback, has been constantly inspiring me to pursue new ideas, and has gone through each and every paper I wrote word by word to make sure I am able to convey the research clearly. There are a lot I learned from Jano. His meticulousness towards details has inspired me to dive deep into research questions and ideas. Working with him has made me realize the importance of communication and thinking outside the box. His Java class is one of the best I have taken. I still remember the first time I met him on Skype. I could feel his passion for research and I greatly appreciated his interest and patience when I talked about my immature research study through Skype at that time. Not knowing what life had in store for me, I took a leap of faith, came to this country that I barely knew, and joined his STKO lab. As I reminisce on the ups and downs over my past few years, I realize it was one of the best decisions I have made and I am very grateful for him for offering me this opportunity. For the past six years, I have witnessed the rapid growth of our lab and the amazing achievements of our lab members under his leadership.
Jano is not only a great mentor academically, but also a role model and a life coach. He has always told me that I should be a good human being first and a good researcher second. He is kind, caring, and supportive of every decision I made. He always has a positive outlook and believes that every cloud has a silver lining. During the dark times
mind has inspired me to learn to see the world in a grain of sand. Although twenty-two years of my school life have officially come to an end, the school of life continues. As I open my new chapter and commence an unknown journey, I will always remember what I learned from him and remain a scholar and a researcher at heart.
I have been very fortunate to have Werner Kuhn and Konstadinos Goulias in my committee. They have been giving me a lot of useful advice for my Ph.D. exams and this dissertation. Discussing with them helps me understand my research ideas and methods from different perspectives. They challenged my proposals and helped me distill the essence of my research. I really appreciate their comments and advice.
I would like to thank Gengchen Mai. We have been working together very closely since he joined the lab. I really enjoyed all the thought-provoking discussions and the binge-writing sessions before deadlines with him. His relentless effort in figuring out every detail in a paper, unbelievable productivity in research, and amazing ability to maintain a balanced life are beyond me. He is smart but humble. I am very fortunate to have the opportunity to work with him. Rui Zhu’s passion for research and pursuit for raising the awareness of the fundamental research questions are impressive. I am glad that I can learn from his perseverance about his research topic and I am confident that he will see the light at the end of the tunnel soon. Thank you, Blake Regalia, for being my lunch buddy on campus although we have quite different tastes in food. I would like to thank Yingjie Hu who gave me a lot of comments and suggestions on my master’s thesis and helped me on a number of research papers. I submitted my first paper with Yingjie’s help. Song Gao (Super Song) was an energy source in our lab. He is always very active and energetic. Song helped me with my first co-authored paper. While my trip to Europe was a disaster during my first summer at UC Santa Barbara, I had a lot of fun with him and Tiange in Greece. Thank you, Song. In addition, I would like to
thank other past and present STKO members who made my graduate school life more colorful: Yiting Ju, Grant McKenzie, Jiue-An (Jay) Yang, Ling Cai, Meilin Shi, Anagha Uppal, Zachary Canter, Kang Liu, Li Gong, Dara Seidl, Dingwen Zhang, Su Yeon Han, Amin Abdalla, and Marcela Suarez.
During my Ph.D. study, I squeezed some time for three summer internships at LinkedIn, HERE technologies, and ESRI. These internships are a great learning experi-ence and had a lot of impact on my research trajectory. I would like to thank Matthew Walker, Shipeng Yu, Antonio Haro, Craig Barnes, and Sathya Prasad for their support and mentorship during my internships.
Finally and most importantly, I am grateful for my parents for their unconditional love and support. They have supported me through many challenges and genuinely cared for me. I feel forever in debt to them. I hope I can at least make them proud of what I have accomplished so far. Thank you, Mom and Dad.
Education
2019 Ph.D. in Geography, University of California, Santa Barbara.
2016 M.A. in Geography, University of California, Santa Barbara.
2013 B.S. in Geographic Information Science, Wuhan University.
Professional Experience
09/2013 – 06/2019 Research Assistant, University of California, Santa Barbara. 06/2018 – 09/2018 Machine Learning Research Intern, LinkedIn.
07/2017 – 09/2017 Research Engineer Intern, HERE Technologies. 06/2016 – 09/2016 Research Intern, ESRI.
Publications
Refereed Journal Articles, Conference Proceedings & Book Chapters
Yan, B., Janowicz, K., Mai, G., and Zhu, R. (2019): A Spatially-Explicit Reinforcement Learning Model for Geographic Knowledge Graph Summarization. Transactions in GIS. Mai, G., Janowicz, K., and Yan, B. (2019): Deeply Integrating Linked Data with Geo-graphic Information Systems. Transactions in GIS.
Mai, G., Yan, B., Janowicz, K., and Zhu, R. (2019): Relaxing Unanswerable Geo-graphic Questions Using A Spatially Explicit Knowledge Graph Embedding Model. The
22nd AGILE International Conference on Geographic Information Science. Jun. 17-10,
Limassol, Cyprus.
Yan, B., Mai, G., Hu, Y., and Janowicz, K. (2018): Harnessing Heterogeneous Big Geospatial Data. In: M. Werner and Y. Chiang (Eds). Big Geospatial Data (Under
review).
Mai, G., Janowicz, K., andYan, B. (2018): Support and Centrality: Learning Weights for Knowledge Graph Embedding Models. The 21st International Conference on
Knowl-edge Engineering and KnowlKnowl-edge Management. Nov. 12-16, Nancy, France.
Yan, B., Janowicz, K., Mai, G., and Zhu, R. (2018): xNet+SC: Classifying Places Based on Images by Incorporating Spatial Contexts. The 10th International Conference
on Geographic Information Science. Aug. 28-31, Melbourne, Australia.
Liu, K., Gao, S., Qiu, P., Liu, X., Yan, B., and Lu, F. (2017): Road2vec: Measuring traffic interactions in urban road system from massive travel routes. ISPRS International
Yan, B., Janowicz, K., Mai, G., and Gao, S. (2017): From ITDL to Place2Vec – Rea-soning About Place Type Similarity and Relatedness by Learning Embeddings From Augmented Spatial Contexts. ACM SIGSPATIAL 2017.
Gao, S., Janowicz, K., Montello, D., Hu, Y., Yang, J., McKenzie, G., Ju, Y., Gong, L., Adams, B., and Yan, B. (2017): A data-synthesis-driven method for detecting and extracting vague cognitive regions. International Journal of Geographical Information
Science. 31 (6), 1245-1271, Taylor & Francis.
Gao, S., Yan, B., Gong, L., Regalia, B., Ju, Y., and Hu. Y (2017): Uncovering the digital divide and the physical divide in Senegal using mobile phone data. Advances in
geocomputation. 143-151.
Ju, Y., Adams, B., Janowicz, K., Hu, Y., Yan, B., and McKenzie, G. (2016): Things and strings: improving place name disambiguation from short texts by combining entity co-occurrence with topic modeling. International Conference on Knowledge Engineering
and Knowledge Management. Nov. 19-23, Bologna, Italy.
Refereed Short Papers & Workshop Proceedings
Janowicz, K., Yan, B., Regalia, B., Zhu, R., and Mai, G. (2018): Debiasing Knowledge Graphs: Why Female Presidents are not like Female Popes. International Semantic Web
Conference (Posters & Demonstrations, Industry and Blue Sky Ideas Tracks). Oct. 8-12,
Asilomar conference grounds, monterey, California, USA.
Mai, G., Janowicz, K., and Yan, B. (2018): Combining text embedding and knowledge graph embedding techniques for academic search engines. The 4th Workshop on Semantic
Deep Learning (SemDeep-4) at the International Semantic Web Conference. Oct. 8-12,
Asilomar conference grounds, monterey, California, USA.
Mai, G., Janowicz, K., Hu, Y., Gao, S., Zhu, R., Yan, B., McKenzie, G., Uppal, A., and Regalia, B. (2018): Collections of Points of Interest: How to Name Them and Why it Matters. Spatial big data and machine learning Workshop at GIScience 2018. Aug. 28-31, Melbourne, Australia.
Mai, G., Janowicz, K., Prasad, S., andYan, B. (2018): Visualizing The Semantic Simi-larity of Geographic Features. The 21th AGILE International Conference on Geographic
Information Science (short papers, posters and poster abstracts). Jun. 17-10, Limassol,
Cyprus.
Gao, S., andYan, B. (2018): Place2Vec: Visualizing and Reasoning About Place Type Similarity and Relatedness by Learning Context Embeddings. The 14th International
Conference on Location Based Services (Short Paper).
Zhu, R., Janowicz, K., Yan, B., and Hu, Y. (2016): Which kobani? a case study on the role of spatial statistics and semantics for coreference resolution across gazetteers.
tional Conference on GIScience (Short Paper). Sept. 2016, Montreal, Canada.
Yan, B., Hu, Y., Kuczenski, B., Janowicz, K., Ballatore, A., Krisnadhi, A., Ju, Y., Hit-zler, P., Suh, S., and Ingwersen, W. (2015): An Ontology For Specifying Spatiotemporal Scopes in Life Cycle Assessment. Diversity++ Workship at the International Semantic
Web Conference. Oct. 11-15, Bethlehem, Pennsylvania, USA.
Gao, S., Yang, J., Yan, B., Hu, Y., Janowicz, K., and McKenzie, G. (2014): Detecting Origin-Destination Mobility Flows From Geotagged Tweets in Greater Los Angeles Area.
The 8th International Conference on Geographic Information Science (GIScience ’14)
Short Paper. Vienna, Austria.
Gao, S., Yang, J., Janowicz, K., Hu, Y., and Yan, B. (2014): TrajAnalyst: Matching Data to Trajectory Analysis Modules via a Conceptual Framework. The 8th International
Conference on Geographic Information Science (GIScience ’14) Short Paper. Vienna,
Austria.
Awards
2018 Jack & Laura Dangermond Graduate Research Fellowship.
2017 First Place in AAG GI Science and Systems Specialty Group
Stu-dent Paper Competition.
Abstract
Geographic Knowledge Graph Summarization
by
Bo Yan
Geographic knowledge graphs play a significant role in the geospatial semantics paradigm for fulfilling the interoperability, the accessibility, and the conceptualization demands in geographic information science. However, due to the immense quantity of information accompanying and the enormous diversity of geographic knowledge graphs, there are many challenges that hinder the applicability and mass adoption of such useful structured knowledge. In order to tackle these challenges, this dissertation focuses on devising ways in which geographic knowledge graphs can be digested and summarized. Such a summarization task, on the one hand lifts the burden of information overload for end users, on the other hand facilitates the reduction of data storage, speeds up queries, and helps eliminate noise. The main contribution of this dissertation is that it introduces the general concept of geospatial inductive bias and explains different ways this idea can be used in the geographic knowledge graph summarization task. By decomposing the task into separate but related components, this dissertation is based upon three peer-reviewed articles (Chapter 3, Chapter 4, and Chapter 5) which focus on the hierarchical place type structure, multimedia leaf nodes, and general relation and entity components respectively. Chapter 6 presents a spatial knowledge map interface to illustrate the ef-fectiveness of summarizing geographic knowledge graphs. Throughout the dissertation, top-down knowledge engineering and bottom-up knowledge learning methods are inte-grated. We hope this dissertation would promote the awareness of this fascinating area and motivate researchers to investigate related questions.
Curriculum Vitae viii Abstract xi 1 Introduction 1 1.1 Background . . . 2 1.2 Motivation . . . 6 1.3 Research Questions . . . 9 1.4 Dissertation Synopsis . . . 16
2 Foundational Concepts and Theories 19 2.1 Geospatial Context and Geospatial Inductive Bias . . . 20
2.2 Geographic Knowledge Graphs . . . 24
2.3 Graph Summarization . . . 27
2.4 Summary . . . 30
3 Reasoning About Place Type Similarity and Relatedness 32 3.1 Introduction and Motivation . . . 34
3.2 Related Work . . . 37
3.3 Preliminaries . . . 39
3.4 Methods . . . 40
3.5 Evaluation Schemes . . . 48
3.6 Experiment and Result . . . 56
3.7 Conclusion and Future Work . . . 62
4 xNet+SC: Classifying Places Based on Images by Incorporating Spatial Contexts 64 4.1 Introduction . . . 66
4.2 Related Work . . . 69
4.3 Image Classification . . . 70
4.4 Spatial Contextual Information . . . 73
4.6 Conclusion and Future Work . . . 87
5 A Spatially-Explicit Reinforcement Learning Model for Geographic Knowl-edge Graph Summarization 88 5.1 Introduction . . . 90
5.2 Related Work . . . 95
5.3 Dataset . . . 97
5.4 Methods . . . 100
5.5 Experiment and Results . . . 112
5.6 Conclusions and Future Work . . . 116
6 Summarizing Geographic Knowledge: A Case Study of Enriching Geocod-ing Services 120 6.1 Introduction . . . 121
6.2 Related Work . . . 123
6.3 Framework & Implementation . . . 126
6.4 Spatial Knowledge Discovery . . . 139
6.5 Conclusions . . . 144
7 Conclusions 146 7.1 Summary and Discussions . . . 147
7.2 Research Contributions . . . 149
7.3 Limitations and Future Work . . . 153
Introduction
This chapter provides a general introduction to the dissertation. It starts with the back-ground and motivation for research in summarizing geographic knowledge graphs. It first introduces the interoperability demand, the accessibility demand, and the conceptu-alization demand that have given rise to the geospatial semantics paradigm in GIScience research. Then it explains the practical need for summarizing geographic knowledge graphs in this paradigm. Three concrete research questions are raised accordingly to constructively tackle the big question step by step. A dissertation synopsis is provided in the end to briefly outline the structure of this dissertation.
Introduction Chapter 1
1.1
Background
Recent years have witnessed an increasing number of research endeavors in geospa-tial semantics [1, 2] as Geographic Information Science (GIScience) has entered the new paradigm that demands efficient processing of a large amount of heterogeneous geographic data, more accessible interfaces for the general audience, and a better conceptualization model to mitigate the inherent vagueness in geographic phenomenon. Such demands give rise to research studies that focus on geospatial ontologies and geographic knowl-edge graphs as they are the embodiment of the broader idea of geospatial semantics and semantic interoperability. In order to understand their relationship and provide a background of this research study, let us analyze these three major demands.
Interoperability Demand As a scientific discipline to develop and utilize theories, methods, technology, and data for understanding geographic processes, relationships, and patterns [3], GIScience has always been at the forefront of adopting and studying different kinds of data structures and data models. Traditionally, well-structured relational data models are the first choice for research as well as applications in the field because such data structures and models are well-studied and support efficient geospatial operations (such as spatial range queries or topological queries). As thescience of where permeates almost every aspect of our daily life — from getting around the neighborhood to traveling in distant destinations, challenges arise because the ubiquity of geographic information demands a more flexible way of handling geographic data and the restriction of relational data models sets up a barrier to better solve real-world geographic problems. In addition to the well-structured data formats that researchers and practitioners alike have been favoring for a long time, geographic data comes in a variety of flavors as different data sources follow different protocols for capturing, storing, and transmitting data. For
example, satellite imageries contain a lot of information about land use and land cover. However, different remote sensing platforms (such as the Landsat series, ASTER, and SPOT) have different spatial/temporal resolution and bands. In order to properly use satellite imageries, preprocessing steps are essential. Another example would be the large number of online documents that contain geographic locations, such as events in news articles. These geographic locations may appear in these documents in different surface forms (such as LA vs Los Angeles) and may need disambiguation steps [4] (the same surface form may refer to different geographic entities in different contexts) in order to find the correct association between the unstructured texts and geographic entities. In order to analyze these live events and discover the hidden geospatial patterns as a means to gain insights about the socioeconomic trend in our society, new methods are needed to close the gap between the demand of efficiently consuming the unstructured noisy geographic data and the supply of the lagging data handling ability of current Geographic Information System (GIS) tools and infrastructures. A good candidate is geospatial semantics because it can improve the interoperability of different geospatial data sources and operations [1]. For instance, Kemp et al. [5] used knowledge bases (a.k.a. knowledge graphs) as the middleware framework to accommodate semantic heterogeneity and provide analysis services for environmental information systems.
Accessibility Demand Moreover, the general trend in research and technology is that innovations and ideas are constantly being ported to a larger audience that are not nec-essarily experts in the field. This trend benefits both the research community and the general society in that it opens the dialog that facilitates the communication between them to share research progress as well as societal needs. By making research innova-tions more accessible, the general audience are able to appreciate the endeavors that have been made by numerous scholars and the research society in turn is able to collect
Introduction Chapter 1
feedback from the general audience about potential improvements. The recent effort in democratizing Artificial Intelligence (AI) research is a good example of this trend. By democratizing AI research, millions of people are able to be more efficient with everyday tasks. Realizing the potential of AI in our society, researchers have been extending the technology in various industries, including the financial sector and the health industry. Furthermore, new issues and challenges emerge as people start to deploy such technolo-gies in a large scale, such as the ethical issues and the challenge of interpretability in AI. As an interdisciplinary field, GIScience has always been on the train towards a more democratized research agenda, i.e. a research practice that makes it more accessible to a wider audience. While traditional GIS tools such as ArcGIS1 and Quantum GIS2
re-quire advanced knowledge in geoprocessing, more accessible tools such as Google Earth3,
CARTO4, and Mapbox5 have facilitated common users to create web maps and conduct
basic geospatial analysis by importing data from spreadsheets. After realizing the power of GIS tools, people have started to embrace a variety of geospatial technologies, such as using Google Maps to find the shortest route, using Yelp to locate new restaurants, and geotagging photos on social media. People now have even higher expectations when they interact with geospatial tools. For example, they want the navigation systems to under-stand natural language commands and they want location search to be more intelligent in order to handle complex queries in addition to the address search or Points-Of-Interest (POI) search. In order to bridge the gap and make the interaction smoother, geospatial semantics comes into play as a means to tackle this challenge. Studies have known that semantics organized in (geographic) knowledge graphs can act as nexus between natural language and GIS systems in order to facilitate the question answering process in the
1 https://www.arcgis.com/ 2 https://www.qgis.org 3 https://www.google.com/earth/ 4 https://carto.com/ 5 https://www.mapbox.com/
geospatial domain [6, 7, 8].
Conceptualization Demand The inherent vagueness in geographic concepts has im-posed a lot of challenges in processing, analyzing and understanding geographic phe-nomenon. In addition to mathematical and computational challenges, Montello et al. [9] discussed behavioral-science methods for determining the referents of vague geographic regions. Gao et al. [10] used a data-synthesis-driven approach to detect and extract vague cognitive regions. These attempts, though successful, only provide a temporary solution to the challenge. The root cause lies in the fundamental conceptualization of different geographic features or entities. Geo-ontology, as a sub-field of ontology which is a branch of philosophy, studies the constituents of reality and their relations within the geography domain in a systematic way [11]. In this sense, designing the ontology for various geo-graphic features is an ideal approach to solving the conceptualization issue in GIScience. As a matter of fact, researchers have been working in this area from a theoretical as well as a pragmatical perspective. By examining the bona fide (i.e. natural) and fiat (i.e. ar-tificial) characteristics of mountains, Smith and Mark [11] explained the implications for modeling landforms in geographic ontology to support environmental modeling and other GIS applications. In order to define vague geographic features, Bennett et al. [12] utilized standpoint semantics (a refinement of supervaluation semantics) that can be grounded in actual data by geometric analysis and segmentation of the data set. In a more applied manner, Hu et al. [13] designed an ontology for trajectory data. Grenon and Smith [14] proposed a modular ontology of the dynamic features of reality.
These three demands have given rise to the study of geo-ontologies and geographic knowledge graphs in GIScience. While they continue to help mitigate the demands, these areas are not without their own challenges. This dissertation is dedicated to addressing one of these challenges, namely geographic knowledge graph summarization, amid the big
Introduction Chapter 1
data era and the paradigm shift brought by geospatial semantics in GIScience. By first pointing out and clarifying the three demands, we hope to establish the background as well as our philosophy in dealing with the challenge of summarizing geographic knowledge graphs.
1.2
Motivation
While geospatial semantics and the semantic technology in general have been widely adopted in GIScience [15, 16, 13, 17], the amount of information accompanying this se-mantic lift is immense in terms of diversity as well as quantity. As a nexus component in geospatial semantics, geographic knowledge graph plays an important role in improving the interoperability, accessibility, and conceptualization in geographic data. However, the diversity of geographic knowledge graph has imposed a lot of challenges for researchers and general users. This diversity can be analyzed from two perspectives. Geographic knowledge graphs are linked with a diverse set of cross-domain knowledge graphs. Be-cause of the interconnected nature of knowledge graphs, geographic knowledge graphs usually appear as subgraphs of cross-domain knowledge graphs, such as DBpedia6,
Wiki-data7, and Freebase8. These knowledge graphs interlink geographic entities with entities from life sciences, linguistic domain, media, social networks, and various user-generated contents. Such diversity, as a result of the linkage, has introduced a lot of possibilities as well as challenges. This diversity on the one hand provides geographic knowledge graphs with the ability to help solve cross-domain problems, such as question answering; on the other hand imposes challenge on organizing and digesting such heterogeneous information because usually different domains have different requirements and focus. For example, a
6https://wiki.dbpedia.org/
7https://www.wikidata.org
geographic knowledge graph might include entities regarding human settlements which have a lot of human-centric information (e.g., demography) as well as entities regarding biogeography which focuses on the biological aspects. These differences entail different approaches in organizing, managing, and processing the structured data.
Another perspective for the diversity in geographic knowledge graph is about the large number of heterogeneous types of information for each entity. Take the DBpedia geographic entity dbr:Los Angeles9 as an example. This entity is connected to other en-tities through various relationship types, such as(dbr:Los Angeles, rdf:type, dbo:City)and
(dbr:Leonardo DiCaprio, dbo:birthPlace, dbr:Los Angeles)which linkdbr:Los Angeleswith
the classcity and an entity (a person) Leonardo DiCaprio via atype relation and adeath
place relation respectively. In addition, entities can also be linked to literals. In the
example of dbr:Los Angeles, information such as population and elevation is expressed through literals (e.g., numbers). In principle, entities in knowledge graphs can be any-thing, tangible or intangible. In geographic knowledge graphs, such as the subgraph of DBpedia or Wikidata, multimedia (e.g., images) are usually part of the graph. These images, though represented as Uniform Resource Identifiers (URIs), encode information that is hard to extract otherwise. For example, the image might include different objects depicting different visual signals that can complement the graph itself.
In terms of quantity, the Linked Data Cloud10 has been growing constantly. In the
2016-04 data dump, DBpedia contain more than 6 million entities of which 1.53 million are geographic entities. The DBpedia ontology has 754 classes and 2,711 relations/prop-erties (including object and datatype proprelations/prop-erties). This sheer amount of information combined with the diversity of this information has introduced challenges for GIScience researchers to analyze and consume the powerful geographic knowledge graphs.
More-9
http://dbpedia.org/resource/Los_Angeles
10
Introduction Chapter 1
over, although storage is not a major concern, the ability of end users to process such immense data is limited [18]. From a psychology perspective, the philosophy of less is more has been studied in human decision making under the notion of the paradox of choice [19]. Viewing the knowledge graph as an exploratory tool that users can inter-act with by iteratively choosing nodes to expand the knowledge, too many nodes on the graph lead to too many choices and would demotivate users from using the tool in the first place [20]. As a result, a novel research area, namely knowledge graph summarization has emerged. Analogous to text summarization where the summary provides a synop-sis of the original text, knowledge graph summarization aims to identify the underlying structure and meaning of the graph using a digest graph.
The data mining community has a strong interest in (knowledge) graph summariza-tion because graph structure is ubiquitous, such as the communicasummariza-tion patterns in social networks and the molecular interactions in biochemistry, and the summarization process facilitates the reduction of data volume and storage, the speedup of graph algorithms and queries, the interaction and analysis of graph patterns, and the elimination of noise [21]. In the semantic web community, the summarization task is mostly focusing on the entity level [22, 23, 24] by considering diversity [25, 26], uniqueness [26], and popularity [26] with the optional assistance of human intervention [27, 28, 29] for knowledge graph ex-ploration [30].
However, researchers in GIScience have yet started to explore the questions involving geographic knowledge graph summarization despite the fact that GIScientists are among the early adopters of knowledge graphs and semantic web related technologies due to the three demands mentioned in Section 1.1. This dissertation is motivated by such drastic contrast between the necessity of devising better ways to summarize geographic knowledge graphs and a dearth of research effort in the area. Such a research area is distinct from its siblings that spark interest in the data mining community and semantic
web community in that spatial component is special [31] and by summarizing geographic knowledge graphs the original three demands that brought geographic knowledge graphs to GIScience in the first place should not be ignored.
1.3
Research Questions
In a broad sense, one could ask the research question how to summarize geographic
knowledge graphs? Such a question is too general and could be decomposed into
differ-ent aspects. Numerous methods for graph summarization have been proposed. Some of them are based on handcrafted features paired with machine learning and data mining algorithms [32, 33]. Others are based on top-down information such as the graph struc-ture [34, 22]. In this dissertation, we would like to explore a hybrid approach, namely combining the bottom-up and top-down approaches in order to reap their complemen-tary strengths. In this case, we would like to ask the question How can we leverage both top-down knowledge engineering and bottom-up knowledge learning approaches to help summarize geographic knowledge graphs?
This dissertation proposes to focus on both top-down and bottom-up approaches for three major reasons. First, the geographic system is a complex system which involves humans, environment, and the intricate interplay between them. Geographic knowl-edge graphs, acting as proxies to connect different components in this complex system in a semantically-enriched manner, are thus also complex. Similar to other domains such as vision, language, control, and decision-making where the dichotomy between hand-engineering (top-down knowledge) and end-to-end training (bottom-up learning) is stalling the progress of developing models and methods that can generalize, research in geographic knowledge graph summarization should take into account the challenge of combinatorial explosion due to the complexity of the system. Second, the combination
Introduction Chapter 1
of top-down and bottom-up approaches has proven to be effective for developing more generalized models. The principle of combinatorial generalization is constructing new inferences, predictions, and behaviors from known building blocks [35]. Such an idea has been explored in vision where the building blocks take advantage of the spatial transla-tion invariance [36, 37] in images, in language where the building blocks are informed by the temporal translation invariance [38] in sentences, and in network analysis where the building blocks are from the node and edge permutation invariance [39] in graphs. To give a concrete example in the natural language domain, humans are able to utilize a few sets of elements (words) and combine them in limitless ways (sentences). This ability to make infinite use of finite means [40] marks the key component of human intelligence. Inspired by the wisdom in biology where nature and nurture complement each other, this dissertation acknowledges the fact that top-down and bottom-up methods are compatible with each other and they can work together to find a solution to the geographic knowledge graph summarization problem. Third, the spatial11 component in geographic knowledge graphs is a natural source of top-down knowledge. Unlike domain-agnostic knowledge graphs, geographic knowledge graphs are accompanied by a number of hidden patterns informed by the geographic components, such as spatial correlation and spatial depen-dency. Leveraging such geospatial inductive bias (i.e. top-down knowledge) is helpful in the context of geographic knowledge graph summarization. Analogous to the spatial translation invariance, temporal translation invariance, and permutation invariance in vision, language, and network analysis, geospatial contextual invariance (i.e. the com-mon ways in which geospatial context can inform nearby spatial/non-spatial attributes) is essential in dealing with the combinatorial generalization challenge in summarizing geographic knowledge graphs.
After establishing the general research question, let us decompose it into several
related small questions to obtain a more tangible idea of the scope and challenge of this research. Considering the composition and diversity of geographic knowledge graphs explained in Section 1.2, the question of summarization can be treated from three aspects, namely the hierarchical components, the multimedia leaf node components, and general relation and entity components. Thus, this dissertation is aiming to tackle three research questions regarding geographic knowledge graph summarization.
Research Question 1: How do we summarize the hierarchical place type information in geographic knowledge graphs?
This research question focuses on the hierarchical component, namely the place types. This is an important component in geographic knowledge graphs because the hierarchical place type structure reflects the way humans conceptualize the relationship of different geographic categories. In a sense, by isolating and emphasizing this hierarchical place type component, we also aim to preserve the conceptualization power of the ontology accompanied by the geographic knowledge graph and make sure that the summarization process would still satisfy the conceptualization demand of semantically lifting geographic data. While place type conceptualization and their hierarchical relationships (i.e. super-class and subsuper-class) are merely part of the geo-ontology, they pose more challenge than the axioms in the summarization process because these conceptualizations are related to philosophical human construct — an area where machine intelligence still struggles — whereas the axioms are related to first-order logic — an area where machine traditionally excels.
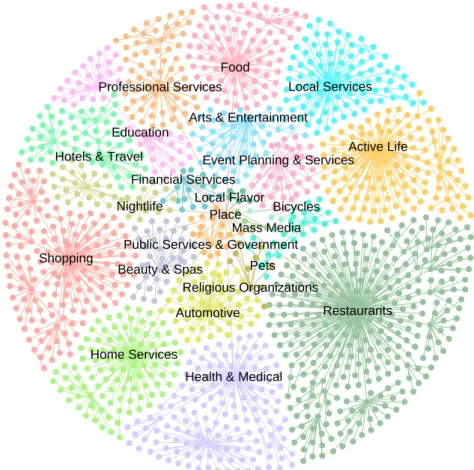
To give a concrete example, consider the place type hierarchy in Yelp data12 (shown in Figure 1.1). On the top level there are 22 root place types (e.g.,Restaurants,Shopping,
Health & Medical, etc.) and on the bottom level there are 1,030 place types. A naive
approach would be to choose a particular level and use the place types in that level as the
12
Introduction Chapter 1
Local Services Professional Services
Education
Automotive
Arts & Entertainment
Home Services Shopping
Restaurants Event Planning & Services
Food
Health & Medical
Active Life
Beauty & Spas
Local Flavor
Public Services & Government Hotels & Travel
Mass Media Place Nightlife Financial Services Bicycles Pets Religious Organizations
Figure 1.1: Place type hierarchy visualization for Yelp data. These place types are commonly used in geographic knowledge graphs and are important part of the con-ceptualization in the ontology.
summarized place types. However, it’s hard to decide on the cutoff level because such a method is dependent on the particular place type hierarchy. In addition, uniformly choosing place types from the same level ignores the fact that hierarchical conceptual-izations of different place types are not balanced. Certain place type conceptualconceptual-izations are more expressive and informative than others. For instance, as shown in Figure 1.1, the branch for Restaurants has much more place types than the branch for Education. As a result, by uniformly cutting off at a particular level, a lot more information is lost for the Restaurants branch than for the Education branch. In this case, a bottom-up approach appears to be more generalizable for place type summarization across different geographic knowledge graph datasets. Instead of focusing on the hierarchical structure,
the data-driven method could essentially take advantage of the linguistic aspects of the place type by examining the meaning of each concept in the hierarchy (ontology).
However, the words associated with these place types are merely proxies for geographic feature types in the knowledge graph. In order to reveal the underlying geospatial seman-tics [16], the model also need to be ware of the geospatial context. The main challenge of this research question then comes down to developing a model that marries the data-driven method and the geospatial contextual knowledge. The objective would be to use the result of the model to guide the place type summarization process, such as ranking and selecting relevant place types for the use case.
Research Question 2: How do we summarize multimedia leaf node information, such as images, in geographic knowledge graphs?
This research question focuses on the multimedia leaf node components. As men-tioned in Section 1.2, geographic knowledge graphs are versatile because it can carry multimedia information, such as images, in the leaf nodes. This special ability also cor-responds to the accessibility demand in the geospatial semantics paradigm because this visual information is a catalyst for a better human-machine interaction. Because of this, in research question 2, we are dedicated to developing approaches to summarizing these multimedia nodes using images as examples.
Images in geographic knowledge graphs only exist in leaf nodes as Uniform Resource Locators (URLs) and they do not have labels (e.g., mountains, rivers, etc.). In order to select a subset of relevant images and summarize the whole graph by striking the balance between commonality and variability, we need to develop robust algorithms to help label the numerous leaf image nodes first. Although existing image classification models can assist in labeling the images, they usually suffer from a tendency towards biases [41] because there is a discrepancy between the training data distribution and the distribution of more complex real-world systems [42]. Since our task domain is
Introduction Chapter 1
in GIScience, we are interested in devising ways in which such bias can be mitigated for labeling images in geographic knowledge graphs. One potential solution to such a challenge is to incorporate geospatial signals in addition to the visual stimuli in current state-of-the-art models. This idea corresponds to the notion of geospatial inductive bias
(which will be explained in detail in Chapter 2) and is in line with the idea of integrating geospatial components in Research Question 1.
As there are different ways to consider geospatial components, such as geographic distance and topological relationship, under different granularities, such as neighborhood level, city level, and country level, it would be worthwhile to explore different integration strategies with the visual components on images. This exploration gives us guidance on the extent to which different geospatial components and different integration strate-gies can benefit the image labeling process and subsequently the summarization process of geographic knowledge graphs. Because both the image classification model and the
geospatial inductive bias are generic methods and ideas, the resulting hybrid models can
be applied to a variety of geographic knowledge graphs.
Research Question 3: How do we summarize relations and entities in geographic knowledge graphs in general?
While Research Question 1 and Research Question 2 aim to tackle the hierarchical place type structure in the geo-ontology and the multimedia leaf nodes in geographic knowledge graphs that correspond to the conceptualization demand and the accessibility demand respectively, Research Question 3 is focusing on finding the general solution to the summarization problem. After dealing with the place type information in the ontology and the leaf image nodes which are important components in geographic knowledge graphs, we would like to explore summarization approaches that can be applied to general relations and entities (besides place type relations and leaf image node entities).
and abstraction-based text summarization. Extraction-based summarization extracts words and sentences directly from the original text based upon relevance and importance while the abstraction-based one involves paraphrasing and provides a more condensed summary. Similar to text summarization, knowledge graph summarization methods can also be categorized into extraction-based and abstraction-based approaches. More specif-ically, according to the core techniques employed, popular ones include grouping or aggre-gation based (extraction or abstraction), bit compression based (extraction or abstrac-tion), simplification or sparsification based (extracabstrac-tion), and influence based methods (extraction or abstraction) [21]. Since we would like to maintain the interoperability that geographic knowledge graphs created, extracting a subset of relations and entities from the original graph subsequently making existing connections and conceptualiza-tions intact is preferred. In this case, it is more desirable to employ the simplification or sparsification based approaches.
There are two major challenges in tackling this question. The first one is the subjec-tivity issue in summarizing geographic knowledge graphs. Since the relative significance of a relation or entity in identifying the graph is subjective to the application field, it is hard to universally define any metrics or evaluation schemes to justify the choice. Fortunately, studies [43, 44] have shown that Wikipedia articles are relatively unbiased. So leveraging curated, neutral summaries in Wikipedia articles would be a good start. Such an idea is more obvious considering that there is a clear correspondence between Wikipedia articles and many major knowledge graph repositories [45], such as DBpedia. The second challenge is related to the geospatial component in geographic knowledge graphs. While the semantics of a knowledge graph is well-established, evidence [46, 47] has shown that geospatial semantics (in a geographic knowledge graph) needs special care. In order to better summarize geographic knowledge graphs, the proposed method should explicitly model geographic components and make them the first-class citizens.
Introduction Chapter 1
1.4
Dissertation Synopsis
This introduction chapter describes the background and motivation behind the rising interest in geographic knowledge graphs and the geospatial semantics domain in general. It then explains in detail the challenges and discusses three open questions that this dissertation is aiming to answer. The core content of this dissertation is based upon three individual yet related articles. These three articles (Chapter 3, Chapter 4, and Chapter 5) provide answers to three research questions raised in Section 1.3. These three chapters first appeared as various publications shown below:
• Chapter 3: Yan, Janowicz, Mai, and Gao [48].
• Chapter 4: Yan, Janowicz, Mai, and Zhu [49].
• Chapter 5: Yan, Janowicz, Mai, and Zhu [45].
The remainder of this dissertation is organized as follows.
Chapter 2 presents background knowledge and foundational concepts that have been used frequently in this dissertation. Specifically, we introduce and define the concept of geospatial context, geospatial inductive bias, knowledge graph, and geographic knowledge graph. By pointing out the fact that GIScience research has been implicitly using the idea of geospatial context and geospatial inductive bias, this chapter establishes the unification of these frequently used ideas as a foundation for the methods used in later chapters. It then introduces the summarization task for (knowledge) graphs, classifies existing work based on their core techniques, and reviews related methods and algorithms. Finally, it points out the need for methods that consider geospatial inductive bias to better summarize geographic knowledge graphs.
Chapter 3 presents a latent representation learning method for place types. Place types are typically represented in a hierarchical structure and are widely-used as
con-ceptualizations in the ontology for geographic knowledge graphs. Traditionally, latent representations of place types are learned via their distributional semantics based on their occurrences in linguistic contexts. In this chapter, we ground these place types into the geospatial context and learn their embeddings based on geospatial distributional semantics. Geospatial inductive bias is applied using an information-theoretic distance lagged approach on both local and global neighborhoods. The final embeddings carry geospatial semantics content that is otherwise ignored by other approaches. These em-beddings can be used to determine the similarity and relatedness of different place types and help decide the relevance scores in geographic knowledge graph summarization tasks. Chapter 4 presents a method that utilizes geospatial contextual information as a Bayesian prior to help improve the classification of images for different place types. The major challenge in image classification is that the bias in training samples is likely to affect the classification result of unseen patterns. In order to facilitate the classifica-tion process, the model considers both the visual stimuli and the geospatial context in which the image is located. Geospatial inductive bias is applied by using the latent representations (Chapter 3), spatial co-location patterns, and spatial sequence patterns. This classification method can be used in geographic knowledge graph summarization to help select different types of images in a neighborhood as image labels are typically not specified in geographic knowledge graphs.
Chapter 5 presents a spatially-explicit reinforcement learning model for geographic knowledge graph summarization. The model formulates the summarization task as a sequential decision making process through trial and error. The learning process is pow-ered by the theories in reinforcement learning. The geospatial inductive bias is applied by introducing an explicit spatial action for the reinforcement learning agent. While Chapter 2 and Chapter 3 present two special cases of summarization geographic knowl-edge graphs based on two important components (place types and image leaf nodes), this
Introduction Chapter 1
chapter aims to provide a more generic approach.
Chapter 6 presents a web map interface that facilitates the exploration of geographic knowledge as a case study for summarizing geographic knowledge. The interface takes advantage of the proposed geocoding enrichment process as well as an entropy-based geographic knowledge graph summarization approach. In order to provide a scalable system, it adopts the serverless and scalable framework using Amazon S3, AWS Lambda, and Amazon API Gateway provided by the Amazon Web Services. Linkage discovery and spatial pattern discovery are presented as examples to illustrate the usefulness of the web map interface as a means of discovering spatial knowledge.
Finally, Chapter 7 concludes the dissertation by providing a summary and discus-sion of previous chapters. In addition, research contributions including theoretical and practical implications are discussed for this research. Several limitations are listed and possible future research directions are proposed for further investigation.
Foundational Concepts and Theories
This chapter provides two pieces of information — the background knowledge to under-stand the ideas and methods used in the dissertation and related work for (knowledge) graph summarization. The background knowledge includes the concept of geospatial context and geospatial inductive bias as well as the definition of knowledge graphs and geographic knowledge graphs. We introduce this background knowledge by means of providing intuitive examples, comparing with other related fields, and explaining based on existing work.
Foundational Concepts and Theories Chapter 2
2.1
Geospatial Context and Geospatial Inductive Bias
This section first explains the concept of geospatial context which is usually implicitly used in a variety of GIScience research and reviews several research studies that used this idea. Then it brings up the idea of geospatial inductive bias that is central to the methods used in later chapters. While similar concepts have been used in research that incorporates geospatial components, we believe it is necessary to explicitly define these terms and clarify their implications.
2.1.1
Geospatial Context
There is a consensus among GIScientists that locations are not just two extra columns (one for latitude and one for longitude) in your spreadsheets. Such an understanding im-plies that location data or geospatial data should be treated differently compared with data with no spatial attributes. Indeed, spatial is special. By studying spatial data or-ganization, analysis and interpretation, spatial statistics has pointed out the importance of many geospatial components, such as distance [50], direction [51], spatial autocorre-lation [52], spatial nonstationarity [53], and spatial interaction [54]. While these interre-lated concepts and statistics have their own emphasis on different aspects of geospatial data, they have some commonalities. First of all, they all have a reference area. While one can still calculate these statistics for an arbitrary number of geographic data in an arbitrary sized area, the scale and the context [55, 56] are crucial for interpreting these statistics meaningfully. Regardless of the scale (local or global), it is important to maintain the consistency of the reference area in measuring these values. Second, while these statistics are grounded in geographic locations, their values are usually from other attribute information, such as temperature and humidity.
the ideas behind these research efforts, we propose the concept of geospatial context. As the name suggests, instead of defining the exact type of statistics or aspects in which geographic component is used, geospatial context is a broad concept and focuses more on the fundamental idea that the context in which geospatial data and their relationships are examined is an important consideration in GIScience research.
Definition 1 (Geospatial Context) Given a geographic dataset, each entity e has a
geospatial contextGCe= (Re, Ae, fe)whereReis the reference area,Aeis the set of values
associated with e, and fe is the function to encode the geospatial contextual information
for e.
The reference areaRis a generic term that defines the scale of the geospatial context. It can be measured by the absolute area surrounding the entity, such as the buffer area or determined by the total area covered by a fixed number of nearby entities. This flexibility allows for customizable scales in which geographic data is aggregated. In addition, the reference area R is not uniformly defined across all entities in the dataset and can even change depending on the choice of A and f. This dynamic nature of R
reflects the spatial homogeneity and heterogeneity of geographic data. The value set A
determines the types of attributes used in the study. It is usually a subset of all the attributes associated with the dataset. This subset of attributes can be in the form of nominal, ordinal, interval, or ratio data. For example, activity categories (nominal), temporal bands (ordinal and interval), and check-in counts (ratio) are all used in a study to encode behavior-driven temporal signatures of different place types to improve reverse geocoding [57]. Typically, the same set of A is used across the whole dataset. There can be exception if certain attributes are missing for individual entities or certain attributes are related. The encoding function f takes the A values of current entity and all geographic entities within the reference area R as inputs and outputs the embedded
Foundational Concepts and Theories Chapter 2
geospatial contextual information. As mentioned before, this functionfcan be
commonly-used spatial statistics, such as distance decay factors, Moran’s I [58], and Ripley’s K [59]. It can also be analytical patterns [60] or approximation functions learned from optimizing the parameterizations to satisfy particular geographic patterns [61, 62, 63].
Numerous research studies have either implicitly or explicitly adopted the concept of geospatial context and taken advantage of the patterns in the geospatial contextual information to improve model performance and help with the decision-making process. In criminology, distance-decay function has been used for profiling [64]. In data man-agement, spatial signatures [65] have been used for ontology matching across different geospatial datasets. In information retrieval, geospatial context has been used for music recommendation and achieved better results compared with non-spatial models [66]. In computer vision, location context has been used as Baysian priors [61] as well as features in neural networks [62] to improve image classification accuracy.
2.1.2
Geospatial Inductive Bias
As this dissertation aims to tackle the geographic knowledge graph summarization problem by means of a combination of top-down and bottom-up approaches, one of the concerns is to develop an ideal learning process. Typically, the learning process gains knowledge by observing available data and finds the solution that better explains the underlying patterns or achieves high rewards. Since in any realistic learning process the instance space (all possible data points) would be too large to be covered by the training dataset, assumptions or preferences have to be made on the hypothesis space (e.g., rules that determine the decision boundaries for a classification problem) for inductive methods to achieve on average better results than random guessing [67]. This type of a priori assumption or preference is called the inductive bias [67, 68, 69] in the machine learning
and AI community in general.
The inductive bias allows the learning algorithm to prioritize one solution over the other [67]. This bias is manifested in different forms. To overcome overfitting, regular-ization might be incorporated in the model as an inductive bias. For Bayesian models, an inductive bias might be a specific parameterization or the choice of prior distribution. In graphical models, the push towards the greatest randomness and the memorylessness assumptions are inductive biases in Maximum Entropy Markov Models. In neural net-works, the inductive bias is represented as a preference towards a particular network architecture, such as convolutional vs. recurrent blocks.
Many approaches in GIScience as well as other application domains which utilize geospatial data use the idea of geospatial inductive bias. Instead of giving a formal defi-nition, we use this term to generally refer to inductive biases which impose constraints or assumptions based upon geospatial contextual information obtained from the geospatial context. While linear regression has the inductive bias that the data-generating process can be explained simply as a line process corrupted by additive Gaussian noise [35], geo-graphically weighted regression [53] has the geospatial inductive bias that separates the region into local subregions (geospatial contexts) to model spatially varying relationships (spatial nonstationarity). Geospatial inductive bias can also be the choice of spatial in-dexing, tessellation, and aggregation scale. Geospatial semantics is a source of geospatial inductive bias and it can be used as a means to inform people’s sense of place to an extent comparable to that of pure cognitive approaches [10]. In Chapter 3, we will introduce an information-theoretic distance lagged approach as a means of geospatial inductive bias to adjust the distribution of POIs and learn latent representation for place types in local as well as global geospatial contexts. In Chapter 4, the geospatial inductive bias is based on the sequentially-dependent geospatial contextual information and is modeled as spatially-explicity Bayesian priors to facilitate the classification of images of
differ-Foundational Concepts and Theories Chapter 2
ent place types (e.g., restaurants, hotels, etc.). In Chapter 5, we exploit the geospatial inductive bias by explicitly introducing a spatial action in the policy agent in order to account for the spatial dependencies in the geographic knowledge graph summarization process.
2.2
Geographic Knowledge Graphs
In this section, we explain the components of a knowledge graph and the commonly-used data model to represent knowledge graphs. Then we provide the general definition of a geographic knowledge graph and point out its distinctions from other knowledge graphs.
While the idea behind knowledge graphs is nothing new [70, 71, 72, 73], it is experi-encing a renaissance among a wide range of research communities (including GIScience) after its successful debut in large scale data management systems (including Google search engines) and becoming the common support for browsing, searching, and discov-ering knowledge. Knowledge graphs are structured datasets that describe entities and their relationships. The entities can be anything and the relationships can have any type. This flexibility has enabled knowledge graphs to become an important component of the semantic web [71]. Although knowledge graphs can be implemented using different underlying data structures and conform to different standards, most knowledge graphs, such as DBpedia, Wikidata, and Freebase, support the Resource Description Framework (RDF) model.
The atomic data entity in RDF is the triple, which is composed of three parts in the form of subject-predicate-object (s-p-o) expressions1 (e.g. Santa Barbara isPartOf California). Subjects and objects can be entities (objects can also be literal strings)
1The alternative head-relation-tail or h-r-t expressions are also used in some literature and this
while predicates define the relationships between subjects and objects. Every entity or relationship is represented by an URI which uniquely identifies it. Conceptually and equivalently, the entities in the RDF model are nodes and the predicates are edges (links) in the graph. Here we give the definition of a knowledge graph considering the duality that it is both a graph model and represented by the RDF triples.
Definition 2 (Knowledge Graph) For a set of RDF triples T where each triple ti =
(si, pi, oi) ∈ T, a Knowledge Graph is a multi-relational graph G = hV,Ei where V =
{si|(si, pi, oi)∈T} ∪ {oi|(si, pi, oi)∈T} and E ={pi|(si, pi, oi)∈T}.
From the definition we can see that a knowledge graph is conceptually a graph but rep-resented as RDF triples for computational and reasoning purposes. Unlike homogeneous graphs, a knowledge graph usually contains hundreds of thousands of different types of relations (such as isPartOf, headquarterOf, locatedIn relations). Homogeneous graphs, such as the friendship network, the coauthorship network, or the molecular interaction network, only contain one type of relation, such as the friendship relation, collabora-tion relacollabora-tion, or molecular interaccollabora-tion. Because it models different relacollabora-tionships in the graph, a knowledge graph is considered a multi-relational graph (a.k.a. heterogeneous information network in some literature).
Because of the duality, research efforts have long been focusing on two parts, the RDF part, such as reasoning [74], SPARQL2 queries [75, 76], and triple pattern frag-ment [77, 78, 79], and the network part, such as entity resolution [80, 32, 81]. There is a trend to unify these two separate yet related parts in the knowledge graph and semantic web community. Mika [82] introduced a tripartite model that extended the bi-partite model of ontologies with the social dimension and showed how community-based semantics emerges from this model through a process of graph transformation. In order
Foundational Concepts and Theories Chapter 2
to provide support for fine-grained latent coherence between entities and predicates in graph-based authority ranking, Franz et al. [34] presented the TripleRank model to cap-ture the additional latent semanticsby means of statistical methods in order to produce richer descriptions of the available data. Schlichtkrull et al. [83] adopted the idea of latent representation learning in Graph Convolutional Networks (GCN) and introduced Relational Graph Convolutional Networks (R-GCN) to handle the highly multi-relational data characteristic of realistic knowledge graphs.
Geographic knowledge graphs are domain specific knowledge graphs. In a broader sense, any knowledge graph that contains geographic entities is a geographic knowledge graph. Here we give the definition of geographic knowledge graphs.
Definition 3 (Geographic Knowledge Graph) Given a Knowledge GraphG =hV,Ei,
for a propositional function P(x) denoting ‘g(x) is a meaningful geographic identifier’
where function g maps an input x to a geographic identifier, if ∃v ∈ V P(v) is true then
G is a Geographic Knowledge Graph.
The mapping function g would try to map an entity/node to a geographic identifier. For example, if the entity s is University of California Santa Barbara, g(s) would be, for instance, the centroid point coordinates or the polygon representing the university in Well-Known Text (WKT). Such geographic identifiers can be any geometry, such as points, lines, and polygons, in any representation, such as WKT, geojson, and shapefile. The most common geographic identifiers used in geographic knowledge graphs are points represented by WKT. This definition does not restrict geographic knowledge graphs to be knowledge graphs with only geographic entities because geographic entities are usu-ally associated with nonspatial attributes such as names and geographic types. Ideusu-ally, a geographic knowledge graph should contain predicates that represents topological
rela-tionships of geographic entities. With the assistance of GeoSPARQL3, geospatial queries
can be conducted directly on RDF data and this capability accommodates systems based on qualitative spatial reasoning and systems based on quantitative spatial computations. As the idea of geographic knowledge graph is still in its infancy, there are only a hand-ful of research about it. Mai et al. [84] visualized the distribution of geographic features in a semantic space using the DBpedia geographic knowledge graph based on the idea of semantic enhancement in spatial visualization [85]. Janowicz et al. [86] comprehensively analyzed the systematic errors in geographic knowledge graphs and their potential causes and discussed lessons learned and means to avoid some of the introduced pitfalls in the future. Regalia et al. [87] used a geographic knowledge graph to showcase a proxy that can transparently run on top of arbitrary SPARQL endpoints to enable the on-demand computation. Kejriwal and Szekely [88] presented a dataset that embeds populated place in the Geonames4 knowledge graph using neural embeddings methods.
2.3
Graph Summarization
In this section, we talk about two related concepts, namely graph summarization and knowledge graph summarization. Graph summarization is an area that has attracted a lot of research efforts in the data mining and data management communities. We explain the objectives of graph summarization, discuss its challenges, and review existing meth-ods. Strictly speaking, for the knowledge graph summarization, we are in fact explaining the idea of semantic graph summarization which is a superset of knowledge graph sum-marization. Nonetheless, they have the same objective and share the same methods. The idea of knowledge graph summarization will be discussed and existing methods reviewed. Finally, we point out that methods specifically tailored towards geographic knowledge
3
https://en.wikipedia.org/wiki/GeoSPARQL
4
Foundational Concepts and Theories Chapter 2
graphs are needed in order to capture the geospatial inductive bias in geospatial contexts. The idea of graph summarization has becoming popular in the context in which an enormous amount of graph structured data has been produced on a daily basis and hu-man’s ability to process such a large amount of information and identify hidden patterns in the data is limited. The objective of the graph summarization task is therefore to facilitate the identification of structure and meaning in data [21] and assist the discovery of hidden patterns. It helps to reduce data volume and storage, speed up graph algo-rithms and queries, support interactive analysis, and eliminate noise. However, there are also many challenges for this task. First of all, although graph summarization can reduce the data volume, the summarization algorithm itself is faced with the challenging of processing large data inputs. Efficient algorithms are thus critical in the summariza-tion task. Second, graph data is complex. The graph structure is versatile because of the underlying structure (e.g. homomorphism and isomorphism) and this versatility has imposed challenges in dealing with graph data. The heterogeneity of nodes and edges in real-world graphs makes analyzing graph patterns a complicated task. The graph can be dynamic and evolve over time. In addition, the noise and missing information in graph data add another layer of complexity. Third, graph summarization is subjective. De-pending on the domain knowledge and user preference, the consideration of the trade-off among space, time, and information preservation in the graph summary, the complex-ity of mapping the solutions to recover the original graph from the summary, and the optimization formulation, the summarization could be quite different. Decision for each of the components during the process is subjective. As a result, the evaluation is also subjective and challenging. The evaluation of a graph summarization result is heavily dependent on the application domain. For a social network, the evaluation will be based on whether the summary is able to preserve community information. For a visualization task, the evaluation will be based on user studies and qualitative criteria.
Depending on the core techniques employed, graph summarization methods include grouping or aggregation based, bit compression based, simplification or sparsification based, and influence based [21]. The grouping or aggregation based approaches ag-gregate nodes into supernodes based on application-dependent optimization functions. Grouping-based methods are among the most popular approaches for graph summariza-tion. For example, by clustering nodes and discovering communities [89, 90], algorithms can help obtain a summary view of the graph. LeFevre and Terzi [91] proposed a hi-erarchical clustering-based node grouping algorithm (GraSS) for graph summarization that can target accurate query handling. Toivonen et al. [92] developed a method that merges structurally equivalent nodes in a way that minimizes approximation error and maximizes compression. The goal of bit compression-based methods is to minimize the number of bits needed to describe the original graph. Works in this category typically formulate summarization as a model selection task and employ the two-part Minimum Description Length (MDL) principle [21]. Simplification-based methods summarize the graph by removing unimportant components (nodes and edges) to produce a sparsified graph. For instance, OntoVis [93] provides a visualization tool to help filter nodes in order to facilitate the understanding of large heterogeneous networks. Influence-based approaches summarize the graph by formulating the tasks as an optimization process and understanding the patterns of influence propagation in the network. For example, Mehmood et al. [94] adopted community-level social influence information propagation analysis to summarize social networks.
In the context of knowledge graphs, the summarization task has a different scope. Knowledge graph summarization is specifically focusing on labeled, directed, heteroge-neous graphs with semantics and type information. Based upon the algorithmic ideas,
ˇ
Cebiri´c et al. [95] classified knowledge graph summarization methods into four categories, namely structural methods, pattern-mining methods, statistical methods, and hybrid
Foundational Concepts and Theories Chapter 2
methods. Zhang et al. [96] proposed to summarize the ontology by extracting a set of salient RDF sentences according to a re-ranking strategy. Khatchadourian and Con-sens [97] developed a summarization method by combining text labels and bisimulation contractions. Zneika et al. [98] summarized large RDF graphs using top-K approximate graph patterns. Song et al. [99] utilized approximate graph pattern matching to sum-marize entities in terms of their neighborhood similarity up to a certain hop. Hose and Schenkel [100] proposed a sketch-based query routing strategy that takes into account source overlap in order to select sources from the knowledge graph cloud.
For geographic knowledge graphs, the geographic components add another layer of complexity. As mentioned in Section 2.1, the hidden pattern in geospatial contexts contain a variety of information that could potentially assist the summarization process for geographic knowledge graphs as a large number of entities have their corresponding geographic location. Existing methods fail to consider the rich geospatial contextual information and cannot take into account the inherent geospatial inductive bias in the summarization algorithms.
2.4
Summary
In this chapter, we laid out the foundational concepts and theories used in this dis-sertation. The first concept is geospatial context which we provided the formal definition to help unify existing work using the idea of geospatial contextual information to develop better models for GIScience problems. Based on the notion of geospatial context and the idea of inductive bias in AI research, we introduced the concept of geospatial inductive bias. We gave examples showing how this fundamental idea of imposing constraints or assumption based on geospatial contextual information is widely-adopted in GIScience research. After establishing these foundational concepts and ideas in solving GIScience
questions, we provided the definition of knowledge graphs, acknowledging the its duality. The definition of geographic knowledge graphs was introduced. In the end, we pre-sented challenges of summarizing (knowledge) graphs, reviewed existing algorithms, and pointed out the need for new methods that are tailored towards geographic knowledge graph summarization tasks.
Chapter 3
Reasoning About Place Type
Similarity and Relatedness
In this chapter, a spatially-augmented latent representation learning method is proposed to embed place types. Such a method explicitly considers geospatial contextual informa-tion. By comparing the result with existing word embedding result using one hierarchy-based evaluation scheme and two human judgment-hierarchy