Waveform Envelope Method to Detect Point on
Wave initiation of Voltage Sag
N. N. Jangle A. M. Jain
Department of Electrical Engineering Department of Electrical Engineering K.K.Wagh Institution of Engineering Education & Research,
Nashik
K.K.Wagh Institution of Engineering Education & Research, Nashik
B. E. Kushare
Department of Electrical Engineering
K.K.Wagh Institution of Engineering Education & Research, Nashik
Abstract
This paper presents an algorithm for detection and characterization of voltage sag on transmission and distribution lines using Waveform envelope Method. Voltage sag magnitude and duration are two commonly used characteristics of voltage sag. These two characteristics can be obtained by using RMS voltage method. But the other characteristics of voltage sag like point on wave and phase angle jump are not clear from RMS voltage calculation as it uses one or half wave window. In this paper RMS voltage method and discrete wavelet transform method is used to calculate voltage sag magnitude of voltage sag disturbance from fundamental 50 Hz frequency. Point on wave initiation is a characteristic that can not be identified from RMS waveform. So, to detect Point on wave initiation sinusoidal voltage equation is used with discrete wavelet transform. As alternating waveform is not always ideal but it is disturbed due to different load conditions on system, Waveform envelope algorithm is simulated to detect point on wave initiation in MATALAB simulink and the results are presented at various magnitudes and Point on Wave initiations.
Keywords: Power Quality, Point on Wave Initiation, Voltage Sag, Discrete Wavelet Transform, Waveform Envelope ________________________________________________________________________________________________________
I.
I
NTRODUCTIONPower quality has become an important issue over the past several years [1]. One of most important power quality issues on transmission and distribution lines is the voltage sag. It causes severe effects to end users [1, 2]. In general, sag characteristics, e.g. magnitude and duration are typically determined using an RMS envelope. For some types of equipments an accurate determination of fault initiation and clearing time is needed to properly determine other characteristics such as Point on Wave, phase angle jump to verify proper operation of equipment [2, 3]. Accurate time localization or Point on Wave initiation of sa g disturbance is one of the important first steps in accurately determining some of these additional parameters. IEEE standard 1346, 1998 states that information about phase shift and Point on Wave values is not typically available in sag environment data. Therefore for compatibility evaluation it is recommended that phase shift and Point on Wave initiation should not considered. Reference [3], particularly describes that the behavior of contactor not only depends on magnitude and duration of voltage sag but also the Point on Wave initiation where voltage sag occurs. This paper describes the definition of voltage sag characteristics, algorithm for characterization of voltage sag and results by using MATLAB 7.1 software.
II.
V
OLTAGE SAG CHARACTERISTICSThe voltage sag is defined by IEEE Standard 1159-1995, IEEE Recommended Practice for Monitoring Electric Power Quality, is a decrease in RMS voltage or current at the power frequency for durations from 0.5 cycles to 1 minute, reported as the remaining voltage. Typical values are between 0.1 p.u. and 0.9 p.u. and typical fault clearing time ranges from three to thirty cycles Another definition as given in IEEE Std. 1159, 3.1.73 is A variation of the RMS value of the voltage from nominal voltage for a time greater than 0.5 cycles of the power frequency but less than or equal to 1 minute. This paper presents an algorithm, which will give the characteristics of voltage sag using DISCRETE WAVELET TRANSFORM with RMS and instantaneous waveform. The algorithm is tested with the waveforms obtained from simulation model of voltage sag generator, developed in MATLAB 7.1, using SymPowerSystem toolbox. Following are the important characteristics to which equipments are sensitive [1-4].
Voltage Sag Magnitude
Duration
Point on wave
Missing Voltage
III.
V
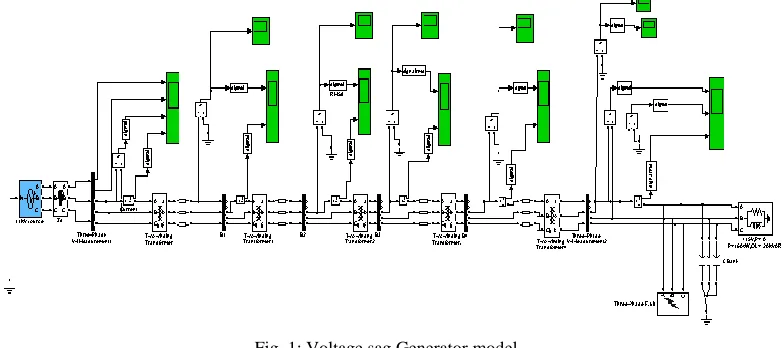
OLTAGE SAG GENERATOR MODELA simulation model figure 3.1 is developed to generate voltage sag. To obtain the voltage sag three-phase single line to ground fault is created. The voltage sag of magnitudes 10, 20, 30....up to 80 % and Point on Wave initiation from 0 degree to 90 degree with the steps of 15 degree differences is generated in the simulation model.
From the simulation model RMS and instantaneous waveforms are captured across the load. By using RMS waveform voltage sag magnitude and duration are calculated according definition mentioned in the IEEE standard 1159-1998. The magnitude is calculated as the percentage of the remaining voltage during the event and the duration is by looking for RMS voltage levels that drops below a specified threshold. A software program is developed to detect point on wave initiation at voltage sag magnitudes 0, 10, 20, …..80% and at 0, 15,30,…..90 degree point on wave initiation using DISCRETE WAVELET TRANSFORM.
Fig. 1: Voltage sag Generator model
IV.
A
LGORITHM FOR VOLTAGE SAG MAGNITUDE AND DURATIONConsidering one cycle window before RMS voltage start, to detect start of voltage sag using DWT (Discrete Wavelet Transform) Daubechies wavelet (db4) is used. This method is capable to identify start and stop times close to 100% of the disturbance analyzed, and it produces results as good as or better than those obtained from RMS voltage method. -The Discrete wavelet transform procedure is used to determine the Point-on-wave initiation as it detects sag start. Discrete Wavelet Transform approach is explained to detect start and end of voltage sag in [5]
Following algorithm is implemented on the waveform obtained from simulation to detect magnitude and duration of the voltage sag.
Steps of the algorithm for voltage sag magnitude and duration.
Step 1 Start
Step 2 Get instantaneous sag waveform data, instantaneous ideal waveform data, and RMS waveform data as input from workspace.
Step 3 Find maximum voltage of RMS waveform (vmax).
Step 4 Find maximum voltage of ideal instantaneous waveform (Vmax).
Step 5 Find pre-fault RMS voltage
Step 6 Find minimum voltage of RMS waveform i.e. ‘Magnitude of remaining voltage’.
Step 8 Calculate Missing voltages.
Step 9 Find Start of voltage sag by considering fall of RMS voltage by 0.9pu.
Step 10 Find End of voltage sag by considering rise of RMS voltage by 0.9pu.
Step 11 Calculate duration of Voltage Sag.
Step 12 Apply Discrete Wavelet Transform db4 at scale 1 to the instantaneous sag waveform and get the WTC data.
Step 13 Calculate the Threshold (THR) by de-noising the Wavelet transform coefficients (WTC’s) obtained in Step 12.
Step 14 Find the de-noised WTC data of data vector P of length N that violets the Threshold.
Step 15 Search for the point (S) that corresponds to the Sag Start Time. To narrow the search, first find the RMS sag start time of the voltage sag. Then, define a search window extending from one cycle before the RMS start time to the RMS start time.
Step 16 To find the Sag End Time, start from S, which corresponds to nth element P (n) that fall outside the end time threshold which may be different from the start time Threshold.
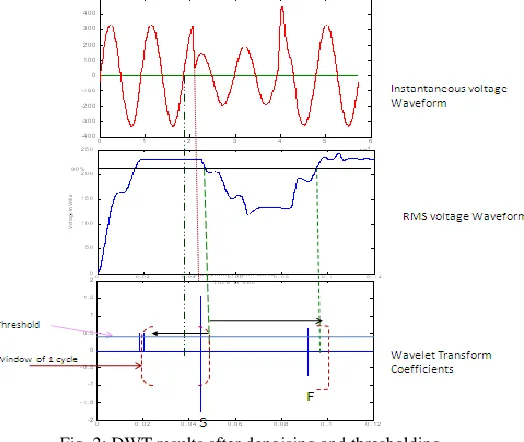
From steps implemented in above algorithm it is observed that voltage sag magnitude and duration can be easily detected by using RMS plot and Discrete Wavelet Transform Db4 wavelet as shown in figure 4.4.
Fig. 2: DWT results after denoising and thresholding
V.
W
AVEFORM ENVELOPE METHODPoint on wave initiation can also be detected by direct comparing ideal voltage waveform and disturbed waveform.
But results will not be accurate if the ideal waveform and sag waveform deviate at any instant. It is possible to detect these characteristics if the waveform envelope approach explained in [5] is implemented in algorithm.
In IEC Standard 61000-4-30: 10% and 5% waveform envelopes are used for the identification of point of initiation values and only the 10% waveform envelop for the identification of point-of-ending values. The reason for using only the 10% waveform envelope for the identification of point-of-ending values is that ‘most sags do not recover to within 5% in the data set intervals.
The waveform envelope method given in reference [5], is an alternative approach that attempts to determine the sag start and end times from the instantaneous phase voltage waveform. First, for a given sag event, the pre-fault steady state voltage is considered to be the “ideal” voltage. Next, two sets of additional waveforms, one ±10% of the ideal voltage and one at ±5%, are calculated to form an “envelope” around the ideal voltage waveform. If there is no disturbance, the phase voltage stays within the envelopes, and no event is detected. In the presence of sag, however, the voltage falls outside of one or both envelopes, and the event is detected.
In this paper the same procedure with ±5 % envelope is used to detect point-on-wave initiation. The Algorithm is summarized in VI.
VI.
A
LGORITHM FOR WAVEFORM ENVELOPE METHOD Fundamental equation uses a basic equation of Alternating voltage i.e.𝑉𝑖 = 𝑉𝑚 𝑠𝑖𝑛 𝜃 (6.1) Where Vi = instantaneous voltage
Vm= peak voltage θ = ωt =pahse angle, ω=2 Пf = angular frequency
So from this fundamental equation, Point-on-wave initiation is determined with assumption that Vi is voltage at which voltage sag start, Vm is the peak voltage of the ideal waveform.
Point-on-wave initiation i.e. θ =
𝑆𝑖𝑛
−1 𝑉𝑖𝑉𝑚 (6.2) Figure 3 shows the ±5% envelope of instantaneous voltage.
1) The event is detected when ideal waveform is deviated from the voltage sag waveform.
2) Once the event is detected it is checked that the event time and magnitude is within the 5 % envelope of ideal waveform at every 15˚ difference.
Fig. 3: ± 5 % Envelope of Instantaneous voltage waveform
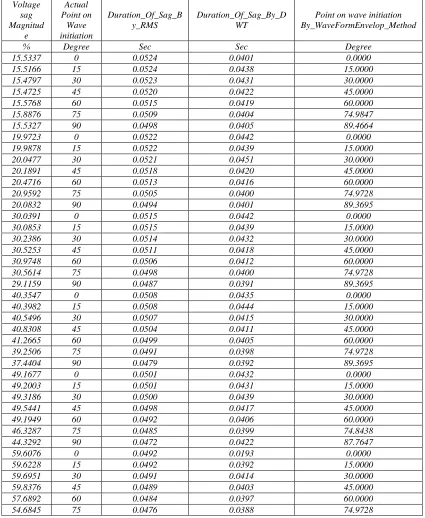
Table - 1
Point on wave initiation of voltage sag using Waveform envelope method Voltage sag Magnitud e Actual Point on Wave initiation Duration_Of_Sag_B y_RMS Duration_Of_Sag_By_D WT
Point on wave initiation By_WaveFormEnvelop_Method
% Degree Sec Sec Degree
15.5337 0 0.0524 0.0401 0.0000
15.5166 15 0.0524 0.0438 15.0000
15.4797 30 0.0523 0.0431 30.0000
15.4725 45 0.0520 0.0422 45.0000
15.5768 60 0.0515 0.0419 60.0000
15.8876 75 0.0509 0.0404 74.9847
15.5327 90 0.0498 0.0405 89.4664
19.9723 0 0.0522 0.0442 0.0000
19.9878 15 0.0522 0.0439 15.0000
20.0477 30 0.0521 0.0451 30.0000
20.1891 45 0.0518 0.0420 45.0000
20.4716 60 0.0513 0.0416 60.0000
20.9592 75 0.0505 0.0400 74.9728
20.0832 90 0.0494 0.0401 89.3695
30.0391 0 0.0515 0.0442 0.0000
30.0853 15 0.0515 0.0439 15.0000
30.2386 30 0.0514 0.0432 30.0000
30.5253 45 0.0511 0.0418 45.0000
30.9748 60 0.0506 0.0412 60.0000
30.5614 75 0.0498 0.0400 74.9728
29.1159 90 0.0487 0.0391 89.3695
40.3547 0 0.0508 0.0435 0.0000
40.3982 15 0.0508 0.0444 15.0000
40.5496 30 0.0507 0.0415 30.0000
40.8308 45 0.0504 0.0411 45.0000
41.2665 60 0.0499 0.0405 60.0000
39.2506 75 0.0491 0.0398 74.9728
37.4404 90 0.0479 0.0392 89.3695
49.1677 0 0.0501 0.0432 0.0000
49.2003 15 0.0501 0.0431 15.0000
49.3186 30 0.0500 0.0439 30.0000
49.5441 45 0.0498 0.0417 45.0000
49.1949 60 0.0492 0.0406 60.0000
46.3287 75 0.0485 0.0399 74.8438
44.3292 90 0.0472 0.0422 87.7647
59.6076 0 0.0492 0.0193 0.0000
59.6228 15 0.0492 0.0392 15.0000
59.6951 30 0.0491 0.0414 30.0000
59.8376 45 0.0489 0.0403 45.0000
1 2 3 4 5 6 7
0 50 100 150 200 250 300 350
Data Points for 1/4 cycle
In st an ta ni ou s vo lta ge
Vinst 100% nominal +5 % Envelope - 5 % Envelope 15
30 45
60
52.6349 90 0.0017 0.0390 89.3695
70.1844 0 0.0478 0.0393 0.0000
69.8920 15 0.0478 0.0520 15.0000
69.3564 30 0.0478 0.0425 30.0000
69.1209 45 0.0476 0.0399 45.0000
66.6308 60 0.0471 0.0491 60.0000
63.7376 75 0.0462 0.0409 74.9847
61.8657 90 0.0406 0.0244 89.4664
79.7741 0 0.0019 0.0367 0.0000
79.5191 15 0.0022 0.0363 15.0000
78.9733 30 0.0027 0.0368 30.0000
78.5131 45 0.0029 0.0374 45.0000
76.7085 60 0.0024 0.0370 60.0000
74.3092 75 0.0318 0.0283 74.9847
72.8989 90 0.0313 0.0437 89.4664
VII.
C
ONCLUSIONMagnitude, duration point on wave initiation, point on wave recovery, phase angle jump are the characteristics of voltage sag. Out of these characteristics magnitude and duration characteristics can be calculated by using RMS voltage and Descrete Wavelet Transform method. The important characteristics voltage sag is point on wave initiation which can not be identified from RMS waveform. To calculate this characteristic only sinusoidal waveform is required. As the sinusoidal waveform of supply is not ideal it gets fluctuated due to many reasons waveform envelope method is implemented in this paper. This method gives near to accurate values of point on wave initiation at various magnitudes of voltage sag.
R
EFERENCES[1] Roger C. Dugan, Mark F. Mcgranaghan, Surya Santoso, H. Wayne Beaty “Electrical Power Systems Quality”, second edition, Mc Grew-Hill copy right 2004
[2] Math J. Bollen, “Voltage sag indices-Draft 1.2, working document for IEEE P1564 and CIGRE WG 36-07”, Dec.2000
[3] E.R.Collins, Fernando Zapardiel, Clemson university, Clemson, SC 29634-0915 USA,”An Experimental assessment of AC contactor Behavior During Voltage sag”, ISIE
[4] 1997Saˇsa ˇ Z. Djokic´, Jovica V. Milanovic´, Senior Member, IEEE, David J. Chapman, and Mark F. McGranaghan, Member, IEEE “Shortfalls of Existing Methods for Classification and Presentation of Voltage Reduction Events “ IEEE transactions on power delivery, vol. 20, no. 2, April 2005 [5] Saˇsa ˇ Z. Djokic´, Jovica V. Milanovic, “Advanced voltage sag characterization II: Point on wave” IET Gen.Trans.Distrib. Vol.1,N0.1,Jan 2007