Performance Analysis of Multi-Channel Phased
Array Based on Noise Figure
K. Divya Dr. R. M. S. Parvathi
PG Scholar Dean(PG Studies)
Sri Ramakrishna Institute of Technology, Coimbatore, India Sri Ramakrishna Institute of Technology, Coimbatore, India
Abstract
Sensitivity of the receiver is one of the important parameter of communication system. System noise figure contributes more roles in receiver sensitivity. In single channel receiver very low noise device is used at the RF front end section to improve the system noise figure. In this research work multi-channel receiver noise figure is analysed with different configuration. In each configuration theoretical noise figure calculated for multi-channel receiver and it compared with measured results. The theoretical calculation and Simulation in Advanced Design System (ADS) is done.
Keywords: Advanced Design System (ADS), Multichannel receiver, Noise Figure (NF), RF, system noise figure, Signal to Noise Ratio (SNR)
________________________________________________________________________________________________________
I. INTRODUCTION
In antenna theory, a phased array is an array of antennas in which the relative phases of the respective signals feeding the antennas are set in such a way that the effective radiation pattern of the array is reinforced in a desired direction and suppressed in undesired directions. The phase relationships among the antennas may be fixed, as is usual in a tower array, or may be adjustable, as for beam steering. Phased array systems can be used to control missiles during the mid-course phase of the missile's flight. During the terminal portion of the flight, continuous-wave fire control directors provide the final guidance to the target.
Noise figure (NF) and Noise factor (F) are measures of degradation of the signal-to-noise ratio (SNR), caused by components in a radio frequency (RF) signal chain. It is a number by which the performance of an amplifier or a radio receiver can be specified, with lower values indicating better performance and contributes to the receiver sensitivity.
Noise Figure (NF) is sometimes referred to as Noise Factor (F). The relationship is mentioned as below: NF = 10 * log10 (F)
The noise figure is the difference in decibels (dB) between the noise output of the actual receiver to the noise output of an “ideal” receiver with the same overall gain and bandwidth when the receivers are connected to matched sources at the standard noise temperature T0 (usually 290 K). The noise power from a simple load is equal to k T B, where k is Boltzmann's constant, T is the absolute temperature of the load (for example a resistor), and B is the measurement bandwidth. There are three types of noise figure methods are used. In that Y-Factor method is giving most accurate results.
II. Y-FACTOR METHOD
The Y-factor method is the basis of modern automatic noise figure measurement systems. The technique involves measuring the noise power at the output of a Device under Test (DUT) when two different noise sources are attached to the input of the DUT. The manual form of the Y-factor method is commonly used at microwave and millimeter-wave frequencies above the Intermediate frequency (IF) of automatic systems and also for spot noise figure measurements. The method is dependent on the accuracy of gain measurement, the ability to generate precise levels of excess noise power, and the sensitivity of noise power measurement.
The impact of noise on system performance is quantified by the Signal to Noise Ratio (SNR) where SNR = S / N , S is the signal power, and N is the noise power. Consequently the contribution to noise of a DUT is captured by the noise factor F which is the ratio of the input to the output SNR's:
F = (
S N)in
(SN)out…….(1)
where the subscripts IN and OUT denote the input and output of the DUT respectively. Under matched conditions the available gain of the DUT is
G =(S/N)out
(S/N)in…..(2)
So signal power can be eliminated from the expression for noise factor by combining (1) and (2):
F =Nout
room temperature To (specifically the input noise temperature i s To) and so N D = kT0BG( F – 1)….(4)
In the Y-factor method two noise sources with noise temperatures and T2 are applied to the DUT This leads to the Y-factor, which is defined as Y = N2 / N1 . For one of these noise states an off-condition is generally used where T, = To and so the ‘off power is
N1 =kT,BG+N, =kT,BG+kT,B(F-l)….(5)
The second noise source, with noise temperature q, produces calibrated excess noise and the power under these conditions is called the ‘on’ power:
N2 =kT,BG+N, =kT,BG+kT,B(F-l)…..(6) Combining (4), (5) and (6) yields
F = T1−T0
T0(Y−1)…..(7)
Expressing (8) in decibels and integrating (or measuring) over the system bandwidth yields the Noise Figure NF=10 log(F)=ENRdB-10 log(Y-1)….(8)
III. EXPERIMENTAL SETUP
Noise is the disturbance that interferes with the transmission or information from the sender to receiver. Noise can be divided into two general categories: Correlated and Uncorrelated. These types of noise fall into general categories namely External noise and internal noise. The three primary types of external noises are atmospheric, extraterrestrial, and industrial or manmade. The internal noises are of thermal noise, Shot noise, flicker noise, Burst noise.
In this reach work receiver antenna is used to receive the signal and pass the signals to low noise amplifier that minimizes the noise, present in the system and without disturbing the gain and other parameters. Amplifiers are described according to their input and output properties. They exhibit the property of gain, or multiplication factor that relates the magnitude of the output signal to the input signal. They couple a defined amount of the electromagnetic power in a transmission line to a port enabling the signal to be used in another circuit.
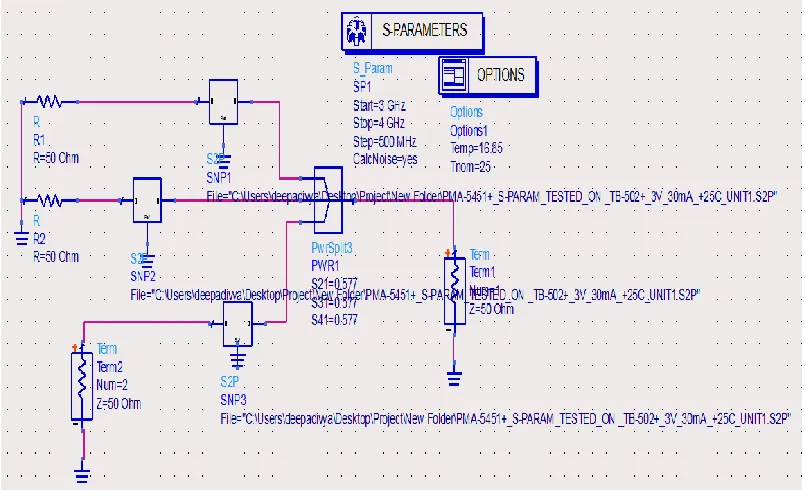
A Low Noise Amplifier (LNA) is a key component, at the front-end of a radio receiver circuit. Low-noise amplifier (LNA) is an electronic amplifier used to amplify very weak signals. An LNA amplifies signals that are barely recognizable without adding a lot of noise, as the name implies. An LNA is usually located close to the signal source in order to reduce losses in the feed-line or minimize interference. LNAs are used in various applications like ISM Radios, Cellular/PCS Handsets, GPS Receivers, CordlessPhones, Wireless ANs, Wireless Data, Automotive RKE, and satellite communications. The power combiner is used to combine the outputs from low noise amplifier.
IV. RESULTS
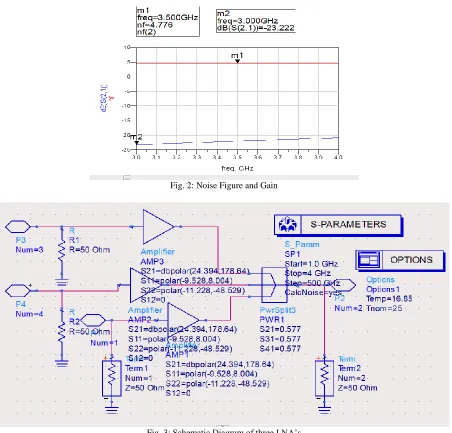
Fig. 2: Noise Figure and Gain
Fig. 3: Schematic Diagram of three LNA’s
In this figure 6 m1 indicates the Noise Figure and m2 indicate the gain.
K.Divya during M.E.(Communication Systems) in Sri Ramakrishna Institute of Technology, Coimbatore. She received her B.E in Electronics and Communication Engineering from Tejaa Shakthi Institute of Technology for Women.
Dr.R.M.S.Parvathi has obtained her doctoral degree in Computer Science and Engineering in the year 2005. She received her B.E in Electronics and Communication Engineering and M.E degree in Computer Science and Engineering from Government College of Technology, Coimbatore. She is having a total teaching experience of 26 years including her service as Principal of in Engineering college for 8 years as founder principal. She has published 64 technical papers in referred journals. So far 14 Reach Scholars got awarded with Ph.D degree under her guidance in Anna University, Chennai. Currently she is working as Professor and Dean PG Studies at Sri Ramakrishna Institute of Technology,Coimbatore.
ACKNOWLEDGMENT
I wish to express my sincere thanks to Mr.C.Jaganathan. Scientist-B, SAMEER-CEM, Chennai and having granted all the facility to do the reach work at SAMEER-CEM, Chennai.
V. CONCLUSION
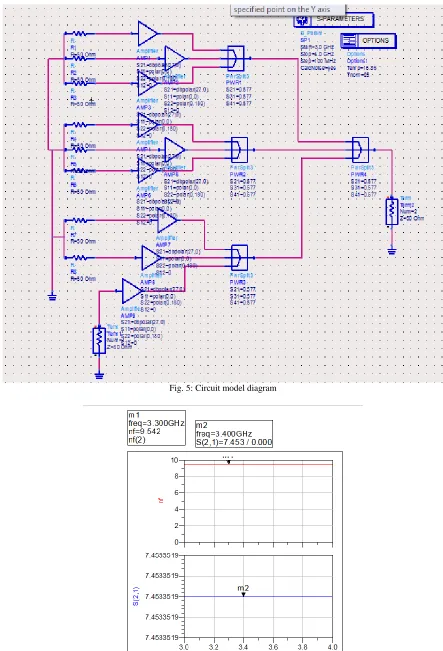
In this reach work, multi-channel receiver Noise Figure is analyzed with different configuration. In each configuration theoretical Noise Figure will be calculated for multi channel receiver and it will be compared with measured results. The theoretical calculation and Simulation in ADS will be done. The general formula for the computation of Noise Figures of the system and channel Noise Figure were derived. The relationship between the system Noise Figure and channel Noise Figure is shown in the figure.
REFERENCES
[1] Alan M.victor, Michael Steer(2005) “ Improved Y Factor Noise Measurement Using the Second Stage Contribution to Advantage” ARFTG conference Digest- Spring 2005.
[2] Chandan Kumar Jha and Nisha Gupta (2012) “Design of a Front End Low Noise Amplifier for Wireless Devices ” ,Consumer Electronics, IEEE transaction 0n vol.47.
[3] Ishaan Biswas, Anup Jyoti Deka(2008)”Design of a 2.3 GHz Low Noise Amplifier for WIMAX applications” IEEE transaction on Microwave theory and techniques, Vol.54.
[4] Junghyun Kim ,Jinho Jeong (2011)” Improvements of Noise Performance in Phased Array Receivers” ETRI Journal April,2011. [5] J. J. Lee (1993)” G/T and Noise Figure of Active Array Antennas” IEEE transaction on Antennas and Propagation vol. 43
[6] Patrik Erikkson and Hannu Tenhunen(1999)”The Noise Figure of a Sampling Mixer: Theory and Measurement” , IEEE solid state Circuits Vol.20. [7] Reena K.Panchal,Harsha Gupta(2015)”Design and Simulation of Low Noise Amplifier at 2.3 GHz Frequency for 4G Technology” IJAREEIE vol.4. [8] Reference Data for Agilent Fundamentals of RF and Microwave Noise Figure Measurements Application Notes 57.
[9] Robert Vincenti Gatti, Marco Dionigi, and Roberto Sorrentino (2004)“Computation of Gain, Noise Figure, and Third-order Intercept of Active array antenna” IEEE transaction on Antennas and Propagation, Vol.52