Item-based recommendation with Shapley value
Tri Minh Huynh
1*and Tai Huu Pham
3and Vu The Tran
2and Hiep Xuan Huynh
31Kien Giang University, Viet Nam
2University of Science and Technology, Da Nang University, Viet Nam 3Can Tho University, Viet Nam
Abstract
Discovering knowledge in archival data is the goal of researchers. One of them is collaborative filtering recommender system is developing fastly today. It may be rather effective in sparse and "long tail" datasets. Calculating to make decision based on many criteria is really necessary. Relationships, interactions between criteria need to have been fully considered, decision will be more reliable and feasible. In this paper, we propose a new approach that builds a recommender decision-making model based on importance of item, set of items with Shapley value. This model also incorporates traditional techniques and some our new approaches and was tested, evaluated on multirecsys tool we develope from some available tools and uses standardized datasets to experiment. Experimental results show that the proposed model is always satisfactory and reliable. They can be applied in appropriate contexts to minimize limitations of recommender system today and is a research way next time.
Keywords: Collaborative Filtering (CF) Recommender System (RS), Multi-Criteria (MC), Interaction, Decision-Making (DM), importance, Shapley.
Received on 18April2019, accepted on 15June2019, published 26June2019
Copyright © 2019Tri Minh Huynhet al., licensed to EAI. This is an open access article distributed under the terms of the Creative Commons Attribution licence (http://creativecommons.org/licenses/by/3.0/), which permits unlimited use, distribution and reproduction in any medium so long as the original work is properly cited.
doi: 10.4108/eai.18-3-2019.159341.
1. Introduction
Nowadays, recommender system (RS) [1] [2] [4] [5] is more and more important in many areas of life. It responds quite well to needs of users about finding information in many forms and diversity variations. Traditional RS often base on historical factors, user preferences to recommend, it is very popular and always used in the past time. Today, the trend is based on the popularity, diversity of data in the system to recommend and be got attention more. That means there are many criteria in the system that are considered to select the desired information. Therefore, multi-criteria collaborative filtering recommender system will service well for this things and be the target to execute because it is very good effective current .
At present, there are many research about decision-making models for multi-criteria recommender system [3][5][6][17][18] is mainly based on collaborative filtering (CF on many criteria because if they only base on one criteria is too phantom to decide a problem, the result may
important to satisfy the user requirements. So the decision-making model based on the criteria will be the good solution chosen by the researchers today. For the multi-criteria collaborative filtering recommender system, the objective is revieing information on the criteria and the number of criteria. Recommendation decisions depend on this information. There are many solutions proposed, but the importance thing for decision making is applicating appropriate operations to give the best results.
Most of the current consulting models do not think much about the relationships and the interaction between the criteria for making decisions. This may make the results of the consultancy unsustainable and don't give yet fully capable of the stored data.
In this paper, we present a solution for decision making in multi-criteria collaborative filtering recommender system based on importance of items in order to have the most appropriate result and in accordance with the requirements and characteristics of storage data. Usually in the intrinsic self of data there is a relationship, influence, reflection on each other, so the model needs to fully consider the interaction of the values of the criteria that *Corresponding author: [email protected]
make the recommendation model becomes more effective. The proposed model is built on multi-criteria collaborative filtering recommender system. The model was experimented on the multirecsys tool developed by us in the R language. The experiment data is standard datasets: the MovieLense, MSWeb and Jester5k. We maked two experiments to test and evaluate the model. The results of the model show that it is quite effective, can exploit information well on some data systems today.
The article is designed into five parts. The first part introduces an overview of the multi-criteria collaborative filtering recommender system, some current approaches. The second part presents about important degree of item. The third part presents about the designing of the multi-criteria collaborative filtering recommender system model and introduces decision making with Shapley operator for recommendation. The fourth part presents some experiment and evaluation of the model on the multirecsys tool. The last part is the conclusions.
2. Important degree of item, a set of items
2.1. Multi-criteria matrix
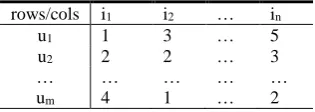
The matrix A (m × n) consists of m rows 𝑢1, 𝑢2, … , 𝑢𝑚 and n columns 𝑖1, 𝑖2, … , 𝑖𝑛. Each row of 𝑢𝑝 (𝑝: 1. . 𝑚) with each column 𝑖𝑞 (𝑞: 1. . 𝑛) determines the value 𝑟𝑝𝑞 as Table 1. Each row is a criterion. In contrast, for 𝑟̂(𝑢, 𝑖), each 𝑟̂𝑞 value is determined based on the set 𝑅𝑞= {𝑟1𝑞, 𝑟2𝑞, … , 𝑟𝑚𝑞} (𝑞: 1. . 𝑛) where 𝑟𝑝𝑞 is the value corresponding to 𝑢𝑝 (𝑝: 1. . 𝑚) and 𝑖𝑞.
Table 1. Multi-criteria matrix: rows and columns
rows/cols i1 i2 … in
u1 1 3 … 5
u2 2 2 … 3
… … … … …
um 4 1 … 2
2.2. Capacity of items
With set of items 𝐼 = {𝑖1, 𝑖2, … , 𝑖𝑛}. A capacity function
𝜇 [7-11] on I is function
𝜇: ℘(𝐼) → [0,1],
with
𝜇(∅) =
0, 𝜇(𝐼) = 1
.
A capacity functioncan be defined
according to a principle or according to the
characteristics or goals of the system when data is
update in the system.
𝐴 ⊆ 𝐵 ⟹ 𝜇(𝐴) ≤ 𝜇(𝐵),
𝐴, 𝐵 ⊆ 𝐼
On I, define a vectơ P with weights, 𝐴 ⊆ 𝐼, a capacity function can be defined as follow:
𝜇(𝐴) = ∑
𝑎∈𝐴𝑃(𝑎)
,
∑
𝑖∈𝐼𝑃(𝑖) = 1, 𝑖 ∈ 𝐼
The value of
𝜇(𝐴)
can be changed depending on the criteria in A. With C1 and C2 is two criteria in A. The value of𝜇(𝐶
1, 𝐶
2)
can get the value as follow:or 𝜇(𝐶1, 𝐶2) = 𝜇(𝐶1) + 𝜇(𝐶2)
or 𝜇(𝐶1, 𝐶2) > 𝜇(𝐶1) + 𝜇(𝐶2)
or 𝜇(𝐶1, 𝐶2) < 𝜇(𝐶1) + 𝜇(𝐶2)
Example: A set has three criteria: Mathematics, Physics, Literature and the values of the capacity of each criterion is:
𝜇({Mathematics}) = 0.35
,
𝜇({Physics}) =
0.30
,𝜇({Literature}) = 0.40
. Thev
alue of the capacity functionof the criteria subset can be given as follow:𝜇({Mathematics, Physics}) = 0.55
,𝜇({Mathematics, Literature}) = 0.85
𝜇({Literature, Physics}) = 0.75
𝜇({Mathematics, Physics, Literature}) = 1
2.3 Interaction and importance degree of
item, importance degree of a set of items
As we presented above, the value of 𝜇(𝐶1, 𝐶2) and 𝜇(𝐶1) + 𝜇(𝐶2) can be different. This shows that there is interaction between 𝐶1 𝑎𝑛𝑑 𝐶2 when they come together. We call interaction degree 𝐼(𝐶1, 𝐶2) between 𝐶1 𝑎𝑛𝑑 𝐶2 is a value in [-1,1]:
𝐼(𝐶1, 𝐶2) = 𝜇(𝐶1, 𝐶2) − (𝜇(𝐶1) + 𝜇(𝐶2)) or 𝜇(𝐶1, 𝐶2) = 𝜇(𝐶1) + 𝜇(𝐶2) + 𝐼(𝐶1, 𝐶2)
If two criteria: 𝐶1, 𝐶2 in a larger set 𝐴 ∪ {𝐶1, 𝐶2} [8]:
𝐼(𝐶1, 𝐶2) = ∑𝐴⊆𝐼\{𝐶1,𝐶2}(𝑛−|𝐴|−2)|𝐴|!𝑛! [𝜇(𝐴 ∪ {𝐶1, 𝐶2}) − (𝜇(𝐴 ∪ {𝐶1}) + 𝜇(𝐴 ∪ {𝐶2})) + 𝜇(𝐴)]
With a capacity function
𝜇, the Shapley value [9 10 11]
based on 𝜇 of𝑖
𝑞∈ 𝐼
is defined by 𝜑𝑖𝑞(𝜇):
𝜑𝑖𝑞(
𝜇
) = ∑(𝑛−|𝐴|−1)!|𝐴|! 𝑛!
𝐴⊆𝐼\{𝑖𝑞} (𝜇(𝐴 ∪ {𝑖𝑞}) − 𝜇(𝐴)) (1)
Here, we determine importance degree of item
𝑖
𝑞depend on the value 𝜑𝑖𝑞(
𝜇
). This value shows importancedegree of item
𝑖
𝑞 in the criteria set which has𝑖
𝑞 in that.
We call item important degree𝑖
𝑞 to be 𝜑𝑖𝑞(𝜇
) and in this model. Thereby, Shapley values also show the interaction between items together in the operation. When calculating the Shapley value of an item, it must be affected by other items.𝜑𝑆⊆𝐼= ∑ 𝜑𝑖𝑞(
𝜇
) 𝑖𝑞∈𝑆(2)
Example: 𝐼𝑛= {𝑖1, 𝑖2, 𝑖3}, n=3, to determine 𝜑𝑖1(
𝜇
), we need to depend on the value of:𝜇({𝑖1, 𝑖2, 𝑖3}), 𝜇({𝑖2, 𝑖3}) are given 𝜇({𝑖1, 𝑖2, 𝑖3}) = 1, 𝜇({𝑖2, 𝑖3}) = 0.55𝜑𝑖1(
𝜇
)=
(𝑛−|{𝑖2,𝑖3}|−1)!|{𝑖2,𝑖3}|!𝑛! (𝜇({𝑖1, 𝑖2, 𝑖3}) − 𝜇({𝑖2, 𝑖3}))
𝜑𝑖1(𝜇)=
0!2!
3! (1 − 0.7)= 0.15
3. Multicriteria decision making with
important degree of item
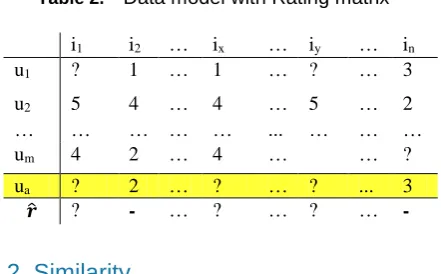
3.1. Rating matrix
Data applies to the model is as a table of values. It represents user's ratings for items. The value which item are not rated will be "?". Here, ua is a consulted user. We need to determine the value of 𝒓̂ function which give the result of the recommender system. That is the list of selected products.
Table 2. Data model with Rating matrix
i1 i2 … ix … iy … in
u1 ? 1 … 1 … ? … 3
u2 5 4 … 4 … 5 … 2
… … … ... … … …
um 4 2 … 4 … … ?
ua ? 2 … ? … ? ... 3
𝒓̂ ? - … ? … ? …
-3.2. Similarity
The model selects items based on collaborative filtering model with k nearest neighbors (kNN) [12]. In Table 2, kNN items are nearest neighbors to item 𝑖𝑞 based on the similarity (or distance) between 𝑖𝑞 (q:1..n) and each item in the system according by measures: cosine, pearson... Each item has weight separately. The Pearson measure [13] between two users are 𝑖𝑥 and 𝑖𝑦 (𝑥, 𝑦 ∶ 1. . n) is defined:
sim(𝑖
𝑥, 𝑖
𝑦) =
∑𝑖∈𝐼𝑖𝑥,𝑖𝑦(𝑟𝑖𝑥𝑖−𝑟̅𝑖𝑥)(𝑟𝑖𝑦𝑖−𝑟̅𝑖𝑦)√∑𝑖∈𝐼𝑖𝑥,𝑖𝑦(𝑟𝑖𝑥𝑖−𝑟̅𝑖𝑥)2√∑𝑖∈𝐼𝑖𝑥,𝑖𝑦(𝑟𝑖𝑦𝑖−𝑟̅𝑖𝑦)2 (3)
𝐼𝑖𝑥,𝑖𝑦 is the set of data items evaluated by 𝑖𝑥, 𝑖𝑥; 𝑟̅𝑖𝑥 is the average rating evaluation of 𝑖𝑥 on all data items, 𝑟̅𝑖𝑦 is the
average rating evaluation of 𝑖𝑦 on all data items. Then, the distance between two users is (1-r).
First, determine the value of the capacity function of each items. After finding the similar values set of each items S (sim), we determine the value of the capacity function
𝜇(𝑖
𝑞𝑡), 𝑘 = 𝑘𝑁𝑁
, it is puted as follow:𝜇(𝑖
𝑞𝑡) = 𝑤
𝑖𝑞𝑡=
𝑠𝑖𝑚(𝑖𝑡,𝑖𝑞)∑𝑘𝑣=1𝑠𝑖𝑚(𝑖𝑣,𝑖𝑞)
,
t from 1 to k. (4) Next, determine 𝜑𝑖𝑞(𝜇
), the important degree of item 𝑖𝑞, we do two steps as below:(a) Determining the value of the capacity function of a set𝜇(𝐴), A is the subset in 𝑆𝑞𝑘, 𝐴 ⊆ 𝑆𝑞𝑘, 𝑆𝑞𝑘 is the set k nearest neighbors items of 𝑖𝑞. We begin determining the
value
of the capacity function of the two items subset, the three items subset,... in A. We define a capacity function of a set of items as follow:𝜇(𝑆𝑞𝑘) = 1
𝜇(𝐴)
=
∑𝐵 ∈𝐴𝜇(𝐵), 𝐵 𝑖𝑠 𝑠𝑢𝑏𝑠𝑒𝑡𝑠 𝑖𝑛 𝐴 (5) 𝜇(𝐴) = 1 𝑖𝑓 𝜇(𝐴) > 1 and B has from two items or more.First, we need
determinate
the two items set. To two items i and j, we put:𝜇(𝑖, 𝑗) = 𝜇(𝑖) + 𝜇(𝑗) + 𝑤′𝑖+ 𝑤′𝑗 (6) 𝜇(𝑖, 𝑗) = 1 𝑖𝑓 𝜇(𝑖, 𝑗) > 1
We call that 𝑤′𝑖+ 𝑤′𝑗 is the interaction value between i
and j in set of 𝜇(𝑖, 𝑗).
To be simple. we put 𝜇(𝑘) = 𝑤𝑖𝑘[𝑘]. With 𝑤𝑖𝑘 is
calculted
by formula:𝑤
𝑖𝑘=
𝑤𝑖𝑠𝑢𝑚(𝑤𝑖)
and 𝑤𝑖= 𝑤[𝑖, 1. . 𝑘], k=kNN (7) We put 𝑤 = 𝑠𝑖𝑚(𝑛 𝑖𝑡𝑒𝑚𝑠) is the similarity values set of all items in system. This set is calculted by formula 2.
Next, we create a weights set w’ from Rating matrix to support the interesting of each item. The formula as above:
𝑤′ =
𝑐𝑜𝑢𝑛𝑡(𝑟𝑎𝑡𝑖𝑛𝑔(𝑖) 𝑖𝑛 [4..5])−𝑐𝑜𝑢𝑛𝑡(𝑟𝑎𝑡𝑖𝑛𝑔(𝑖) 𝑖𝑛 [1..3])𝑛 (8)
With n is a number of items in the system. We only get values in w’ for items in the kNN set of item is ordering (i).
(b) Determining 𝜑𝑖𝑞(
𝜇
):we depend on the fomulas:
(5), (6) and (7).
𝜑𝑖𝑞𝑡(
𝜇
)=
∑(𝑘 − |𝐴| − 1)! |𝐴|! 𝑘!
𝐴⊆𝑆𝑞𝑘\{𝑖𝑞𝑡}
(𝜇(𝐴 ∪ {𝑖𝑞𝑡}) − 𝜇(𝐴))
𝑤𝑖𝑡ℎ 𝑡 𝑖𝑛 [1: 𝑘] (9)
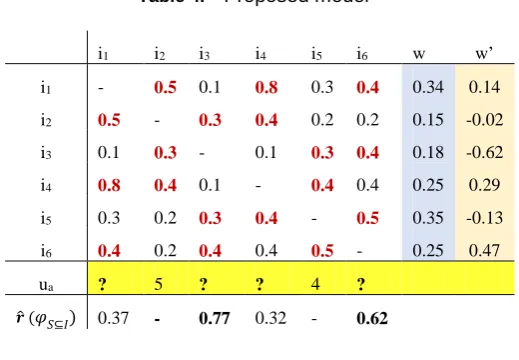
Example: There three items: i1, i2, i3 and the similarity values between item i with these items and weights of item i is w’ in the table above:
Table 3. Item important degree 𝜑𝑖𝑞𝑡(
𝜇
),
𝜑
𝑆⊆𝐼i1 0.23 0.17 0.21 i2 0.12 -0.31 0.05 i3 0.28 0.18 0.26
𝜑{𝑖1𝑖2𝑖3}(
𝜇
) 0.52𝜑𝑖1(
𝜇
)=
(3 − 2 − 1)! 2!
3! (𝜇({𝑖1, 𝑖2, 𝑖3}) − 𝜇({𝑖2, 𝑖3}))
𝜇({𝑖2, 𝑖3}) = 𝜇({𝑖2}) + 𝜇({𝑖3}) + 𝑤′𝑖2+ 𝑤′𝑖3
Put
𝜇({𝑖})= 𝑤
𝑖and w’ is the interaction value of item
join in items set.
𝜇({𝑖1}) = 0.23, 𝜇({𝑖2}) = 0.12, 𝜇({𝑖3}) = 0.28 𝜇({𝑖1, 𝑖2}) = 0.21
𝜇({𝑖2, 𝑖3}) = 0.38 𝜇({𝑖1, 𝑖3}) = 0.86
𝜇({𝑖1, 𝑖2, 𝑖3}) = 𝜇({𝑖1, 𝑖2}) + 𝜇({𝑖1, 𝑖3}) + 𝜇({𝑖2, 𝑖3}) 𝜇({𝑖1, 𝑖2, 𝑖3}) =1.45 →𝜇({𝑖1, 𝑖2, 𝑖3}) = 1
𝜑𝑖1(
𝜇
)= 0.21,
𝜑𝑖2(𝜇
)= 0.5,
𝜑𝑖3(𝜇
)= 0.26
and this model, we calculate
important degree of a set of items is 𝜑{𝑖1𝑖2𝑖3}(𝜇
)= 0.52
3.4. Recommendation model
From Table 2, the model defines a table of similarities between items each orther. Next, the model determine the importance degree of each item based on items that are similarity with it and related factors as described above. This is the main issue for decision making in this paper. The model is shown below. The values of w is deminate by the fomulas: (3), (4), (7). The values of w’ is deminate by the fomula (8).
Table 4. Proposed model
Indentify results of RS
On the basis of development from traditional recommender models [4][5][15][16], first, we determine the similarity between the product 𝑖𝑞 and each product in data, calculate weights w, w’ as above, the results are as Table 4. Next, we calculate the values 𝑟̂𝑞 at 𝑢𝑎𝑞 # "? ". In this model, we put 𝑟̂𝑞 = 𝜑𝑆⊆𝐼, with S is the kNN items set. 𝜑𝑆⊆𝐼 is calculated by formula (2). At each 𝑖q, 𝑞: 1. . 𝑛, we take the similarity values of kNN (k highest values) are k nearest neighbors of 𝑖q to calculate 𝜑𝑖𝑞𝑡(
𝜇
)by formula (9). After defining 𝑟̂𝑞 values, rank these values in descending order, selecting the products corresponding to the high to low values to suggest to user. Suppose we choose two products to introduce to the user 𝑢a: 𝑖3 and 𝑖6; 𝑟̂3= 0.77 𝑎𝑛𝑑 𝑟̂6= 0.62. These are the two products with the highest 𝒓̂ value. With 𝒓̂ has values 𝑟𝑞 is determined by (formula 6).Evaluation recommendations
We evaluate recommendation model by the Receiver Operating Characteristic method (ROC) [5][14]. The method was developed for signal detection and goes back to the Swets model. The ROC-curve is a plot of the system’s probability of detection (also called sensitivity or true positive rate TPR) by the probability of false alarm (also called false positive rate FPR). Evaluation for two systems can compare the size of the area under the ROC-curve, where a bigger area indicates better performance. The values need deminate: True Positives (TP), False Negatives (FN), True Negatives (TN), true Positive Rate (TPR): TPR=TP/(TP + FN), false Positive Rate (FPR): FPR= FP/(FP + TN). Deminate values and display the ROC curve, Recision/Recall to evaluate the effectiveness of models.
4. Experiment
4.1. Datasets used for experiments
The dataset used for experimentation on the proposed model is the MovieLens100K (sparse data) movie is available at http://grouplens.org/datasets/. The Movielens archive of 100,000 reviews performed by 943 users on a total of 1,682 films, each rated at least 20 movies and rated from 1 (bad) to 5 (good). The MSWeb was generated by sampling and processing the logs of www.microsoft.com in one week timeframe, episode stores information about the 98.653 rating made by 32.710 users on the number of 285 website (Vroot) with value of TRUE/1 (binary data). We also experimented on the Jester5k joke book (data is too thick) at address above, episode stores information about the 500,000 rating made by 5,000 users on the
i1 i2 i3 i4 i5 i6 w w’
i1 - 0.5 0.1 0.8 0.3 0.4 0.34 0.14
i2 0.5 - 0.3 0.4 0.2 0.2 0.15 -0.02
i3 0.1 0.3 - 0.1 0.3 0.4 0.18 -0.62
i4 0.8 0.4 0.1 - 0.4 0.4 0.25 0.29
i5 0.3 0.2 0.3 0.4 - 0.5 0.35 -0.13
i6 0.4 0.2 0.4 0.4 0.5 - 0.25 0.47
ua ? 5 ? ? 4 ?
number of 100 jokes, with values from -10 to 10. Each user evaluates at least 36 jokes
4.2. Experimental tools
The model was experimented by multirecsys tool which we built, developed and installed applications on R [www.r-project.org]. We developed this tool based on the RecommenderLab package that researchers also are developing on it. Besides, we also inherited a number of open source tools of the world community that have built and developed. On the RecommenderLab package, we can display the results, calculate the time, evaluate the error and the effectiveness of the model.
4.3. Scenario 1: Experiment the model and
compare it with some existing model
We tested the proposed model (IBCF_Shapley) on two datasets: Movielens100K (too sparse), MSWeb (too sparse and binary data) and Jester5k (too thick), and also on the three these datasets, we compared the results of the counseling with the existing models (IBCF, Random with item-based). Experimental results with kNN=10 gives 5 films on the Movielens100K, 5 websites on the MSWeb and 5 joke books on Jester5k showed that the results have some diffirence values and the results of the proposed model seem no change and change only when the data is updated new, while the result of the other models may change when new variables are restablished in information processing for new every test. The result of three model as follow:
Table 5. Five movies in MovieLense are consulted on three models
IBCF_Shapley IBCF RANDOM
[1,] "GoldenEye (1995)"
[2,] "Four Rooms (1995)"
[3,] "Get Shorty (1995)"
[4,] "Copycat (1995)"
[5,] "Shanghai Triad (Yao
a yao yao dao waipo qiao) (1995)"
[1,] "Boys Life (1995)"
[2,] "Ballad of Narayama,
The (1958)"
[3,] "No Escape (1994)"
[4,] "Turning, The (1992)
[5,] "Celestial Clockwork (1994)"
[1,] "Braveheart (1995)" [2,] "Free Willy 2: The A
dventure Home (1995)"
[3,] "Mad Love (1995)"
[4,] "Clerks (1994)"
[5,] "Crow, The (1994)"
Table 6. Five comics in MSWeb are consulted on three models
IBCF_Shapley IBCF RANDOM
[1,] Knowledge Base
[2,] Microsoft.com Search
[3,] Norway
[4,] Misc
[5,] International IE content
[1,] Office Free Stuff
[2,] Knowledge Base
[3,] isapi
[4,] MS Office Info [5,] NT Server Support
[1,] South Africa
[2,] Softlib
[3,] Turkey
[4,] Internet Service Providers [5,] Works Support
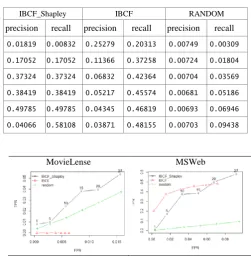
Table 7. The values of precision/recall of three models on MovieLense
IBCF_Shapley IBCF RANDOM
precision recall precision recall precision recall
0.13684 0.01678 0.00699 0.00011 0.03157 0.00215
0.04000 0.01822 0.00139 0.00011 0.04842 0.01326
0.04736 0.03663 0.00069 0.00011 0.02555 0.02555
0.05473 0.05783 0.00093 0.00028 0.03859 0.03542
0.04368 0.06631 0.00104 0.00045 0.03473 0.03871
0.04366 0.07794 0.00089 0.00045 0.04478 0.04478
Table 8. The values of precision/recall of three models on MSWeb
IBCF_Shapley IBCF RANDOM
precision recall precision recall precision recall
0.01819 0.00832 0.25279 0.20313 0.00749 0.00309
0.17052 0.17052 0.11366 0.37258 0.00724 0.01804
0.37324 0.37324 0.06832 0.42364 0.00704 0.03569
0.38419 0.38419 0.05217 0.45574 0.00681 0.05186
0.49785 0.49785 0.04345 0.46819 0.00693 0.06946
0.04066 0.58108 0.03871 0.48155 0.00703 0.09438
MovieLense MSWeb
Figure 1. ROC curve of three models on MovieLense and MSWeb
MovieLense MSWeb
Figure 2. ROC curve of three models on MovieLense and MSWeb
model has a comparison of the number of user's ratings on each items, so there is no meaning for too thick datasets.
Table 9. Five joke books in Jester5k are consulted on three models
IBCF_Shapley IBCF RANDOM
"j71" "j72" "j73" "j74" "j75"
"j85" "j86" "j71" "j81" "j84"
"j71" "j76" "j80" "j83" "j84"
Table 10.The values of precision/recall of three models
IBCF_Shapley IBCF RANDOM
precision recall precision recall precision recall
0.17200 0.00848 0.24649 0.01547 0.17500 0.00892
0.15240 0.04213 0.26372 0.08663 0.05000 0.05000
0.16580 0.09692 0.27160 0.17424 0.17920 0.09772
0.17040 0.15407 0.25654 0.24308 0.17866 0.15271
0.16390 0.19616 0.24079 0.29387 0.18090 0.20203
0.17981 0.28565 0.22985 0.33377 0.17911 0.27030
ROC cure Recision/Recall
Figure 3. ROC curve and Recision/Recall of three models on Jester5k
Based on the ROC Curve and precision/recallof models, they have showed that IBCF_Shapley is given the pretty good result on all datasets. Proposed model always seem has hight effective on sparse datasets more than thick datasets with item-based collaborative filtering, especially with sparse and non-binary datasets. We can fully belive it is applied to the current recommendation system.
4.5. Scenario 2: Experiment to evaluate the
model on two datasets: Movielens100K and
MSWeb with some different kNN values (test
the model with a number of criteria increase)
4.5.1. Experiment to evaluate the model on
two datasets with k=25
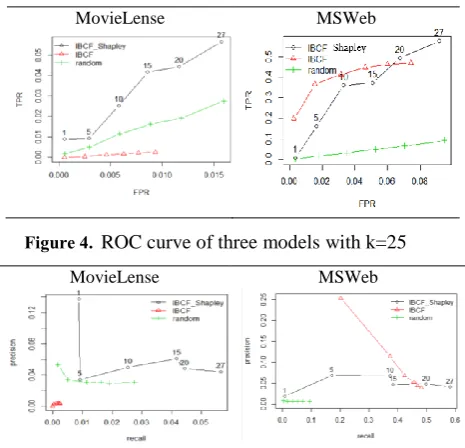
MovieLense MSWeb
Figure 4. ROC curve of three models with k=25
MovieLense MSWeb
Figure 5. Recision/Recall of three models with k=25
4.5.2. Experiment to evaluate the model on
two datasets with k=35
MovieLense MSWeb
Figure 6. ROC curve of three models
MovieLense MSWeb
Figure 7. Recision/Recall of three models
MovieLense MSWeb
Figure 8. ROC curve of three models
MovieLense MSWeb
Figure 9. Recision/Recall of three models
Experimental results with many difference values of k, also show that IBCF_Shapley model always give quite good results and quite effective on all sparse datasets and give the best result on sparse and non-binary datasets.
5. Conclusions
Any recommender model can give a good results if it is placed in the appropriate context and characteristics of the archived data. Our proposal model, item-based collaborative filtering multi-criteria recommender system with Shapley operator was built based on interaction, ability and importance of the criterions in the system. This helps to give the consultant decision to support well the requirements of the counsed user. The model is developed on the basis of traditional consulting systems and exploits tools and datasets on the RecommenderLab package. We set the formulas to calculate capacity fonction. Since then, the value of Shapley is calculated to serve as a consulting decision. We do two main experiments to evaluate the proposed model. The results show that the proposed model satisfies quite well the requirement.
This model shows the coherence, interactions of the criteria, improvement of the results with discrete information, lack of information and mutation of data. The paper provides a method of counseling with the weighting of criteria and get relationship values for decision making. The proposed model can be applied on many datasets and the results will be reliable, especially on sparse dataset and non-binary. Although the execution time of program is still long as lost time to make weighted and interaction values, calculate Shapley value and ordered rankings, but the results are more responsive. In the coming time, we will continue to research and improve the algorithm more to shorten the time of consulting to promote better model.
Acknowledgements.
This model was built and developed on the basis of past studies, inheriting innovative results and tools to implement the model. This helps our new proposal be made easy, saving a lot of effort and time. We always recognize this and will join togetherwith the scientific community to develop research in the future.
References
1. Michael D. Ekstrand, John T. Riedl and Joseph A. Konstan,
Collaborative Filtering Recommender Systems, 2011, Human–Computer Interaction, Vol. 4, No. 2 (2010) 81– 173DOI: 10.1561/1100000009
2. Gediminas Adomavicius, Alexander Tuzhilin, Toward the Next Generation of Recommender Systems: A Survey of the State-of-the-Art and Possible Extensions, IEEE Transactions On Knowledge And Data Engineering, Vol. 17, No. 6, June 2005 3. Tri Huynh Minh, Vu The Tran, Hung Huu Huynh, Hiep
Xuan Huynh, Decision making operations: arithmetic mean, geometric mean, harmonic mean in user-based collaborative filtering of multi-criteria recommender systems, The 6th national scientific conference on information technology and applications in various fields, Da Nang, Viet Nam, 2017. 4. Badrul Sarwar, George Karypis, Joseph Konstan, and John
Riedl, Item-based Collaborative Filtering Recommendation Algorithms, Appears in WWW10, 2001, Hong Kong. 5. Michael Hahsler, Recommenderlab: A Framework for
Developing and Testing Recommendation Algorithms, R package version 0.2-2, 2017,
http://lyle.smu.edu/IDA/recommenderlab
6. Tri Huynh Minh, Vu The Tran, Hung Huu Huynh, Hiep Xuan Huynh, Collaborative filtering recommender system base on the interaction multi-criteria decision with ordered weighted averaging operator, Proceedings of 2018 The 2nd International Conference on Machine Learning and Soft Computing ICMLSC 2018, Vietnam February 2-4, 2018 ACM ISBN: 978-1-4503-6336-5, Pp: 57-61.
7. Eiichiro Takahagi, Lamda Fuzzy Measure Identification Methods using Lamda and Weights, Visiting Fellow, University of Bristol, UK - Until August 2005.
8. Anath Rau Krishnana, Maznah Mat Kasimb, Engku Muhammad Nazri Engku Abu Bakar, A Short Survey on the Usage of Choquet Integral and Its Associated Fuzzy Measure in Multiple Attribute Analysis, International Conference on Computer Science and Computational Intelligence-ICCSCI 2015, Procedia Computer Science 59. 2015, Pp 427 – 434. 9. Michel Grabisch, Christophe Labreuche, Fuzzy measures
and integrals in MCDA. Multiple Criteria Decision Analysis, Kluwer Academic Publishers, pp.563-608, 2004. <halshs-00268985>
10. Michel Grabisch, Ivan Kojadinovic, Patrick Meyer, A review of methods for capacity identification in Choquet integral based multi-attribute utility theory: Applications of the Kappalab R package, European Journal of Operational Research, Elsevier, 2008, 186 (2), pp.766-785.
Statistical Association, HAL Id: hal-01379188 https://hal.archives-ouvertes.fr/hal-01379188v3, 2017 12. László Kozma, [email protected], k Nearest Neighbors
algorithm (kNN), T-61.6020 Special Course in Computer and Information Science, Helsinki University of Technology, 2008.
13. Sung-Hyuk Cha, Comprehensive Survey on Distance, Similarity Measures between Probability Density Functions,
international journal of mathematical models and methods in applied sciences, Issue 4, Volume 1, 2007.
14. Guy Shani and Asela Gunawardana, Evaluating Recommendation Systems, www.Netflix.com, www.amazon.com
15. Sheetal R. Thakare, Multi-Criteria Based Recommender System Scalability Optimization: The Approach Based on Clustering of Users, IJSRD - International Journal for Scientific Research and Development, Vol. 3, Issue 02, 2015. ISSN, online: 2321-0613.
16. Ferdaous Hdioud, Bouchra bouchra Frikh, Brahim Ouhbi,
Criteria Recommender Systems based on Multi-Attribute Decision Making, iiWAS2013, 2-4 December, 2013, Vienna, Austria. Copyright 2013 ACM 978-1-4503-2113-6/13/12.
17. Tri Huynh Minh, Vu The Tran, Hung Huu Huynh, Hiep Xuan Huynh, Solution for Ordered Weighted Averaging Operator for Making in The Interaction Multi-Criteria Decision in User-Based Collaborative Filtering Recommender System, The International Journal of Machine Learning and Computing (IJMLC), Volume 8 Number 4 (Aug. 2018).
18. Tri Huynh Minh, Vu The Tran, Hung Huu Huynh, Hiep Xuan Huynh, Item-Based Collaborative Filtering In The Multi-Criteria Recommender System With Ordered Weighted Averaging Operator On Sparse Datasets, JP Journal of Heat and Mass Transfer, Special Volume, Issue II, Advances in Mechanical System and ICT-convergence, Pp: 183-194, July 2018,