R E S E A R C H A R T I C L E
Open Access
Spatial distribution of leprosy in India: an
ecological study
Kyra H. Grantz
1,2, Winnie Chabaari
3,4, Ramolotja Kagiso Samuel
3,4, Buri Gershom
5, Laura Blum
6,
Lee Worden
7, Sarah Ackley
7, Fengchen Liu
7, Thomas M. Lietman
7,8,9, Alison P. Galvani
10, Lalitha Prajna
11and Travis C. Porco
7,8,9*Abstract
Background: As leprosy elimination becomes an increasingly realistic goal, it is essential to determine the factors that contribute to its persistence. We evaluate social and economic factors as predictors of leprosy annual new case detection rates within India, where the majority of leprosy cases occur.
Methods: We used correlation and linear mixed effect regressions to assess whether poverty, illiteracy, nighttime satellite radiance (an index of development), and other covariates can explain district-wise annual new case detection rate and Grade 2 disability diagnoses.
Results: We find only weak evidence of an association between poverty and annual new case detection rates at the district level, though illiteracy and satellite radiance are statistically significant predictors of leprosy at the district level. We find no evidence of rapid decline over the period 2008–2015 in either new case detection or new Grade 2 disability.
Conclusions: Our findings suggest a somewhat higher rate of leprosy detection, on average, in poorer districts; the overall effect is weak. The divide between leprosy case detection and true incidence of clinical leprosy complicates these results, particularly given that the detection rate is likely disproportionately lower in impoverished settings. Additional information is needed to distinguish the determinants of leprosy case detection and transmission during the elimination epoch.
Keywords: Leprosy, Hansen’s disease, India, Poverty, Spatial
Background
Leprosy (Hansen’s Disease) is caused by a chronic infec-tion byMycobacterium leprae[1–3]. Long stigmatized in many cultures, leprosy is curable today with multidrug therapy [4]. While a concerted global effort to meet the World Health Organization (WHO) goals of elimination has greatly reduced the case burden in recent decades, over 200000 new cases are still reported globally each year [5,6]. Current WHO targets focus on decreasing the rate of new diagnoses with Grade 2 disability, and the reversal of legislation enabling leprosy discrimination [7].
*Correspondence:[email protected]
7Francis I. Proctor Foundation for Research in Ophthalmology, University of California, San Francisco, CA, USA
8Department of Ophthalmology, University of California, San Francisco, CA, USA
Full list of author information is available at the end of the article
In recent years, the majority of new leprosy cases have been reported from just three countries—India, Brazil, and Indonesia. Both historically and currently, risk of lep-rosy infection has been linked to poverty (e.g. [8–13]). This association may arise from a combination of factors, including crowded conditions that facilitate transmission, malnutrition, or other underlying comorbidities. Though leprosy treatment is provided free of charge worldwide, the cost of travel and a lack of awareness of treatment availability may be obstacles associated with poverty to seeking or receiving health care [14].
India is uniquely important in understanding the cur-rent epidemiology of leprosy. India has had substantial success in leprosy control in previous years, but con-tributes over half of all global new case detections, due, in part, to its large population. Leprosy is found in all regions of the country. Furthermore, the decline in ANCDR in recent years appears to have leveled off [15–17]. Previous
work has indicated that leprosy case detection in India was significantly associated with enhanced case finding activ-ity and exhibited evidence of spatial autocorrelation [15], but it is yet unclear what factors may exacerbate leprosy burden. Here, we use publicly available district-level data on reported annual new case detection rates (ANCDR) and Grade 2 disability rates [18,19]. We examine the asso-ciation between these epidemiological outcome variables and poverty, based on other available measures of district wealth and development.
Methods
Data sources Leprosy
The Indian Ministry of Health reports annual new case counts for leprosy for the period 2008–2015 for each district in India (seeSpatial boundaries) [18–32]. In accor-dance with case report data, we define each year as the twelve month period ending March 31. The National Lep-rosy Eradication Program also provides annual estimated populations for each district, the number of new cases of Grade 2 disability (defined by the WHO as visible defor-mity to the hands or feet or severe visual impairment) at the district level, as well as state-level estimates for the fraction of multibacillary cases, the fraction of cases among children, and the fraction with Grade 2 disability at diagnosis.
Census
The 2011 Census of India contains district-level data on illiteracy, unemployment, scheduled caste and scheduled tribe populations, rural population, and poverty [33–37]. In our data set, a poverty index was defined as the absence of a defined set of assets included in the census sur-vey. A household was considered to be impoverished in the absence of ownership of a radio, a TV, a computer (with or without internet access), a mobile phone, land-line, a bicycle, or a motorized two- or four-wheel vehicle (including a scooter or car) [37, 38]. This definition is more restrictive than other economic measures of poverty (which routinely place between 20–30% of the popula-tion in poverty); only about 18% of households meet this criterion of poverty.
Illiteracy is defined as the inability to both read and write in any language; children 6 years old or younger are automatically considered illiterate in the census. An individual is considered unemployed (specifically, a “non-worker”) if he or she did not partake in an econom-ically productive activity in the 12 months preceding the census survey. This includes students, homemakers, children, retirees, and beggars; it does not include sub-sistence farmers or others whose primary activity was producing food for self-consumption. Therefore, unem-ployment here does not necessarily indicate a desire to
work, or an active pursuit of employment. The census also reports the fraction of a district’s population that lives in a rural area (defined as a region not registered as statutory town or municipality, with fewer than 5000 individuals, with greater than 75% of working individuals employed in agriculture, or with population density less than 400 per km2) [33].
The Constitution of India includes provisions for indi-viduals in scheduled castes and scheduled tribes (indige-nous tribal persons). Historically, these two groups experienced higher levels of discrimination, exclusion, and poverty [39]. The Census reports the number of indi-viduals in scheduled castes and in scheduled tribes per district [35, 36], though this was not reported in 84 of the 604 analytic districts (Table1; seeSpatial boundaries, below).
State-level predictors
While we primarily focused on district-level analysis, we examined two possible state-level predictors of leprosy burden, collected from the Centre for Monitoring Indian Economy database [40]. The first, per-capita net domestic product (NDP), is thought to be a more direct measure-ment of community developmeasure-ment and wealth than poverty or other socio-demographic variables. The second, the number of government hospitals in each state, may be related to healthcare availability and accessibility.
Per-capita income
For validation, we compared selected indices of poverty with district-level per-capita income data. Madhya Pradesh, one of India’s largest states, reported per-capita income (held constant relative to 2004–2005 price index, thus adjusting for inflation) from 2008 to 2012 in 45 of its 48 districts [41].
Satellite imagery
Table 1Data sources used in the analysis
Data Units Years available Resolution Number districts Range Source
Annual new case Cases per 10,000 population 8 (2008–2015) District 604 0–13.9 [19,26–32]
detection rate (ANCDR)
Grade 2 Detection Cases per 1,000,000 population 8 (2008–2015) District 604 0–127 [18,20–25]
Grade 2 Fraction Ratio 8 (2008–2015) District 604 0–1 [18–32]
Poverty Ratio 1 (2011) District 604 0.01–0.65 [37]
Illiteracy Ratio 1 (2011) District 604 0.11–0.68 [33]
Unemployment Ratio 1 (2011) District 604 0.33–0.74 [34]
Scheduled Caste Ratio 1 (2011) District 520 0.01–0.98 [35,36]
and Tribe population
Rural population Ratio 1 (2011) District 604 0–1 [33]
Per-capita income Rupees (fixed price)* 5 (2008–2012) District 45 11900–55300 [41]
Visibility – 1 (2013) District 604 3.53–63 [46]
Radiance – 1 (2010/2011) District 604 0–448 [46]
Government Hospitals Hospitals per 10,000 population 4 (2012–2015) State 35 0.04–2.71 [40]
Per-capita net Rupees (fixed price)* 4 (2012–2015) State 35 22600–241000 [40]
domestic product (NDP)
*Relative to 2004-2005 cost index
We computed the radiance divided by the estimated population, yielding a ratio which exhibits outliers (the largest value is approximately 14 times the average value). To minimize the occurrence of potential high-leverage points, we used the rank transformed values as a predictor. Additionally, we calculated a binary low visibility indica-tor, defined as 1 if a district was in the lowest decile of mean visibility index, as well as a similar low radiance indi-cator. No effort was made to identify oil flares or other causes of high illuminance unrelated to socioeconomic development.
Spatial boundaries
There were several rearrangements of state and dis-trict boundaries over the study period. Spatial analy-sis was based on the GADM (Global Administrative Areas) database for administrative boundaries [47], sup-plemented by an updated version for selected jurisdictions [48]. If a district or state was divided into multiple dis-tricts or states during the study period, we combined data from the resulting new districts to estimate what the counts would have been for the old district boundaries, to obtain a longitudinally consistent set of reporting districts and states. Likewise, if two or more regions were merged, the data from these regions was combined throughout the study period into a single analytic district. This pro-cedure yielded 604 analytic districts from 2008–2015 (Table1; [15]).
Program activities
A group of 209 districts were identified as high lep-rosy districts, based on 2010–2011 reports [49], and
these regions were targeted for subsequent enhanced surveillance activities through the National Leprosy Erad-ication Program. As in our previous analysis [15], we entered this list of districts for use as a binary regressor.
Statistical methods Outcomes
The primary outcome variables were the leprosy annual new case detection rates (ANCDR), defined as the number of new cases in a district divided by the estimated popu-lation of the district during that year, and the rate of new
Grade 2 disability per million population (Grade 2 rate). We also explored the heterogeneity in the proportion of reported leprosy cases that displayed Grade 2 disability (Grade 2 fraction).
We computed Spearman’s rho (ρ) correlation coeffi-cients for the outcomes of interest and the potential predictors. We then conducted multivariate linear mixed effects regression [50] of the longitudinal outcomes, using the district- and state-level predictors. All models include a random slope and intercept, year as a fixed effect, and a fixed effect in 2012 and 2013 for each of the 209 enhanced case finding districts mentioned above. Spatial block boot-strap (1000 replicates) helps account for spatial depen-dence and often estimates a conservative confidepen-dence interval [51]. The marginal and conditional R2 values estimate the variability explained by fixed effect predic-tors, and by both fixed and random effects, respectively [52,53]. To improve normality and homoskedasticity, we used the log transformation for the new case detection rates (per 10 000 inhabitants) and the per-capita Grade 2 rate (per million inhabitants), with zeros modeled as 0.5 divided by the district population (as in [15]). All analysis was conducted in R v. 3.2 for MacIntosh (R Foundation for Statistical Computing, Vienna, Austria), using packages sp,maptools,spdep,lmer, andsperrorest.
Results
For 2008, district-level new case detection rates aver-aged 1.06 per 10 000 population (range 0–9.45). By 2015, the average ANCDR had decreased slightly to 0.929 per 10 000 population (range 0–13.6). While some dis-tricts reported no new cases of Grade 2 disability, others reported as many as 1.27 cases per 10 000 population, and in fifteen districts, all newly reported cases presented with Grade 2 disability. There was also substantial heterogene-ity in district-level measures of poverty and development (Table1).
Many of the covariates of interest are highly correlated with leprosy detection rates, with the two measures of Grade 2 disability frequency, and with one another. As expected, increases in ANCDR are associated with higher rates of poverty (Spearmanρ 0.14,P < 0.001), illiteracy (0.20,P< 0.001), unemployment (0.05,P < 0.001), frac-tion of populafrac-tion in rural areas (0.12,P < 0.001) or in scheduled castes and tribes (0.09, P < 0.001), and the fraction of cases reported with Grade 2 disability (0.21,
P < 0.001). The population rate of Grade 2 cases is also associated with poverty (0.09,P <0.001), illiteracy (0.08,
P < 0.001), unemployment (-0.06, P < 0.001), frac-tion of populafrac-tion in rural areas (0.04, P = 0.012) and scheduled castes and tribes (0.11, P < 0.001), and the fraction of cases reported with Grade 2 disability (0.82,
P < 0.001). Grade 2 fraction is significantly, but weakly, negatively associated with illiteracy (-0.05,P = 0.0016),
unemployment (-0.05,P < 0.001), and rural population fraction (-0.07,P < 0.001). Poverty and scheduled caste and tribe population are not significantly associated with the fraction of Grade 2 cases.
The raw radiance variable was strongly negatively asso-ciated with poverty (-0.68, P < 0.001), illiteracy (-0.49,
P < 0.001), rural population (-0.64, P < 0.001), and scheduled caste and tribe populations (-0.40,P <0.001). There was no significant relationship with ANCDR but a weak, positive association with rate of Grade 2 cases (0.12,
P < 0.001). Though other metrics of satellite visibility, including the scaled radiance term and visibility, were sig-nificantly associated with at least one of the three primary outcomes and other covariates, the relationships were weak and inconsistent. We therefore use the unadjusted radiance term in the remainder of our analysis.
District-level predictors in Madhya Pradesh
We compared district-wise per-capita income in the state of Madhya Pradesh to variables under evaluation using the Spearman correlation to assess their utility in estimat-ing economic and social conditions. Per-capita income is significantly positively correlated with satellite radiance (Spearman ρ = 0.57, P < 0.001) in Madhya Pradesh. Per-capita income is also, unsurprisingly, linked to the census-derived index of poverty (ρ =-0.50,P < 0.001), total visibility (ρ =0.59,P<0.001), illiteracy (ρ =- 0.54,
P < 0.001) and rural population (ρ =-0.71,P < 0.001). Per-capita income is not a significant correlate of unem-ployment or scheduled tribe and caste population. We also computed univariate Spearman regressions for the three leprosy outcomes in Madhya Pradesh, but these are small.
District-level analysis of leprosy trends
We first computed nonparametric correlation coefficients of leprosy case detection rates with the poverty index, for every year from 2008–2015. Values ranged from 0.0686 to 0.113 (Holm-adjustedP-values all less than 0.012). For illiteracy, the median of these yearly correlations was 0.141 (Holm-adjustedP-values all less than 7.6×10⁻⁶). For the rural fraction, the median of these yearly correlations was 0.0805 (Holm-adjustedP-values all less than 0.076). Other predictors gave smaller univariate correlations (not reported).
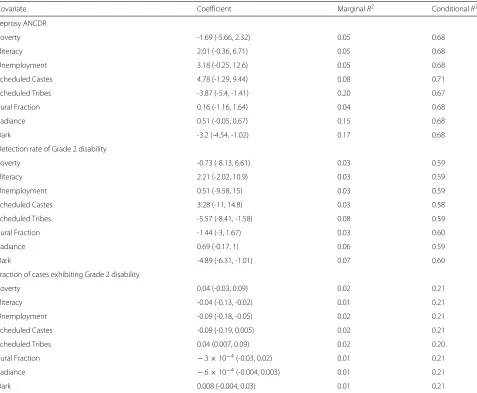
Illiteracy, scheduled tribe population, and radiance (including the binary low visibility indicator) are all inde-pendently significant predictors of district-level annual new case detection rate (Table 2). For the district-level rate of Grade 2 disability, the only statistically significant predictors were the fraction in scheduled tribes and the binary indicator of radiance. The fraction of cases with Grade 2 disability is significantly associated with illiter-acy and unemployment rates, as well as the fraction in scheduled tribes and the binary radiance indicators. While illiteracy is a positive predictor of ANCDR, it is negatively associated with the fraction of cases with Grade 2 disabil-ity. Moreover, while scheduled tribe fraction and radiance are both negatively associated with ANCDR and Grade 2 disability rate, they are positively associated with the frac-tion of Grade 2 cases in each district. We also explored the role of per-capita income as a predictor of leprosy
in Madhya Pradesh, incorporating a temporal dimension and random effect for district, but found non-significant relationships with all three leprosy outcomes.
We then performed multivariate linear mixed effects regression to determine which covariates, in combination, produced the best-fit model (as determined by Akaike’s Information Criterion) (Table 3). We found that illiter-acy, radiance, and time are included in the best models of all three leprosy outcomes. Poverty is included in the models of ANCDR and fraction of Grade 2 cases, while unemployment rate and the fraction of population that is rural are included only in the models of Grade 2 fraction and ANCDR, respectively. The coefficient for time was negative, corresponding to a (slight) decrease in ANCDR from 2008 to 2015; it appears that both the population rate and fraction of Grade 2 cases have been increasing over the same period.
Table 2Regression coefficients for univariate analysis of district-level leprosy outcome variables
Covariate Coefficient MarginalR2 ConditionalR2
Leprosy ANCDR
Poverty -1.69 (-5.66, 2.32) 0.05 0.68
Illiteracy 2.01 (-0.36, 6.71) 0.05 0.68
Unemployment 3.18 (-0.25, 12.6) 0.05 0.68
Scheduled Castes 4.78 (-1.29, 9.44) 0.08 0.71
Scheduled Tribes -3.87 (-5.4, -1.41) 0.20 0.67
Rural Fraction 0.16 (-1.16, 1.64) 0.04 0.68
Radiance 0.51 (-0.05, 0.67) 0.15 0.68
Dark -3.2 (-4.54, -1.02) 0.17 0.68
Detection rate of Grade 2 disability
Poverty -0.73 (-8.13, 6.61) 0.03 0.59
Illiteracy 2.21 (-2.02, 10.9) 0.03 0.59
Unemployment 0.51 (-9.58, 15) 0.03 0.59
Scheduled Castes 3.28 (-11, 14.8) 0.03 0.58
Scheduled Tribes -5.57 (-8.41, -1.58) 0.08 0.59
Rural Fraction -1.44 (-3, 1.67) 0.03 0.60
Radiance 0.69 (-0.17, 1) 0.06 0.59
Dark -4.89 (-6.31, -1.01) 0.07 0.60
Fraction of cases exhibiting Grade 2 disability
Poverty 0.04 (-0.03, 0.09) 0.02 0.21
Illiteracy -0.04 (-0.13, -0.02) 0.01 0.21
Unemployment -0.09 (-0.18, -0.05) 0.02 0.21
Scheduled Castes -0.09 (-0.19, 0.005) 0.02 0.21
Scheduled Tribes 0.04 (0.007, 0.09) 0.02 0.20
Rural Fraction −3×10⁻⁴(-0.03, 0.02) 0.01 0.21
Radiance −6×10⁻⁴(-0.004, 0.003) 0.01 0.21
Dark 0.008 (-0.004, 0.03) 0.01 0.21
Table 3Regression coefficients for univariate analysis of state-level leprosy outcome variables
Outcome ANCDR Grade 2 Rate Grade 2 Fraction
Poverty Index -3.53 (-7.93, 1.12) — 0.06 (-0.002, 0.12)
Illiteracy 4.46 (1.25, 10.3) 4.75 (0.74, 12.8) -0.08 (-0.15, -0.03)
Unemployment — — -0.06 (-0.14, -0.008)
Rural 0.9 (-0.74, 2.14) — —
Scaled radiance 0.01 (0.002, 0.02) 0.03 (0.02, 0.05) 2×10⁻⁴(−2×10⁻⁵, 2×10⁻⁴)
Time -0.04 (-0.07, -0.02) 0.2 (0.09, 0.26) 0.004 (0.002, 0.005)
MarginalR2 0.04 0.01 0.02
ConditionalR2 0.68 0.60 0.21
Models were selected using Akaike Information criterion (AIC) from all subsets of the regressors: poverty index, illiteracy, unemployment, rural population fraction, and scaled radiance (see text for details). All models include calendar time in years, the enhanced case finding covariate, a random slope, and a random intercept. MarginalR2values
indicate the fraction of variance explained by the fixed effects, and conditionalR2indicate the fraction of varianceexplained by both fixed and random effects as described in
the text. Confidence intervals derived by spatial block bootstrap (with a radius of 1.5 degrees); see text for details
State-level analysis
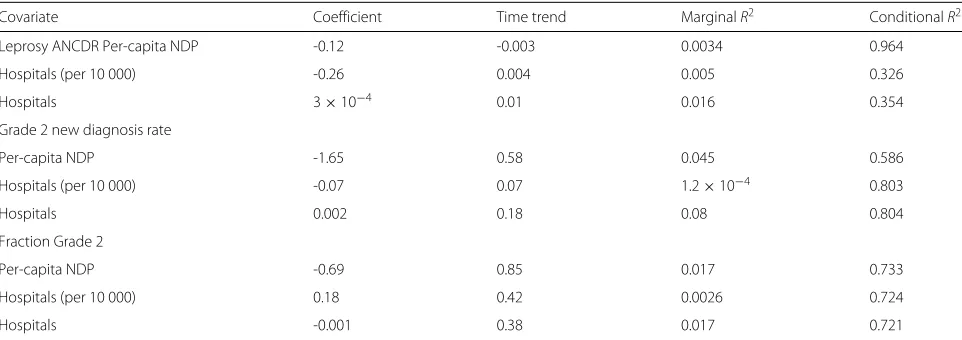
At the state level, neither net domestic product or num-ber of government hospitals (adjusted and unadjusted for population) were significant predictors of ANCDR, Grade 2 disability rate, or Grade 2 disability fraction in univari-ate analysis Table4. Healthcare availability, estimated by the frequency of government hospitals, does not appear to substantially influence reported ANCDR across states.
Discussion
Leprosy incidence has decreased dramatically in recent years, spurred by ambitious WHO goals for elimination and by concerted effort by many of the most affected countries. Nonetheless, uncertainty remains regarding the factors underlying its persistence in certain geographic regions. Here, we examined the role of poverty and other measures of socioeconomic status in explaining variation in the district-level new case detection rates of leprosy
in India. Modest relationships between leprosy annual new case detection rates and a census-derived poverty index of poverty were seen in univariate analysis. Higher rates of illiteracy were associated with a higher ANCDR but a lower fraction of Grade 2 cases; the inverse is true of the scheduled tribe population fraction, which is negatively correlated with ANCDR and Grade 2 detec-tion rate, but positively associated with the fracdetec-tion of Grade 2 cases. Other variables (unemployment, scheduled caste population, rural population) yielded nonsignificant relationships.
The unadjusted radiance term is a significant predic-tor of higher ANCDR in both univariate and multivariate analysis. However, the binary variable indicating whether a district is in the darkest 10% of all districts is signifi-cantly negatively associated with ANCDR. Considerable reporting heterogeneity between states or districts may make rates difficult to compare between regions, and may
Table 4Regression coefficients for univariate analysis of three state-level outcome variables
Covariate Coefficient Time trend MarginalR2 ConditionalR2
Leprosy ANCDR Per-capita NDP -0.12 -0.003 0.0034 0.964
Hospitals (per 10 000) -0.26 0.004 0.005 0.326
Hospitals 3×10⁻⁴ 0.01 0.016 0.354
Grade 2 new diagnosis rate
Per-capita NDP -1.65 0.58 0.045 0.586
Hospitals (per 10 000) -0.07 0.07 1.2×10⁻⁴ 0.803
Hospitals 0.002 0.18 0.08 0.804
Fraction Grade 2
Per-capita NDP -0.69 0.85 0.017 0.733
Hospitals (per 10 000) 0.18 0.42 0.0026 0.724
Hospitals -0.001 0.38 0.017 0.721
We show results for state-level new case detection rates, Grade 2 disability detection rate, and fraction of cases displaying Grade 2 disability. All models include calendar time in years, a random slope, and a random intercept. MarginalR2values indicate the fraction of variance explained by the fixed effects, and conditionalR2indicate the fraction of
be associated with many of the covariates studied here. The poorest districts may have less capacity for detection and surveillance, resulting in lower ANCDRs than would be expected. A number of independent reports have also indicated that leprosy incidence might be considerably higher than reported incidence, and that many cases con-tinue to go undetected by national surveillance systems [16,54,55]. Beyond our finding of a modest decrease in the detection rate of new leprosy cases from 2008–2015 (consistent with a previous study [15]), we also found a slight increase in the rate of detection of Grade 2 cases and the fraction of detected cases presenting with Grade 2 dis-ability. Others have noted a similar increase or stability in the rate and fraction of Grade 2 cases, even in the event of an overall reduction in leprosy burden [56–59].
Those factors that were significantly positively predic-tive of ANCDR were all significant negapredic-tive predictors of the fraction of Grade 2 cases in univariate analysis (Table2). Again, reporting capacity may be a confounding factor. While there could be a true increase in the inci-dence of Grade 2 disability relative to the number of new leprosy cases, it is also possible that districts with higher ANCDR have better surveillance or reporting systems, finding cases before they progress to Grade 2. Conversely, districts with less detection or reporting capacity (and consequently, lower ANCDR) could be more likely to detect mostly severe, Grade 2 cases. Poverty may both increase exposure to conditions favoring the transmission of disease as well as reduce detection and reporting.
Several limitations apply to this analysis. As discussed above, ANCDR does not perfectly reflect true lep-rosy incidence. Moreover, the use of the census-derived poverty index and satellite radiance do not fully char-acterize poverty. While these covariates were strongly correlated with per-capita income in one state, many other aspects of poverty, healthcare availability, and develop-ment status may be important drivers of leprosy persis-tence. Our analysis is also limited due to its ecological nature; from these data, it is impossible to ascertain the relationship between poverty and leprosy within a dis-trict or at an individual-level. Furthermore, several deter-minants of leprosy persistence may be manifested on a geographic scale smaller than that studied here. There is some evidence that leprosy occurs in relatively small spa-tial clusters (even within districts) [17, 59–61]. Analysis at a finer spatial scale may be needed to more definitively identify the key drivers of leprosy transmission and case detection.
Conclusion
We found evidence of a modest relationship between poverty and leprosy at the district level for India, in the context of a slowly declining incidence. Our results also emphasize the role of surveillance capacity in the
detection, treatment, and prevention of leprosy cases— indeed, a large scale population-based detection campaign has been recently undertaken across endemic districts [62]. More information at the individual level, from cross-sectional population-based surveys and assess-ment of surveillance capacity, is needed to understand the relationship between poverty and leprosy, and to overcome poverty and stigma as obstacles to leprosy elimination.
Acknowledgements
Not applicable.
Funding
KHG, WC, RKS, BG, and TCP acknowledge support from the Meaningful Modeling of Epidemiological Data (MMED) program, a NIH-funded joint initiative under the University of Florida, the South African Centre for Epidemiological Modelling and Analysis (SACEMA), and the African Institute for Mathematical Sciences (AIMS) (NIH NIGMS R25GM102149 to J.R.C. Pulliam and A. Welte.). LW, TML, AG, and TCP acknowledge funding of the NTD Modelling Consortium by Novartis Foundation. The views, opinions, assumptions and conclusions or any other information set out in this article are solely those of the authors and not of Novartis Foundation. Novartis Foundation was not involved in the establishment of this article and this article should not be attributed to Novartis Foundation or any person connected with Novartis Foundation. TCP acknowledges support from the US NIH NIGMS MIDAS program, U01-GM087728. AG acknowledges support from US NIH NIGMS MIDAS award U01-GM087719.
Availability of data and materials
All data are available in the citations.
Authors’ contributions
All authors contributed to data acquisition, analysis, and writing. All authors read and approved the final manuscript.
Ethics approval and consent to participate
Not applicable; only deidentified publicly available data were used in this study.
Consent for publication
Not applicable.
Competing interests
The authors declare that they have no competing interests.
Author details
1Department of Biology, University of Florida, Gainesville, FL, USA.2Emerging
Pathogens Institute, University of Florida, Gainesville, FL, USA.3DST/NRF Center for Excellence in Epidemiological Modeling and Analysis (SACEMA), Stellenbosch, South Africa.4Stellenbosch University, Stellenbosch, South Africa.5African Institute of Mathematical Sciences, Muizenberg, South Africa. 6University of California, Berkeley, CA, USA.7Francis I. Proctor Foundation for
Research in Ophthalmology, University of California, San Francisco, CA, USA.
8Department of Ophthalmology, University of California, San Francisco, CA,
USA.9Department of Epidemiology and Biostatistics, University of California,
San Francisco, CA, USA.10Yale University, New Haven, CT, USA.11Aravind Eye Hospital, Madurai, Tamil Nadu, India.
Received: 7 September 2017 Accepted: 7 March 2018
References
1. Vogelsang TM. Gerhard Henrik Armauer Hansen 1841–1912. The discoverer of the leprosy bacillus. His life and his work. Int J Leprosy Other Mycobact Dis. 1978;46(3–4):257–332.
2. Hansen GHA. Undersøgelser Angående Spedalskhedens årsager. Norsk Magazin for Laegervidenskaben. 1874;4:1–88.
J Dermatol. 2012;39(2):121–9.https://doi.org/10.1111/j.1346-8138.2011. 01370.x.
4. World Health Organization. Report of the tenth meeting of the WHO Technical Advisory Group on leprosy control. Technical Report SEA-GLP-2009.5. New Delhi; 2009.
5. World Health Organization. Towards elimination of leprosy. Technical Report WHO/CTD/LEP/91.1. Geneva; 1991.
6. World Health Organization. Global leprosy update, 2014: need for early case detection. Wkly Epidemiol Rec. 36(90):461–74.
7. World Health Organization. Global Leprosy Strategy 2016–2020. Accelerating Towards a Leprosy-free World. New Delhi: WHO South-East Asia Regional Office; 2016.
8. Burns JN. The incidence of cholera and leprosy in relation to damp soil, insanitary conditions, and poverty. British Med J. 1893;1(1690):1085. 9. Badger F. Epidemiology. In: Cochrane RG, editor. Leprosy in Theory and
Practice. Bristol: John Wright and Sons; 1959. p. 51–77.
10. Ganapati R, Revankar CR, Dongre VV. Prevalence of leprosy in slums in bombay including a leprosy colony. Indian J Leprosy. 1985;57:383–8. 11. Ponnighaus JM, Fine PE, Sterne JA, Malema SS, Bliss L, Wilson RJ.
Extended schooling and good housing conditions are associated with reduced risk of leprosy in rural Malawi. Int J Lepr Other Mycobact Dis. 1994;62(3):345–52.
12. Lockwood DN. Commentary: leprosy and poverty. Int J Epidemiol. 2004;33(2):269–70.
13. Kerr-Pontes LR, Montenegro AC, Barreto ML, Werneck GL, Feldmeier H. Inequality and leprosy in northeast Brazil: an ecological study. Int J Epidemiol. 2004;33(2):262–9.
14. Meshram II, Arlappa N, Balakrishna N, Laxmaiah A, Mallikarjun Rao K, Gal Reddy C, Ravindranath M, Sharad Kumar S, Brahmam GNV. Prevalence and determinants of undernutrition and its trends among pre-school tribal children of Maharashtra State, India. J Tropical Pediatr. 2012;58:125–32.
15. Brook CB, Beauclair R, Ngwenya O, Worden L, Ndeffo-Mbah M, Lietman TM, Satpathy SK, Galvani AP, Porco TC. Spatial heterogeneity in projected leprosy trends in India. Parasites Vectors. 2015;8:542. 16. Kumar A, Girdhar A, Chakma JK. Increase of leprosy cases in Firozabad
District of India—a two time cross-sectional survey. Br J Dermatol. 2017;176(2):520–2.https://doi.org/10.1111/bjd.14823. Epub 2016 Dec 22. 17. Kuruwa S, Joshua V. Trends and spatial clustering of leprosy cases over a
decade in a hyper-endemic area of western Maharashtra, India. Leprosy Rev. 2016;87:294–304.
18. National Leprosy Eradication Programme. Monthly progress report for the year 2014–15. Technical report. 2015.http://nlep.nic.in/pdf/Progress %20report%2031st%20March%202013-14.pdf. Accessed 29 Aug 2015. 19. National Leprosy Elimination Programme. District wise annual new case
detection and prevalence as on March 2015. Technical report. 2015. http://nlep.nic.in/pdf/District%20wise%20ANCDR.pdf. Accessed 29 Aug 2015.
20. Central Leprosy Division, Directorate General of Health Services: NLEP—Progress report for the year 2008–09 ending on 31st March 2009. Technical report. 2009.http://nlep.nic.in/pdf/ProgressReport31March 2008-09.pdf. Accessed 29 Aug 2015.
21. Central Leprosy Division, Directorate General of Health Services: NLEP—Progress report for the year 2009–10 ending on 31st March 2010. Technical report. 2010.http://nlep.nic.in/pdf/ProgressReport31March 2009-10.pdf. Accessed 29 August 2015.
22. Central Leprosy Division, Directorates General of Health Services: NLEP—Progress report for the year 2010–11 ending on 31st March 2011. Technical report. 2011.http://nlep.nic.in/pdf/ProgressReport2010-11.pdf. Accessed 29 Aug 2015.
23. Central Leprosy Division, Directorate General of Health Services: NLEP—Progress report for the year 2011–12. Technical report. 2012. http://nlep.nic.in/pdf/Progress%20report%2031st%20March%202011-12. pdf. Accessed 29 Aug 2015.
24. Central Leprosy Division, Directorate General of Health Services: NLEP—Progress report for the year 2012–13. Technical report. 2013. http://nlep.nic.in/pdf/Progress%20report%2031st%20March%202012-13. pdf. Accessed 29 Aug 2015.
25. Central Leprosy Division, Directorate General of Health Services: NLEP—Progress report for the year 2013–14. Technical report. 2014.
http://nlep.nic.in/pdf/Progress%20report%2031st%20March%202013-14. pdf. Accessed 29 Aug 2015.
26. National Leprosy Elimination Programme. District wise annual new case detection and prevalence as on March 2008. Technical report. 2008. http://nlep.nic.in/pdf/AnnualNCDR&PR2008.pdf. Accessed 29 Aug 2015. 27. National Leprosy Elimination Programme. District wise annual new case
detection and prevalence as on March 2009. Technical report. 2009. http://nlep.nic.in/pdf/DisttwiseNCDR-Mar.2009.pdf. Accessed 29 Aug 2015.
28. National Leprosy Elimination Programme. District wise annual new case detection and prevalence as on March 2010. Technical report. 2010. http://nlep.nic.in/pdf/Dist-PR-2010.pdf. Accessed 29 Aug 2015. 29. National Leprosy Elimination Programme. District wise annual new case
detection and prevalence as on March 2011. Technical report. 2011. http://nlep.nic.in/pdf/Dist-PR-2011.pdf. Accessed 29 Aug 2015. 30. National Leprosy Elimination Programme. District wise annual new case
detection and prevalence as on March 2012. Technical report. 2012. http://nlep.nic.in/pdf/Dist-PR-2012.pdf. Accessed 29 Aug 2015. 31. National Leprosy Elimination Programme. District wise annual new case
detection and prevalence as on March 2013. Technical report. 2013. http://nlep.nic.in/pdf/DisttwiseNCDR-Mar.2013.pdf. Accessed 29 Aug 2015.
32. National Leprosy Elimination Programme. District wise annual new case detection and prevalence as on March 2014. Technical report. 2014. http://nlep.nic.in/pdf/District%20wise%20ANCDR.pdf. Accessed 29 Aug 2015.
33. Government of India, Ministry of Home Affairs, Office of the Registrar General & Census Commissioner, India: C-08 Educational Level by Age and Sex for Population Age 7 and Above.http://www.censusindia.gov.in/ 2011census/C-series/C08.html. Accessed 18 Aug 2016.
34. Government of India, Ministry of Home Affairs, Office of the Registrar General & Census Commissioner, India: B-15 Non-workers by Main Activity, Educational Level, and Sex.http://www.censusindia.gov.in/ 2011census/B-series/B-15.html. Accessed 18 Aug 2016.
35. Government of India, Ministry of Home Affairs, Office of the Registrar General & Census Commissioner, India.http://PrimaryCensusAbstractData forScheduledCastes(SC)(India&States/UTs—DistrictLevel). Accessed 12 Sept 2016.
36. Government of India, Ministry of Home Affairs, Office of the Registrar General & Census Commissioner, India.http://PrimaryCensusAbstractData forScheduledCastes(ST)(India&States/UTs—DistrictLevel). Accessed 12 Sept 2016.
37. Government of India, Ministry of Home Affairs, Office of the Registrar General & Census Commissioner, India: HH-12 Number Of Households Availing Banking Services And Number Of Households Having Each Of The Specified Assets. http://www.censusindia.gov.in/2011census/Hlo-series/HH12.html. Accessed 1 Aug 2015.
38. Celestine A. What would a poverty map of India look like? 2013. http://datastories.in/blog/2013/04/09/what-would-a-poverty-map-of-india-look-like/. Accessed Feb 12 2016.
39. Gang IN, Sen K, Yun M. Poverty in rural India: caste and tribe. Rev Income Wealth. 2008;54:50–70.
40. Centre for Monitoring Indian Economy Pvt. Ltd. States of India. http://statesofindia.cmie.com/. Accessed 15 Sept 2016. 41. Madhya Pradesh Planning, Economics and Statistics Department:
Economic Survey of Madhya Pradesh 2013 and 2014.https://data.gov.in/ catalog/district-wise-capita-income-constant-2004-2005-prices. Accessed 26 Aug 2016.
42. Ghosh T, Powell RL, Anderson S, Sutton PC, Elvidge CD. Informal economy and remittance estimates of India using nighttime imagery. Int J Ecol Econ Stat. 2010;17:10.
43. Ghosh T, Anderson SJ, Elvidge CD, Sutton PC. Using nighttime satellite imagery as a proxy measure of human well-being. Sustainability. 2013;5: 4988–5019.
44. Mellander C, Lobo J, Stolarick K, Matheson Z. Night-time light data: a good proxy measure for economic activity? PLoS ONE. 2015;10:1–18. 45. Elvidge CD, Baugh KE, Hobson VR, Kihn EA, Kroehl HW, Davis ER,
46. National Oceanic and Atmospheric Administration USA. Version 4 DMSP-OLS nighttime lights time series.http://ngdc.noaa.gov/eog/dmsp/ downloadV4composites.html. Accessed 16 Sept 2016.
47. Global Administrative Areas. Global Administrative Areas. 2015.http:// www.gadm.org/. Accessed 1 Aug 2015.
48. Datameet. Datameet. 2015.https://github.com/datameet/maps.git. Accessed Aug 1 2015.
49. Directorate of General Services, Ministry of Health and Family Welfare, G.o.I. Programme Implementation Plan (PIP) for 12th Plan Period. 2011. http://nlep.nic.in/pdf/Final%20PIP,on%203%20May%202013.pdf. 50. West BT, Welch KB, Gałecki AT. Linear Mixed Models. A Practical Guide
Using Statistical Software, 2d ed. Boca Raton: Chapman and Hall/CRC; 2014.
51. Brenning A. Spatial cross-validation and bootstrap for the assessment of prediction rules in remote sensing: the R package ‘sperrorest’. In: 2012 IEEE International Geoscience and Remote Sensing Symposium (IGARSS), 23-27 July 2012. 2012. p. 5372–5.https://doi.org/10.1109/IGARSS.2012. 6352393.
52. Johnson PCD. Extension of Nakagawa & Schielzeth’sR2GLMMto random
slopes models. Methods Ecol Evol. 2014;5:944–6.
53. Nakagawa S, Schielzeth H. A general and simple method for obtainingR2 from generalized linear mixed-effects models. Methods Ecol Evol. 2013;4(2):133–42.
54. Shukla LK, Patel RN, Patel SV, Baxi RK. Evaluation of the effect of block level awareness campaign on performance indicators of National Leprosy Elimination Program in Vadodara district, Gujarat, India. Indian J Dermatol Venereol Leprology. 2015;81(3):257–62.
55. Kumar A, Girdhar A, Chakma JK, Girdhar BK. Detection of previously undetected leprosy cases in Firozabad District (U.P), India during 2006–2009: a short communication. Leprosy Rev. 2013;84(2):124–7. 56. Pandey A. Current perspectives on leprosy as a public health challenge in
India. Res Reports Tropical Med. 2015;2015:643–8.
57. Chaptini C, Marshman G. Leprosy: a review on elimination, reducing the disease burden, and future research. Lepr Rev. 2015;86(4):307–15. 58. Freitasand LRS, Duarte EC, Garcia LP. Trends of main indicators of leprosy
in Brazilian municipalities with high risk of leprosy transmission, 2001–2012. BMC Infect Dis. 2016;16(1):472.
59. Ramos ACV, Yamamura M, Arroyo LH, Popolin MP, Chiaravalloti Neto F, Palha PF, Uchoa SA, Pieri FM, Pinto IC, Fiorati RC, de Queiroz AA, Belchior A, dos Santos DT, Garcia MC, Crispim J, Alves LS, Berra TZ, Arcêncio RA. Spatial clustering and local risk of leprosy in São Paulo, Brazil. PLOS Negl Tropical Dis. 2017;11(2):0005381.
60. Nicchio MVC, Araujo S, Martins LC, Pinheiro AV, Pereira DC, Borges A, Antunes DE, Barreto JG, Goulart IMB. Spatial and temporal epidemiology ofMycobacterium lepraeinfection among leprosy patients and household contacts of an endemic region in Southeast Brazil. Acta Tropica. 2016;163: 38–45.
61. Barreto JG, Bisanzio D, Guimarães L, Spencer JS, Vazquez-Prokopec GM, Kitron U, Salgado CG. Spatial Analysis Spotlighting Early Childhood Leprosy Transmission in a Hyperendemic Municipality of the Brazilian Amazon Region. PLoS Negl Trop Dis. 2014;8(2):2665.
62. Thangaraju P, Venkatesan S, Ali MKS. Leprosy case detection campaign (LCDC) for active surveillance. Trop Dr. 2017;1:49475517702059.
• We accept pre-submission inquiries
• Our selector tool helps you to find the most relevant journal • We provide round the clock customer support
• Convenient online submission • Thorough peer review
• Inclusion in PubMed and all major indexing services • Maximum visibility for your research
Submit your manuscript at www.biomedcentral.com/submit