Journal Homepage: www.jitecs.ub.ac.id
Prediction of Rainfall using Simplified Deep Learning
based Extreme Learning Machines
Imam Cholissodin1, Sutrisno2
1,2Faculty of Computer Science, Computer Science, Brawijaya University, Malang, Indonesia
*Corresponding author, {1imamcs*, 2trisno}@ub.ac.id
Received: 12 August 2018; Accepted: 28 October 2018
Abstract. Prediction of rainfall is needed by every farmer to determine the planting period or for an institution, eg agriculture ministry in the form of plant calendars. BMKG is one of the national agency in Indonesia that doing research in the field of meteorology, climatology, and geophysics in Indonesia using several methods in predicting rainfall. However, the accuracy of predicted results from BMKG methods is still less than optimal, causing the accuracy of the planting calendar to only reach 50% for the entire territory of Indonesia. The reason is because of the dynamics of atmospheric patterns (such as sea-level temperatures and tropical cyclones) in Indonesia are uncertain and there are weaknesses in each method used by BMKG. Another popular method used for rainfall prediction is the Deep Learning (DL) and Extreme Learning Machine (ELM) included in the Neural Network (NN). ELM has a simpler structure, and non-linear approach capability and better convergence speed from Back Propagation (BP). Unfortunately, Deep Learning method is very complex, if not using the process of simplification, and can be said more complex than the BP. In this study, the prediction system was made using ELM-based Simplified Deep Learning to determine the exact regression equation model according to the number of layers in the hidden node. It is expected that the results of this study will be able to form optimal prediction model.
Keywords: prediction, rainfall, ELM, simplified deep learning
1
Introduction
One of the regions in East Java Province which has high production level in agriculture and plantation sector is Malang Regency. Unfortunately, both sectors are vulnerable to crop failures when they enter rainy season with high rainfall (above 300 mm per month) and when entering the dry season with low rainfall (below 100 mm per month) [1][2]. So far, the efforts made by farmers to overcome this is just a reactive effort such as harvesting early. This effort is quite effective in reducing the magnitude of the loss, but it should be done proactively so that the failed harvest no longer occurs [3].
Imam Cholissodin et al., Prediction of Rainfall using Simplified Deep Learning .. 121
[6]. Some of the rainfall prediction methods that are often used by BMKG are Adaptive Neuro-Fuzzy Inference Systems (ANFIS) [7], wavelet transformation [8], and Autoregressive Integrated Moving Average (ARIMA) [9]. But the accuracy of some of the predicted methods mentioned above, BMKG said still not good about 70%.
In addition to the method often used BMKG. In this research proposed another popular method used for rainfall prediction is Deep Learning (DL) which is part of Neural Network (NN). However existing DL with backpropagation (BP) has a very high time of computing, so it is necessary to use another technique that can accelerate the learning speed DL without BP. Extreme Learning Machines (ELM) has a simpler structure, as well as non-linear approach capability and better convergence speed than BP [10][11][12]. So it’s suitable for use in Deep Learning [13][14]. The result of combining this method gives better performance than the conventional Deep Learning method. Therefore, in this research proposed method of Simplified Deep Learning-Based Extreme Learning Machine for rainfall prediction in Malang Regency in hopes can give more accurate rainfall result.
2
Method
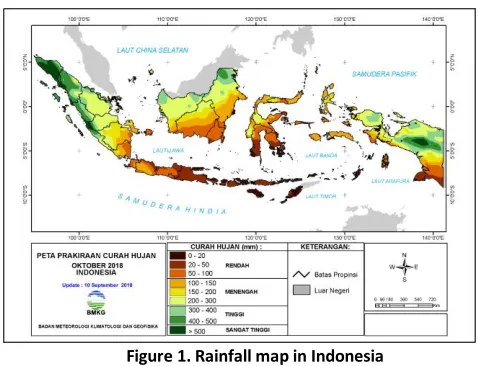
2.1 RainfallRainfall is the height of rainwater that collected in a place, non-flowing, non-volatile, and non-permeable. The unit of rainfall is millimeters (mm). One millimeter of rainfall means in one square meter in a flat place, collected water one millimeter or one liter [15]. Rainfall can be measured in various time periods. Short-term rainfall (hourly and day-to-day) is measured by the Meteorological Station, while the long-term (per 10 daily and per month) is measured by the Climatology Station. The Annual rainfall in Indonesia is shown in Fig. 1.
Figure 1. Rainfall map in Indonesia (https://www.bmkg.go.id/?lang=EN)
2.2 Predictions
distinguish between prediction and forecasting). And usually predictions are used to make short-term forecasts, while forecasting for the long term [16].
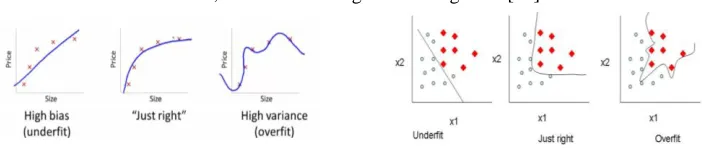
Figure 2. Example visualization of regression vs. classification
There are several approaches to prediction or forecasting, to build features as data patterns, for example on the exchange rate, ie [17][18]:
1.
Technical Analysis Involve exchange rate historical data to forecast future value.
The principle usually used by the technicalists, that the exchange rate has become a representative value of all relevant information affecting the exchange rate, the exchange rate will persist in a certain trend, and the exchange rate is a repetitive value repeatedly from the previous pattern. But sometimes forecasting by technical analysis (technical forecasting)
isn’t very helpful for long periods of time. Many researchers differ in opinion on the concept of that, whether to always use technical forecasting or not, although in general application in many cases, technical forecasting gives a good consistency.
Example:
Initial data (Exchange rate data of IDR-USD in July 2015): Date Exchange rate
5-Jul-15 13338 6-Jul-15 13356 7-Jul-15 13332 8-Jul-15 13331 9-Jul-15 13337
.. ..
16-Jul-15 13309
The extraction results from initial data become, eg 2 data with 3 features (by technical analysis):
No X1
(3 days ago)
X2 (2 days ago)
X3 (1 day ago)
Y (target)
1 13338 13356 13332 13331
2 13356 13332 13331 13337
2.
Fundamental Analysis Based on the fundamental relationship between economic variables to the exchange rate, such as factors that affect the exchange rate, namely: Inflation rate (INF)
Interest rates (INR)
Imam Cholissodin et al., Prediction of Rainfall using Simplified Deep Learning .. 123
Public Debt (PD)
Ratio of Export Price and Import Price (REI), and Stability of Politics and Economics (SPE) Example:
The extraction results from initial data become, eg 2 data with 6 fundamental features (by fundamental analysis):
No X1
(INF)
X2 (INR)
.. X6
(SPE)
Y (target)
1 .. .. .. .. 13338
2 . . .. .. 13356
2.3 Propose Method 1st: Modified feature extraction for each data of datasets like a time series or vector type to image matrix
Modified feature extraction for time series or vector data type to preprocessing data, so that data can be processed into the deep learning algorithm. There are several approaches to modified feature extraction, ie:
1.
Repmat technique The data vector (only features value) is repeated as much as the number of features, so it becomes a square matrix with size [num_of_features x num_of_features].
Example: Initial data:
No X1
(3 days ago)
X2 (2 days ago)
X3 (1 day ago)
Y (target)
1 13338 13356 13332 13331
The extraction results from initial data:
No image matrix: a square matrix with size [num_of_features x num_of_features]
Y (target)
1
13338 13356 13332 13338 13356 13332 13338 13356 13332
13331
2.
invS, and Spiral technique The data vector (only features value) arranged following the pattern of the letter invS/Spiral on the square matrix with the size [num_of_features x num_of_features].
13338 13356 13332
13338 13356 13332
13338 13356 13332
13338 13356 13332
13338 13356 13332
Example:
The extraction results invS from initial data:
No image matrix: a square matrix with size [num_of_features x num_of_features]
Y (target)
1
13338 13356 13332 13332 13356 13338 13338 13356 13332
13331
The extraction results Spiral from initial data:
No image matrix: a square matrix with size [num_of_features x num_of_features]
Y (target)
1
13332 13356 13332 13356 13338 13338 13338 13332 13356
13331
3.
Custom technique The data vector (only features value) arranged following the pattern based set by user on the square matrix with the size [num_of_features x num_of_features] or on the specific matrix size.
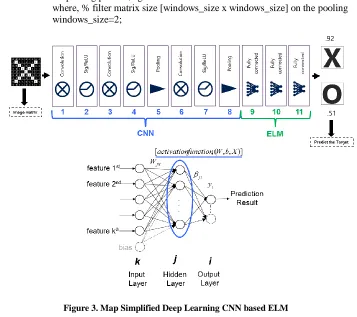
2.4 Propose Method 2nd: Simplified Deep Learning based ELM
The Simplified Deep Learning based ELM (SDL-ELM) combines the performance of feature abstractions from convolution neural network (CNN) and training speeds of the Extreme Learning Machines. In Figure 3, the structure of the SDL-ELM consists of an input layer, an output layer and several hidden layers arranged as a single unity convolution layer, followed by a pooling layer. The amount of convolution and pooling layer, depends on the complexity of the case. Convolution layer consists of several groups of feature and pooling layer consists like a summary of several groups of feature [19][20]. Here are the detailed steps of SDL-ELM:
1.
Create relevant map SDL-ELM (it's designed by the user) by combining Convolution, Sig/ReLU, Pooling, and Fully Connected process, as in the Fig. 3.2.
Set Parameter value.a. To normalization process of the feature value, eg: maxActual (mac) = 300; minActual (mic) = 0; maxNorm (mao) = 1; minNorm (mio) = 0;
Imam Cholissodin et al., Prediction of Rainfall using Simplified Deep Learning .. 125
numFilter = 3; and, % number of padding (k), filter matrix size (k x k) on the convolution
k = 3;
c. To pooling process, eg:
where, % filter matrix size [windows_size x windows_size] on the pooling windows_size=2;
Figure 3. Map Simplified Deep Learning CNN based ELM
3.
Training Process a. Preprocessing[numData,...
numFeature,target,norm]=FnPreProses('datatrainForcast.xlsx',... mac, mic, mao, mio);
o 1. Load data training, get numData and numFeature.
o 2. Create “image matrix” to each single data (only features value) from dataset, eg using Repmat technique.
o 3. Normalization of all "image matrix" data.
norm{i}=(((a{i}-mic)./(mac-mic))*(mao-mio))+mio;
where a{i} is each element matrix data i-th, and norm{i} define a matrix with size [numFeature x numFeature], eg
hC=FnConvDL(norm,numData,k);
if k=3, then expand edge norm image matrix (padding) with zero value as much as pad_size = (k-1)/2 = (3-1)/2=1, where k is odd number ≥ 3. For example,
where the size of the green box is [k x k]
the result of filter 1st: average filter
the result of filter 2nd: max filter
the result of filter 3rd: std filter
o 2. Sigmoid/ReLU
hA=FnSigDL(hC,numFilter,numData);
For example using the activation function sigmoid:
hA{1}{1}1,1 = 1/(1+exp(-hC{1}{1}1,1)) (1) o 3. Convolution In.
hC=FnConvInDL(hA,numData,k,numFilter); o 4. Sigmoid/ReLU
hA=FnSigDL(hC,numFilter,numData); o 5. Pooling
hP=FnPoolDL(hA,windows_size,numFilter,numData);
Count pad, where mI, nI is number of rows and column of hA{1}{1}. padX=(ceil(nI/windows_size)*windows_size)-nI;
Imam Cholissodin et al., Prediction of Rainfall using Simplified Deep Learning .. 127
if padX > 0 or padY > 0, then padding hA{1}{1}, padX expand edge after last column of matrix hA{1}{1}, padY expand edge after last row of matrix hA{1}{1}, eg padX = 2, padY = 2
where the size of the black box is [windows_size x windows_size]
o 6. Convolution In.
hC=FnConvInDL(hP,numData,k,numFilter); o 7. Sigmoid/ReLU
hA=FnSigDL(hC,numFilter,numData); o 8. Pooling
if size (hA{i}{j}) = [2 x 2], then set windows_size = 1 hP=FnPoolDL(hA,windows_size,numFilter,numData); c. Fully Connected with ELM (based Fig. 3).
o 9. Fully connected 1st
Eg, num_neuron_hidden_layer=5;
[hFC11,W11,Bias11,Beta11]=FnELMtrainForcast(hP,target,... num_neuron_hidden_layer,numData,numFilter);
Below is ilustrate how to get X(1,:) as first data to Fully connected 1st,
o 10. Fully connected 2nd
Eg, num_neuron_hidden_layer=7;
[hFC12,W12,Bias12,Beta12]=FnELMtrainForcast(hP,target,... num_neuron_hidden_layer,numData,numFilter);
o 11. Fully connected 3rd
Eg, num_neuron_hidden_layer=4;
[hFC13,W13,Bias13,Beta13]=FnELMtrainForcast(hP,target,... num_neuron_hidden_layer,numData,numFilter);
[numData2,...
numFeature2,target2,norm2]=FnPreProses('datatestForcast.xlsx',... mac, mic, mao, mio);
b. Feature Abstraction with CNN (based Fig. 3). o 1. Convolution Init.
hC2=FnConvDL(norm2,numData2,k); o 2. Sigmoid/ReLU
hA2=FnSigDL(hC2,numFilter,numData2); o 3. Convolution In.
hC2=FnConvInDL(hA2,numData2,k,numFilter); o 4. Sigmoid/ReLU
hA2=FnSigDL(hC2,numFilter,numData2); o 5. Pooling
hP2=FnPoolDL(hA2,windows_size,numFilter,numData2); o 6. Convolution In.
hC2=FnConvInDL(hP2,numData2,k,numFilter); o 7. Sigmoid/ReLU
hA2=FnSigDL(hC2,numFilter,numData2); o 8. Pooling
if size (hA2{i}{j}) = [2 x 2], then set windows_size = 1 hP2=FnPoolDL(hA2,windows_size,numFilter,numData2); c. Fully Connected with ELM (based Fig. 3).
o 9. Fully connected 1st
[vEvaluation1,Ytest_predict1]=... FnELMtestForcast(hP2,target2,...
W11,Bias11,Beta11,numData2,numFilter); o 10. Fully connected 2nd
[vEvaluation2,Ytest_predict2]=... FnELMtestForcast(hP2,target2,...
W12,Bias12,Beta12,numData2,numFilter); o 11. Fully connected 3rd
[vEvaluation3,Ytest_predict3]=... FnELMtestForcast(hP2,target2,...
W13,Bias13,Beta13,numData2,numFilter); d. Voting to get final result
Get Ytest_predict by minimum vEvaluation from all “Fully Connected” ComparevEvaluasi=[vEvaluasi1 vEvaluasi2 vEvaluasi3];
[vMin,idxMin]=min(ComparevEvaluasi');
So, the last step of SDLCNN-ELM algorithm is get the best result from Fully connected idxMin-th with Mean absolute deviation (MAD) = vMin. Link our full code project above for demo, please see at our webpage: https://github.com/DeepLearningStudentsCommunity/Simplified-Deep-Learning-CNN-based-ELM
3 Results and Discussion
Imam Cholissodin et al., Prediction of Rainfall using Simplified Deep Learning .. 129
characteristics of feature extraction with CNN focus more on contributing to deeper hidden pattern recognition that cannot be quantized or represented by the original features. Feature extraction with CNN uses several filters, such as average filter, max filter, and STD filter, because this technique is a major part of the Deep Learning algorithm. While the original features are only visible from the outside. The improvement results of SDLCNN-ELM are able to reduce errors 1.117 from the average MAD value when compared to ELM standard.
Figure 4. Test Result based MAD value, SDLCNN-ELM versus ELM
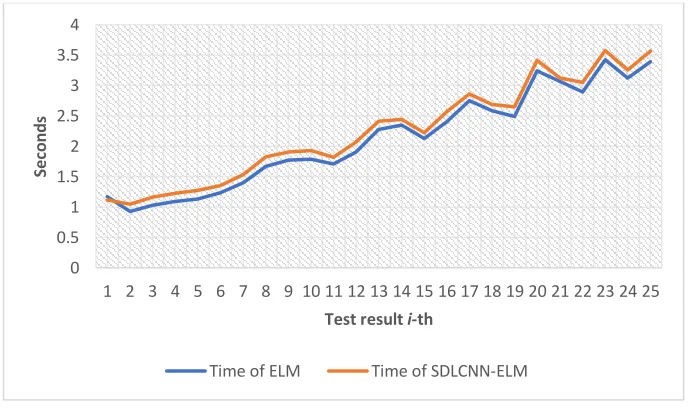
Figure 5. Time SDLCNN-ELM versus ELM
0 5 10 15 20 25
1 2 3 4 5 6 7 8 9 10 11 12 13 14 15 16 17 18 19 20 21 22 23 24 25
M
ea
n
a
b
so
lu
te
d
evi
at
io
n
(M
AD)
Test result i-th
Min. value of ELM Min. value of SDLCNN-ELM
Avg. value of ELM Avg. value of SDLCNN-ELM
0 0.5 1 1.5 2 2.5 3 3.5 4
1 2 3 4 5 6 7 8 9 10 11 12 13 14 15 16 17 18 19 20 21 22 23 24 25
Seco
n
d
s
Test result i-th
Then, in Fig. 5 the comparison graph is shown, if the experiment is increasing, the two methods both require greater computational time, which can still be said to be comparable. This is because space memory as a resource used to process and store results for each iteration of the experiment is longer and larger. So that the computation speed is slower, it can be seen by the difference in the minimum average value of the computation time as 0.1194 seconds.
4 Conclusion
The SDLCNN-ELM algorithm is a collection of deep neural network families that have been proven to produce smaller error rate compared to pure ELM methods for prediction of rainfall. This hope for the future will be very helpful in solving wider and more complex problems. In future research can be more focused on exploring the hidden features of a feature that appears in any case with a variety of representative filtering techniques and combines the hidden features with features that appear outside. And also how to find the optimal map architecture as in Fig. 3, for example using Particle Swarm Optimization as in previous research [21]. Then related to computing time, in fact, this can be overcome by how the data structure is used, or involves parallel techniques or run them on server computers with very supportive specifications. While access from clients can be of any type of device, anywhere and anytime can process and monitor the results of the process.
References
1. BPS Jatim. (2014). “Provinsi Jawa Timur Dalam Angka 2014”. http://jatim.bps.go.id/en/?hal=publikasi_detil&id=57.
2. BMKG Staklim Karangploso Malang. (2015). “Analisis Dinamika Atmosfer Dan Laut Dasarian III Maret 2015 Update 2 April 2015”. http://karangploso.jatim.bmkg.go.id/index.php/analisis-kondisi-dinamika-atmosfer-laut- dasarian/158-analisis-kondisi-dinamika-atmosfer-laut-dasarian-tahun-2015/399-analisis-
dinamika-atmosfer-dan-laut-dasarian-iii-maret-2015-update-2-april-2015#axzz3X8h9y4fg&gsc.tab=0.
3. Roqib, M. (2015). “Sawah Di Bengawan Solo Panen Dini”. http://www.koran-sindo.com/read/985544/151/sawah-di-bengawan-solo-panen-dini-1428289435.
4. Ekasari, N. (2015). “Mau Tanam? Lihat Katam Versi Baru”. Sinar Tani. April 2. http://tabloidsinartani.com/content/read/mau-tanam-lihat-katam-versi-baru/.
5. Utomo, Y. W. (2014). “BMKG Akui Prakiraan Cuacanya Masih Kurang Akurat”. Kompas.
January 30.
http://sains.kompas.com/read/2014/01/30/1628275/BMKG.Akui.Prakiraan.Cuacanya.Ma sih.Kurang.Akurat.
6. Dianingtyas, T. (2014). “Akurasi KATAM Masih Rendah”. Sinar Tani. September 2. http://tabloidsinartani.com/content/read/akurasi-katam-masih-rendah.
7. Ingragustari. (2005a). “Prediksi Curah Hujan Dengan Menggunakan ANFIS”. Lokakarya Nasional Forum Prakiraan, Evaluasi Dan Validasi BMG.
8. ———. (2005b). “Prediksi Curah Hujan Dengan Menggunakan Transformasi Wavelet”. Prosiding Lokakarya Nasional Forum Prakiraan, Evaluasi Dan Validasi BMG.
9. Nuryadi. (2005). “Validasi Model Prakiraan Jangka Panjang Menggunakan Model Arima”. Lokakarya Nasional Forum Prakiraan, Evaluasi Dan Validasi BMG.
Imam Cholissodin et al., Prediction of Rainfall using Simplified Deep Learning .. 131
11. Mwasiagi, J. I. (2016). “The Use Of Extreme Learning Machines (ELM) Algorithms To Prediction Strength For Cotton Ring Spun Yarn”. Journal Fashion and Textiles, vol. 3, Number 1, Springer Nature Switzerland AG. Part of Springer Nature.
12. Ke, H.-F., Lu, C.-B., Li, X.-B., Zhang, G.-Y., Mei, Y., and Shen, X.-W. (2018). “An Incremental Optimal Weight Learning Machine of Single-Layer Neural Networks”. Hindawi Scientific Programming, vol. 2018, Article ID 3732120, 7 pages, 2018. https://doi.org/10.1155/2018/3732120.
13. Khellal, A., Ma, H., Fei, Q. (2018) . “Convolutional Neural Network Based On Extreme Learning Machine For Maritime Ships Recognition In Infrared Image”. Sensors 2018, 18, 1490; doi:10.3390/s18051490 www.mdpi.com/journal/sensors
14. Pang, S. and Yang, X. (2016). “Deep Convolutional Extreme Learning Machine And Its Application In Handwritten Digit Classification”. Hindawi Computational Intelligence and Neuroscience, vol. 2016, Article ID 3049632, 10 pages, http://dx.doi.org/10.1155/2016/3049632.
15. BMKG Staklim Karangploso Malang. (2018). “Prakiraan Curah Hujan Musim Hujan”.
https://karangploso.jatim.bmkg.go.id/index.php/prakiraan-iklim/prakiraan-musim/prakiraan-musim-hujan/prakiraan-curah-hujan-musim-hujan.
16. Cholissodin, I., Riyandani, E. (2016). “Analisis Big Data”. Fakultas Ilmu Komputer (Filkom), Universitas Brawijaya (UB), Malang.
17. Madura, J. (2011). “International Financial Management (11th edition)”. Florida Atlantic University. Tersedia di <http://cengagebrain.com/.
18. Nelly, C.J., Weller, P.A. (2011). “Technical Analysis in the Foreign Exchange Market”. Research Division Federal Reverse Bank of St. Louis Working Paper Series.
19. Rohrer, B. (2016). "How do Convolutional Neural Networks work?". https://brohrer.github.io/how_convolutional_neural_networks_work.html.
20. Cholissodin I., Sutrisno, Soebroto A. A., Hanum L., Caesar C. A. (2017). “Optimasi Kandungan Gizi Susu Kambing Peranakan Etawa (PE) Menggunakan ELM-PSO di UPT Pembibitan Ternak Dan Hijauan Makanan Ternak Singosari-Malang”. Jurnal Teknologi Informasi dan Ilmu Komputer (JTIIK) FILKOM UB Vol. 4 No. 1, 31-36.