46
Copyright © 2018. IJEMR. All Rights Reserved.
Volume-8, Issue-4, August 2018
International Journal of Engineering and Management Research
Page Number: 46-53
DOI:
doi.org/10.31033/ijemr.8.4.5
Mathematics Model Development Deployment of Dengue Fever Diseases
by Involve Human and Vectors Exposed Components
Flaviana Priscilla Persulessy1, Paian Siantur2 and Jaharuddin3
1Student, Department of Mathematics, Bogor Agricultural University, INDONESIA
2,3
Lecturer, epartment of Mathematics, Bogor Agricultural University, INDONESIA
1Corresponding Author: [email protected]
ABSTRACT
Dengue virus is one of virus that cause deadly disease was dengue fever. This virus was transmitted through bite of Aedes aegypti female mosquitoes that gain virus infected by taking food from infected human blood, then mosquitoes transmited pathogen to susceptible humans. Suppressed the spread and growth of dengue fever was important to avoid and prevent the increase of dengue virus sufferer and casualties. This problem can be solved with studied important factors that affected the spread and equity of disease by sensitivity index. The purpose of this research were to modify mathematical model the spread of dengue fever be SEIRS-ASEI type, to determine of equilibrium point, to determined of basic reproduction number, stability analysis of equilibrium point, calculated sensitivity index, to analyze sensitivity, and to simulate numerical on modification model. Analysis of model obtained disease free equilibrium (DFE) point and endemic equilibrium point. The numerical simulation result had showed that DFE, stable if the basic reproduction number is less than one and endemic equilibrium point was stable if the basic reproduction number is more than one.
Keywords-- Basic Reproduction Number, Dengue Fever, Mathematical Model, Sensitivity Analysis
I.
INTRODUCTION
Dengue virus is a virus can causes death disease that is dengue fever. The virus is transmitted by the bite of female mosquitoes Aedes aegypti. that get viral infections by taking food from infected human blood, then transmit the pathogen to susceptible humans. There are four serotypes of the virus that cause dengue fever DEN1, DEN2, DEN3, and DEN4. A person is infected by one of the four serotypes, the will never be infected again by the same serotype, but a person can infection by another three serotypes in 12 weeks and then becomes more susceptible to developing DHF [6].
Suppressing the spread and growth of dengue fever important thing to avoid and prevent the increase of
sufferer and casualties. This can be done by study the important factors affects of the spread and even distribution of the disease through the sensitivity index. Sensitivity index quantify how the basic reproduction number changes when response to the small shifts in the value of a parameter [4]. Sensitivity values can used to see which the parameters are important to measure accuracy and variations in which the parameters will transfer into
variation.
Many research models have been done on mathematical, to study the transmission of dengue fever and sensitivity analysis. [7] develop a SIR-ASI model to perform sensitivity analysis of dengue epidemic models. [3] gives a mathematical model dynamics transmission of dengue fever model epidemic SITR-ASI. [1] elaborated the SIR-MSI model describe the dynamics of dengue fever.
This research discusses modification of SIR-ASI model [7] by adding exposed subpopulations to human and mosquito populations, and assuming that humans will become susceptible again to three other serotypes. So that obtained the model of disease spread SEIRS-ASEI type. The purpose this research is modify mathematical model the spread dengue fever into SEIRS-ASEI type, determine equilibrium point, determine basic reproduction number, execute analysis stability of equilibrium point, numerates sensitivity index, undertake sensitivity analysis, and execute numerical simulation of the modified model.
II.
MODIFICATION
MATHEMATICAL MODEL
47
Copyright © 2018. IJEMR. All Rights Reserved.
susceptible humans and population of susceptible mosquitoes are considered open to virus infection. If case of virus transmission in population of susceptible humans and population of susceptible mosquitoes, then susceptible humans and susceptible mosquitoes are grouped into exposed subpopulations [8]. Therefore, the SIR-ASI model formulated by Rodrigues et al. (2013) are further modified by adding the exposed stages in the human population and mosquito populations.
The added assumption is that infected humans who recover because drug delivery will move to susceptible individuals. This is because medicine only heals and gives immunity to one serotype, nevertheless, not in the other three serotypes. This modification model is SEIRS-ASEI model, where the human population is divided into four
classes, that are susceptible human ( ), exposed human
( ), infected human ( ), dan resistant human ( ).
Mosquitoes are divided into three classes, that is aquatic
phase ( ), susceptible vector ( ), exposed vector ( )
dan infected vector ( ).
Modification model is a modification of Rodrigues
et al. (2013) by adding the compartment is the exposed
human population and is the exposed mosquito
population. Exposed human populations can experience
natural death at rate and exposed mosquito populations
can die naturally at rates . Furthermore, modification of
the model is also done by adding the assumption that susceptible humans given the vaccine will have immunity
to one serotype at a rate of , after the immunity is
reduced then the recovered human can return to being susceptible to the rate χ because immunity only applies to one serotype only. Schematically, the dispersion pattern of dengue fever type SEIRS-ASEI is illustrated in Figure 1,
with ( ) representing individual displacements and (⇢)
expressing the influence between compartments. The blue color shows the modification of Rodrigues et al. (2013).
Figure 1 Diagram of Dengue Model Type SEIRS-ASEI
Based on the compartment diagram in Figure 1, we obtain a system of differential equations for each compartment as follows:
( )
( )
( )
( )
(1)
( ) ( ) ( )
( )
( )
with is the total human
population and total population
of mosquitoes.
The transformations used for each compartment
are: , , , , ,
, , . Thus, the equation of human
population and mosquitoes can be written in the following differential equation system:
( ) ( )
( )
( ) ( )
( ) ( )
( )
where .
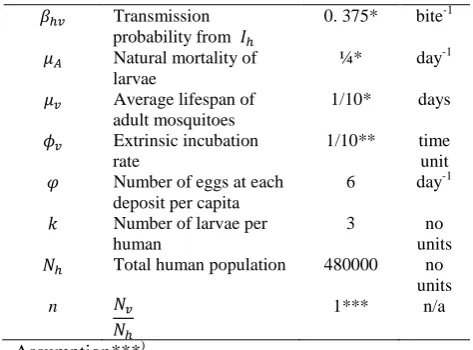
Table 1 Parameter of SEIRS-ASEI Model and its dimensions
Paramater Description Parameter
Value Unit
C Average number of bites
0.8* day-1
Average humans mortality
1/ (71x365)*
days
Transmission probability from
0. 375* bite-1
Intrinsic incubation rate 1/5** time unit Average healing period 1/3* day-1 The proportion of
susceptible humans who were given the vaccine was immune
0.1*** no units
Rate of loss of infection-acquired immunity
0.1*** no units
Maturation rate from larvae to adult
48
Copyright © 2018. IJEMR. All Rights Reserved.
Transmissionprobability from
0. 375* bite-1
Natural mortality of larvae
¼* day-1
Average lifespan of adult mosquitoes
1/10* days
Extrinsic incubation rate
1/10** time unit
Number of eggs at each deposit per capita
6 day-1
Number of larvae per human
3 no units Total human population 480000 no
units
n 1*** n/a
Assumption***)
Source: Rodrigues. Et al.2013*) and Newton and Reiter,
1992**)
III.
RESULTS AND DISCUSSION
The equilibrium point determination of the system in equation (2) has a positive solution region, with
, , , , , and .
The Equilibrium Points Determination
The Disease Free Equilibrium (DFE) is a point where all individuals are suspectibles An endemic equilibrium is a point condition when the diseases there in human population.
From the system of equation (2), obtained two
equilibrium points are disease free equilibrium point ( )
and endemic equilibrium point ( ) as follows
( ) (
)
and ( )=
( ( )
( )
).
Basic Reproduction Number
The basic reproduction number is defined as the expected number of secondary infections produced by a single infected individual in a completely susceptible
population [2]. The basic reproduction number is
determined by using the next generation matrix defined
The matrix F and V for the DFE point ( ) were
obtained based on the system of differential equations (2) as follows:
(
)
,
(
)
The basic reproduction number ( ) is largest
nonnegative eigenvalue of matrix . Based on
the system of equation (2), is obtained as follows:
( )
( )( )( ) ( )( ).
Stability Analysis of Equilibrium Point
Stability analysis of disease free equilibrium point
( ) and endemic equilibrium point ( ) obtained the
following conclusions.
a. The disease free equilibrium point ( ) of the
system of equation (2) is locally asymptotically
stable if , and unstable if .
b.
The endemic equilibrium point ( ) of the systemof equation (2) is stable if , and unstable if
.
Numerical Simulation
Simulations were performed to demonstrate the stability characteristics for each equilibrium point using
the Wolfram Mathematica® 11.0 software. The parameter
values for the model is listed in Table 1, with initial
conditions are , , , ,
, .
Dynamic Population for Disease Free Equilibrium Point
( )
Based on the parameter values listed in Table 1 , we obtained the basic reproduction number
and the disease free equilibrium point
( )
( ). Numerical simulation for
the dynamics of human population when stable at
the disease free equilibrium point is presented in
Figure 2.
(a)
0 50 100 150 200
0.25 0.30 0.35 0.40 0.45 0.50
Time Day
S
u
s
c
e
p
ti
b
le
H
u
m
a
49
Copyright © 2018. IJEMR. All Rights Reserved.
(b)
(c)
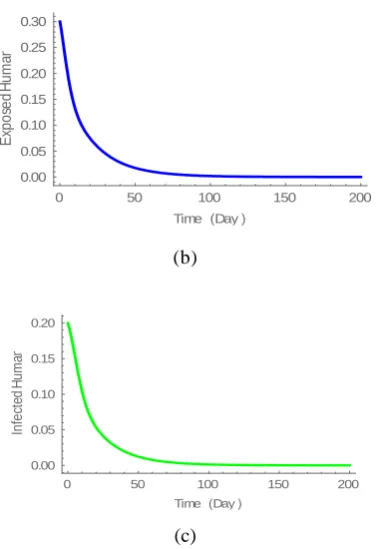
Figure 2 Human population dynamics for disease free
quilibrium point( )
Simulation results show that the susceptible human
population decreased to , then increased to
stable at point (Figure 2a). Exposed
human population experienced in population numbers
until stablized at the point (Figure 2b). The
infected human population has decreased to become stable
at the point (Figure 2c).
The numerical simulation for the population
dynamic vector when stable at the disease free
equilibrium point , is presented in Figure 3.
(a)
(b)
(c)
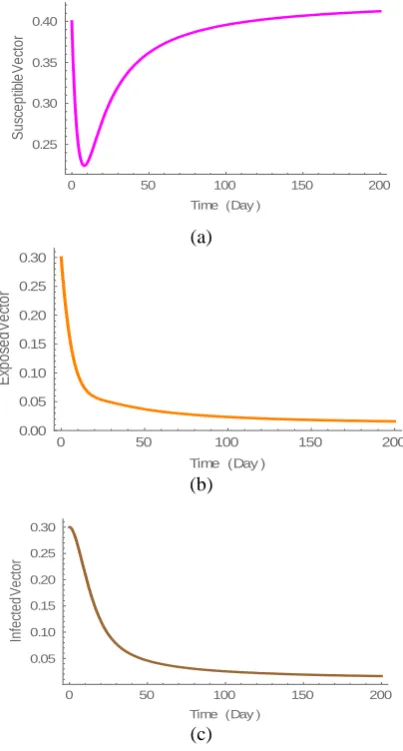
Figure 3 Dynamics population vectors for disease free
equilibrium point ( )
The simulation results showed that the susceptible
mosquito population decreased from then
increased steadyly at the point (Figure
3a). The exposed mosquitoes population decreased to a
stable condition at point (Figure 3b). Infected
mosquito population decreased until stable at point
(Figure 3c).
The simulation results presented in figures 2 and 3 correspond to Theorem 1 The disease free equilibrium point of equation system (2) is local asymptotic stablity
if . The disease free equilibrium point ( ) is
unstable if .
Population Dynamics Endemic Equilibrium Point ( )
Based on the parameter values listed in Table 1,
and the following parameters values , ,
which were assigmend to the different with the
listed in Table 1. We obtained the basic reproduction
numbers are and endemic equilibrium
point
( )
(
). Numerical simulation for the dynamics of
human population when stable at the endemic
equilibrium point is presented in Figure 4.
(a)
(b)
0 50 100 150 200
0.00 0.05 0.10 0.15 0.20 0.25 0.30 Time Day E xp o se d H u m an
0 50 100 150 200
0.00 0.05 0.10 0.15 0.20 Time Day In fe ct ed H u m an
0 50 100 150 200
0.25 0.30 0.35 0.40 0.45 Time Day S u sc e p ti b le V e cto r
0 50 100 150 200
0.00 0.05 0.10 0.15 0.20 0.25 0.30 Time Day E xp o se d V e ct o r
0 50 100 150 200
0.00 0.05 0.10 0.15 0.20 0.25 0.30 Time Day In fe ct e d V e ct o r
0 50 100 150 200
0.3 0.4 0.5 0.6 0.7 0.8 Time Day S us ce pt ib le H um an
0 50 100 150 200
50
Copyright © 2018. IJEMR. All Rights Reserved.
(c)
Figure 4 Human population dynamics for endemic
equilibrium point ( )
The simulation result shows that susceptible human
population is stable at point (Figure 4a),
exposed human population is stable at point
(Figure 4b), and the infected human population
is stable at point (Figure 4c).
The numerical simulation for population vector
dynamics when stable at the endemic equilibrium
point , is presented in Figure 5.
(a)
(b)
(c)
Figure 5 Population dynamics vectors for endemic
equilibrium point ( )
The simulation results show that the susceptible
mosquito population is stable at the point
(Figure 5a), exposed mosquitoes population is stable at
point (Figure 5b), and infected mosquitoes
population is stable at point (Figure 5c).
The simulation results presented in figures 4 and 5 correspond to Theorem 2 The endemic equilibrium point
of the system of equation (2) is stable if .
Sensitivity Analysis
This task is intended to assess the effect of
changing particular parameter values on . The
sensitivity index of the basic reproduction number of the
depending on the parameter 𝑝 is obtained by
.
The sensitivity index of each parameter of the model is presented in Table 2.
Referring to Table 1 also the values of the
parameters , , for conditions without disease and
endemic, two basic reproduction values are obtained as presented previously. The sensitivity index value that will be presented in Table 2 is the sensitivity index value for the parameters in conditions without disease and endemic.
Table 2 The Sensitivity Index of Parameter
Paramater Sensitivity Index Value
C 2 2
-0.000115824 -0.0000515319
1 1
0.000192901 0.000192901
-0.499904 -0.666581
0.499711 0.666324
0.555556 0.555556
1 1
0 0
-2.05556 -2.05556
0.5 0.5
n 1 1
Based on Table 2, there are three group sensitivity index values, which are positive, negative and zero. The positive values indicate that the increase of that particular
parameter will increase the values of . The negative
values indicate that the increase of that particular
parameter will descrease the values of . Whereas, the
sensitivity index is zero meaning the parameter p has no
effect on the value of .
In adddition, computer simulations was also conducted to show the effect of changing parameter
values C, , , , and on .
The Effect of Average Daily Biting ( )
The daily rate of mosquito bites in humans is also an important factor to be observed. Numerical simulation results are shown in Figure 6 to see the effect of changing
0 50 100 150 200
0.05 0.10 0.15 0.20
Time Day
In
fe
c
te
d
H
u
m
a
n
0 50 100 150 200
0.25 0.30 0.35 0.40
Time Day
S
u
sc
e
p
tib
le
V
e
ct
o
r
0 50 100 150 200
0.00 0.05 0.10 0.15 0.20 0.25 0.30
Time Day
E
xp
o
se
d
V
e
ct
o
r
0 50 100 150 200
0.05 0.10 0.15 0.20 0.25 0.30
Time Day
In
fe
ct
ed
V
ec
to
51
Copyright © 2018. IJEMR. All Rights Reserved.
parameter value on exposed human population and
infected human population.
Figure 6 Effect of and from variation
Figure 6 shows that with an average daily bite increased, it will increase the number of exposed human populations (Figure 6a) and infected human population (Figure 6b). This shows that if the average mosquito bites infected in humans can not be pressed from 1.46068 per day then the disease will not disappear from the
population. If parameter value = 0.8 then the graph will
be stable at the disease free equilibrium point. Whereas, if
parameter = 1.56129 then the graph will be stable at
endemic equilibrium point.
The Effect Transmission Probability from Infected Mosquito
Transmission infected mosquitoes is transmission of virus from infected mosquitoes to susceptible humans. Numerical simulation results are shown in Figure 7 to see
the effect of changing parameter value on exposed
human population and infected human population.
Figure 7 Effect of and from variation
Figure 7 shows that the greater the transmission
rate occurs, will increase the number of exposed human
populations (Figure 7a) and the number of infected populations. This indicates that if the transmission rate is not suppressed to less than 1.25015 per day then the disease will not disappear from the population. If
parameter value = 0.375 then the graph will be stable
at the disease free equilibrium point. Whereas, if
parameter = 1.4283 then the graph will be stable at
endemic equilibrium point.
Effect of Healing Period from Dengue Fever
The healing period observed in this study is the period of healing of dengue fever in the human population. Numerical simulation results are shown in Figure 8 to see the effect of changing parameter value on exposed human population and infected human population.
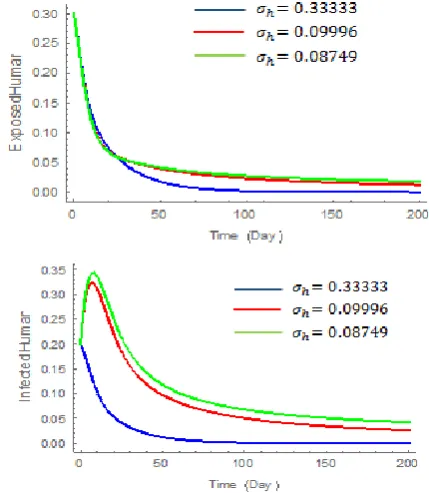
Figure 8 Effect of and of variation
Figure 8 shows that the greater the healing period
( ), will decrease the exposed human population (Figure
8a) and the number of infected human populations (Figure 8b). This suggests that if medical treatment is done well to increase healing to 0.09996 per day, then the disease will
still exist in the population. If parameter value =
0.33333 then the graph will be stable at the disease free
equilibrium point. Whereas, if parameter = 0.08749
then the graph will be stable at equilibrium point endemic.
The Effect of The Proportion of Humans Given The Vaccine Directly Immune
The vaccine is an antigenic agent used to produce active immunity against a disease. Numerical simulation results are shown in Figure 9 to see the effect of changing
parameter value on exposed human population and
52
Copyright © 2018. IJEMR. All Rights Reserved.
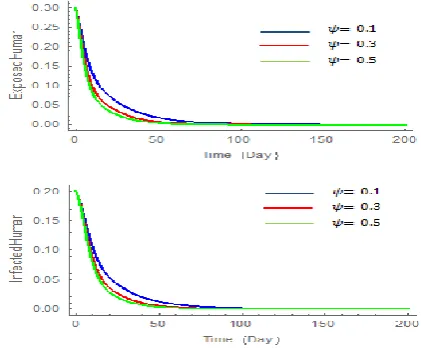
Figure 9 Effect of and of variation
In Figure 9 it shows that the more human
populations given the vaccine ( ), the lower the exposed
human population (Figure 9a) and the infected human population (Figure 9b). This suggests that the more humans are vaccinated the system will stabilize at disease free equilibrium point.
The Effect of Constant Rate of Immune Loss In Humans After Healing
Immunity is a system of protection of outside biological influences by specialized cells and organs in an organism. Numerical simulation results are shown in Figure 10 to see the effect of changing parameter value on exposed human population and infected human population.
Figure 10 Effect of and of variation
In Figure 10 it is seen that the greater the ,
resulting in an expanding human population number so that the human population is infected will also increase. This suggests that if the level of constant immune loss in humans after recovery increases, exposed human populations and infected human populations will increase.
If parameter value = 0.1 then the graph will be stable at
disease free equilibrium point. Whereas if parameter increases more than 0.1 then the graph will be stable at endemic equilibrium point.
CONCLUSIONS
In this research, modified mathematical model of dengue fever distribution by adding exposed stages on mosquito and human population and some assumptions as model parameters. The result of the analysis performed on the modified model obtained two equilibrium points, i.e
equilibrium point without disease and endemic
equilibrium point. Equilibrium point without disease
locally asymptotic stable at condition , whereas
endemic equilibrium point stable at condition .
The numerical simulation results for indicate that
the local asymptotic population of humans and mosquitoes is stable at the equilibrium point without disease, whereas
for shows that the human and mosquito
populations are stable at endemic equilibrium point. The sensitivity analysis performed on the parameters shows that each parameter has a different influence on depending on its sensitivity. The average daily bite parameters, healing rate from dengue fever, infected mosquito transmission rate, and loss of immunity in humans after healing when increased will increase the value that affects the dengue epidemic. If vaccination
is increased then it causes a decrease in value so as to
help suppress disease growth rate.
REFERENCES
[1] Ali TM, Karim MFA, & Kamil AA. (2015). Mathematical model of dengue fever and its sensitivity
analysis. Pakistan Journal of Statistics, 31(6), 717-731.
[2] Driessche PVD, & Watmough J. (2008). Mathematical
Epidemiology. Heidelberg (DE): Springer.
[3] Massawe LN, Massawe ES, & Makinde OD. (2015).
Modelling infectiology of dengue epidemics. Applied and
Computational Mathematics, 4(3), 192-206.
[4] Mpeshe SC, Nyerere N, & Sanga S. (2017). Modeling approach to investigate the dynamics of Zika virus fever: a
negleted disease in Africa. International Journal of
Advances in AppliedMathematics andMechanics, 4(3),
14-21.
[5] Newton EA & Reiter P. (1992). A model of the transmission of dengue fever with an evaluation of the
impact of ultra-low volume (ULV) insecticide
applications on dengue epidemics. The American Journal
of Tropical Medicine and Hygiene, 47(6), 709-720.
[6] Nuraini N, Soewono E, & Sidarto KA. (2007). Mathematical model of dengue disease transmission with
severe DHF compartment. Bulettin of Malaysian
Mathematical Sciences Society, 30(2), 143-157.
[7] Rodrigues HS, Monteiro MTT, & Torres DFM. (2013). Sensitivity analysis in a dengue epidemiological
model. Hindawi Publishing Corporation, 2013, 1-7. doi:
53
Copyright © 2018. IJEMR. All Rights Reserved.
[8] N. Chitnis, J. M. Hyman, & J. M. Cushing. (2008).
Determining important parameters in the spread of malaria through the sensitivity analysis of a mathematical model.