A Contextualized, Differential Sequence Mining
Method to Derive Students’ Learning Behavior
Patterns
JOHN S. KINNEBREW, KIRK M. LORETZ, and GAUTAM BISWAS Department of EECS and ISIS
Vanderbilt University Nashville, TN USA
Computer-based learning environments can produce a wealth of data on student learning interac-tions. This paper presents an exploratory data mining methodology for assessing and comparing students’ learning behaviors from these interaction traces. The core algorithm employs a novel combination of sequence mining techniques to identify differentially frequent patterns between groups of students (e.g., experimental versus control conditions or high versus low performers). We extend this technique by contextualizing the sequence mining with information about the stu-dent’s performance over the course of the learning interactions. Specifically, we employ a piecewise linear segmentation algorithm in concert with the differential sequence mining technique to iden-tify and compare segments of students’ productive and unproductive learning behaviors. We present the results from the application of this exploratory data mining methodology to learning interaction trace data gathered during a recent middle school class study with the Betty’s Brain learning environment. These results illustrate the potential of this methodology in identifying learning behavior patterns relevant to the investigation of metacognition and strategy use.
Additional Key Words and Phrases: sequence mining, differential sequence mining, piecewise linear representation, learning behaviors, metacognition, computer-based learning environments
1. INTRODUCTION
Cognitive scientists have established that metacognition and self-regulation are
important components for developing effective learning in the classroom and
be-yond [Bransford et al. 2000; Zimmerman 2001]. In developing a computer-based
learning environment (CBLE) called Betty’s Brain, we adopt the framework for
self-regulated learning (SRL), which originated from the social constructive theory
of learning proposed by Bandura [1997]. In this system, students learn science
top-ics by exploring hypermedia resources and constructing a causal map to teach the
virtual Teachable Agent (TA), called Betty [Biswas et al. 2005; Blair et al. 2007].
As they teach, students can assess their agent’s (and their own) learning by asking
her questions and getting her to take quizzes. Overall, the combined learning and
teaching task is complex, open-ended, and choice-rich, so learners must employ a
number of cognitive and metacognitive skills to achieve success. Their cognitive and
Betty and a mentor agent named Mr. Davis. This feedback aims to help students
progress in their learning, teaching, and monitoring tasks.
A number of researchers (e.g., [Pintrich 2000; Zimmerman et al. 1992; Zimmer-man 2001]) have demonstrated that students’ SRL capabilities can play a significant
role in high school academic achievement. In addition, studies by Brown and
Palinc-sar [1989] have demonstrated that through instruction younger students can acquire
and apply metacognitive skills, such as planning and monitoring. However, students
in typical classrooms are rarely provided opportunities to learn and exercise these
strategies [Paris and Paris 2001; Zimmerman 1990]. We believe choice-rich,
open-ended learning environments like Betty’s Brain, where students have to work on
complex learning tasks can provide these much-needed opportunities to learn and
practice these skills in classroom environments.
In general, CBLEs allow researchers not only to track students’ learning
per-formance, but also many details of their learning interactions and activities. The
learning activities logged by a CBLE result from a variety of internal cognitive and
metacognitive states, strategies, and processes used by the student. This wealth
of data provides an opportunity to more accurately assess, model, and understand
student learning behaviors and strategies. To take advantage of this opportunity
re-quires effective methods of identifying interesting learning behavior patterns in this
activity data. In this paper, we present an exploratory data mining methodology
using sequence mining methods for assessing and comparing students’
metacogni-tive learning behaviors from their learning interaction traces.
In previous work, we have used hidden Markov models (HMMs) [Rabiner 1989]
as a direct (probabilistic) representation of these internal states and strategies.
This methodology has facilitated identification, interpretation, and comparison of
student learning behaviors at an aggregate level [Biswas et al. 2010; Kinnebrew
et al. 2013]. Like a student’s mental processes, the states of an HMM are hidden,
meaning that they cannot be directly observed, but they produce observable output
(e.g., actions in a learning environment). However, the aggregated descriptions often mask the exact manifestation of specific learning behaviors and strategies that
students employ as they work on the system. To identify and analyze these detailed
learning behaviors, we have developed sequence mining methods that provide a
finer-grained analysis and more precise definitions of learning behavior differences
between groups of students.
An important component of this detailed analysis of students’ learning behaviors
fre-quent1patterns of actions within a group. However, this approach can also result
in a very large number of frequent patterns, especially when allowing gaps to
ac-count for “noise.” For example, when we looked at activity traces of 22 8thgrade
students working on a climate change science unit in Betty’s Brain, we found over
1,000 patterns that occurred in at least 80% of their interaction traces on the
sys-tem, even when we limited gaps to a single action between consecutive actions in
the pattern. Further, using a threshold of 80% of students resulted in overlooking
many patterns that could be linked to important learning strategies employed by
the majority of the group (but fewer than 80%), while lower thresholds yielded far
too many patterns for consideration. In general, a major challenge in the analysis of
frequent patterns is limiting the often large set of results to interesting or important
patterns (i.e., theeffectivenessof a mining technique in identifying useful patterns as opposed to itsefficiency, or speed, in finding the patterns [Agrawal et al. 1993]). To overcome this problem, we have developed an algorithm that employs a novel
combination of sequence mining techniques to identify differentially frequent
pat-terns between groups of students (e.g., experimental versus control conditions or high versus low performers) [Kinnebrew and Biswas 2011]. In this paper, we present
a formal description of this algorithm and extend it by contextualizing the
differ-ential sequence mining with information about the student’s performance over the
course of the learning interactions. More specifically, we employ a piecewise linear
segmentation algorithm in concert with the differential sequence mining algorithm
to identify and compare learning behaviors during productive and non-productive
periods (where productive periods are characterized by increasing performance in
constructing the correct causal map). We apply this exploratory data mining
methodology to learning interaction trace data gathered during a recent Betty’s
Brain study in a middle school classroom. These results illustrate our
methodol-ogy’s potential for identifying learning activity patterns relevant to the investigation
of cognitive and metacognitive learning behaviors and strategies.
The rest of this paper is organized as follows. Section 2 presents a brief review of
sequence mining methods that have been employed to derive and analyze students
learning behaviors in CBLEs. This section also describes methods that have been
employed to measure students’ metacognitive and self-regulated learning behaviors.
Section 3 then describes the algorithms employed in our methodology, including the
differential sequence mining algorithm that identifies patterns in activity sequences
and the linear segmentation technique that partitions the students’ learning
per-1Pattern frequency in sequential pattern mining is defined as the number of different sequences
formance (measured by the map score) into productive and counter-productive
periods. Section 4 briefly discusses the Betty’s Brain learning by teaching
envi-ronment, and the cognitive and metacognitive strategy model that describes the
idealized learning and teaching activities in Betty’s Brain. Section 5 describes the
experimental study from which the sequence data was collected, and Section 6
presents the results of our differential sequence mining analysis to identify
learn-ing behaviors of high- versus low-performlearn-ing students durlearn-ing their productive and
counter-productive segments. Last, Section 7 discusses the implications of these
results and outlines directions for further research.
2. RELATED PRIOR WORK
The focus of this paper is on the analysis of students’ learning behaviors and
metacognition, using data mining techniques. To find these important patterns in
a comparative analysis between students’ activity traces, our methodology
identi-fiesdifferentially frequentpatterns and identifies productive and counter-productive phases of student activity within the traces. We discuss this methodology in
sec-tion 3, but first briefly review relevant past work on measuring metacognitive
be-haviors in Section 2.1, and the use of sequence mining techniques to analyze student
learning behaviors in Section 2.2.
2.1 Identifying and Measuring Metacognition and Self-Regulated Learning
The traditional approach to measuring students’ metacognition and self-regulated
learning (SRL) has been through the use of self-report questionnaires (e.g., [Pin-trich et al. 1993; Weinstein et al. 1987; Zimmerman and Martinez-Pons 1986]).
The underlying assumption in these questionnaires is that self-regulation is an
ap-titude that students possess. For example, the questionnaire items might attempt
to assess students’ inclination to elaborate as they read a passage, or to
deter-mine their approach to managing available time resources [Perry and Winne 2006;
Zimmerman 2008]. This approach has been useful, as the self-report
question-naires have been shown to be good predictors of students’ standard achievement
test scores and they correlate well with achievement levels [Pintrich et al. 1993;
Zimmerman and Martinez-Pons 1986]. However, Hadwin and others [Azevedo and
Witherspoon 2009; Hadwin et al. 2001; Hadwin et al. 2007; Perry and Winne 2006]
have argued that while the questionnaires provide valuable information about the
learners’ self-perceptions, they fail to capture the dynamic and adaptive nature of
SRL as students are involved in learning, knowledge-building, and problem-solving
tasks.
ex-amine the complex temporal patterns of self-regulated learning [Aleven et al. 2006;
Azevedo and Witherspoon 2009; 2009; Biswas et al. 2010; Hadwin et al. 2007;
Jeong and Biswas 2008; Zimmerman 2008]. The primary notion is that
metacog-nition and SRL are evolving events that can be better understood by observing
students’ learning and problem-solving activities. Perhaps the most common type
of data collected are computer logs, which can record every action that the
stu-dent performs in a computer-based learning environment. For example, Hadwinet al. [2007] performed a study that collected activity traces of 8 students using the gStudy system [Perry and Winne 2006]. The activity traces were analyzed in four
different ways: (i) frequency of studying events, (ii) patterns of studying activity,
(iii) timing and sequencing of events, and (iv) content analyses of students’ notes
and summaries. The results of this analysis were compared against students’
self-reports on their self-regulated learning. One of the important findings was that
many participants’ self-reports of studying tactics, as determined by the MSLQ
items, were not well calibrated with studying events traced in the gStudy system.
The researchers found that the best matched item showed a 40% agreement, and
the average agreement was 27%. The authors concluded from this study that trace
data of student activity in e-learning environments are important for furthering our
understanding of SRL.
More recently, trace data is being supplemented with other sources of data, such
as concurrent verbal think-alouds (e.g., [Azevedo and Witherspoon 2009] and mea-sures of affect (e.g., automatic recording of facial expression, posture, etc. [Burleson et al. 2004; D’Mello et al. 2007; D’Mello et al. 2008; Lester et al. 1997]. [Azevedo
and Witherspoon 2009] have developed a hypermedia environment called
MetaTu-tor to help students learn about complex and challenging science topics, such as
the circulatory processes in human body systems. The system is also designed to
train students in key SRL processes that relate to planning, metacognitive
moni-toring, learning strategies, and methods for handling task difficulties and demands.
The authors used a combination of student trace data and think-aloud protocols
to understand the nature of students’ learning outcomes and their deployment of
SRL processes. For example, one of their studies showed that students
predomi-nantly used strategies that pertained to acquiring knowledge from the multimedia
resources, and they only occasionally employed monitoring strategies to check on
what they have learned [Azevedo and Witherspoon 2009]. Combining trace and
think-aloud protocols provides more insight into the students’ thought processes
that govern the use of strategies. Furthermore, they can be used to validate the
com-bine with the trace data, our methodology, presented in Section 3, contextualizes
the identification of activity patterns by the student’s evolving task performance
(e.g., productive versus counter-productive periods) over the course of the learning interactions.
2.2 Applying Sequence Mining to Study Student Learning Behaviors
In order to better understand learning, researchers have applied data mining
tech-niques, such as sequential pattern mining, to a variety of educational data. For
example, Perera et al. [2009] investigate trace data from mirroring and feedback tools that support effective teamwork among students collaborating on software
development using an open source professional development environment called
TRAC. In their approach, they help all groups improve their work by observing
and emulating the behaviors of the strong groups. They use k-means clustering
to find groups of similar teams and similar individuals, and then employ a
modi-fied version of the Generalized Sequential Pattern (GSP) mining algorithm [Srikant
and Agrawal 1996] to show that leadership and group interaction are important to
success.
Similarly, Martinezet al.[2011] discover which frequent sequences of actions char-acterize high-achieving and low-achieving learners. They collect electronic traces
from groups of students collaborating around a shared tabletop to answer an open
question posed as a mystery problem. They then apply a clustering algorithm to
group similar patterns to aid in analyzing the pattern distribution across the groups.
Employing sequential pattern mining allows them to identify differences between
the higher- and lower-achieving groups in their manner of information gathering to
solve the problem.
Like Perera et al.[2009] and Martinezet al.[2011], we compare sequential pat-terns derived from groups of student activity sequences. However, our
differen-tial sequence mining algorithm directly incorporates comparisons between groups
in identifying interesting patterns, rather than manually performing
researcher-directed comparisons after data mining. Further, in addition to sequential pattern
mining metrics and constraints, we employ additional metrics, such as another
frequency calculation based on episode mining, to identify differentially frequent
patterns.
Other researchers have employed sequential pattern mining (with a single set of
student activity sequences or subsequences) to generate student models for
cus-tomizing learning to individual students. For example, Tang and McCalla [2002]
propose sequential pattern mining of students’ paths in a web-based environment,
pro-pose a method for creating personalized activity trees to be used in a Sharable
Content Object Reference Model (SCORM) e-learning system. They use
sequen-tial pattern mining to extract frequent learning patterns as part of a larger process
that creates a decision tree to predict the group/category for a new student.
Some researchers have also employed sequence mining with the goal of
identify-ing learnidentify-ing behaviors relevant to self-regulated learnidentify-ing. In particular, Nesbit et al.[2007] employ sequential pattern mining to investigate self-regulation in gStudy, which is a software application with similarities to Betty’s Brain. In this system,
students learn from multimedia documents and organize their knowledge with notes,
concept maps, and other objects. The authors define a set of actions from events in
log files and use sequential pattern mining to find the longest common subsequences
across a set of action files. Using this method, the authors hope to step beyond
the question of whether a tool helps learners construct knowledge and instead
in-vestigate when and how learners use the tool as they self-regulate their knowledge
construction activities. Similarly, our work investigates self-regulated learning by
identifying sequential patterns of student activity. However, our data mining
ap-proach goes beyond applying sequential pattern mining to action sequences.
Unlike all of the preceding applications of sequential pattern mining, our
method-ology also analyzes the student’s evolving performance to identify, and group, action
subsequences corresponding to productive and counter-productive phases. Further,
our differential sequence mining technique explicitly identifies and ranks
differen-tially frequent patterns between these (or other) groupings of action sequences.
3. DIFFERENTIAL SEQUENCE MINING METHODOLOGY
To effectively perform sequential data mining on learning interaction traces, raw
logs must first be transformed into an appropriate sequence of actions. Since these
logs can contain a significant quantity of information about each student interaction
with the system, as well as other system bookkeeping information, raising the level
of abstraction from raw log events to a canonical set of distinct actions is a vital
first step in effective analysis.
3.1 Action Abstraction with Context Summarization
Action abstraction is the first step of our data mining methodology, in which
researcher-identified categories of actions define an initial alphabet (set of action
symbols) for the sequences. This step filters out irrelevant information (e.g., cur-sor position) and combines qualitatively similar actions (e.g., querying an agent through different interfaces or about different concepts in a given topic).
student. Sometimes abstracting the raw log traces through action categorization
also strips important context from the actions in the trace sequence. For example,
while differentiating the addition of each possible link in a concept map would
result in an unwieldy set of distinct actions, knowing that the link added is the
same as one described in a previous action involving reading source material can
be important context information. To maintain a balance between minimizing
the number of distinct actions in the sequences and keeping potentially important
context information, we determine whether the content/object of an action is the
same as the content/object of any other action in a small, configurable window of
previous actions. Based on this relevance summarization we split each categorized
action into two distinct actions: (1) relevant (with the “-REL” suffix) and (2)
irrelevant (with the “-IRR” suffix) to recent actions [Biswas et al. 2010].
When students often perform a particular type of action (e.g., reading pages of resource material) repeatedly, frequent patterns in student action sequences may
include a variety of patterns that differ only by the number of repetitions of that
action. To improve this exploratory analysis, our action abstraction step
distin-guishes a single action from repeated actions (with a given threshold on the number
of repeats), which are condensed to a single “action” with the “-MULT” identifier.
Using the re-transformed sequences, our differential sequence mining technique can
more efficiently identify trends that could otherwise be hidden by the multitude of
frequent patterns differing only by the length of a repeated action sequence
[Kin-nebrew and Biswas 2011].
3.2 Differential Sequence Mining
To identify important activity patterns in a comparison between two sets of
ac-tion sequences, our methodology employs a novel combinaac-tion of sequence mining
techniques. In particular, sequential pattern mining [Agrawal and Srikant 1995]
is used to determine the most frequent action patterns across a set of action se-quences, while episode mining [Mannila et al. 1997] metrics are used to find the
most frequently used action patterns within a given sequence. While these tech-niques can identify the frequent patterns in activity trace data, finding the patterns
most important for interpreting learning behaviors or comparing between groups
of students is often like trying to find a needle in a haystack.
In comparing across groups of action sequences (e.g., for experiment versus con-trol conditions, or high- versus low-performing students), the differences between
the groups provide a natural criterion for identifying important patterns that may
elucidate differences in learning behavior. To use this criterion for mining
the relevant difference calculated across the groups. The sequential pattern mining
frequency measure, which is important for identifying patterns common to a group
of action sequences, is defined as: the number of sequences in which the pattern
occurs (regardless of how frequently it occurs). We refer to this frequency measure
as thesequence support(or s-support) of the pattern, following the convention of Lo
et al.[2008], and we call patterns meeting a given s-support threshold,s-frequent.
Another important metric for comparing patterns across groups is the episode
frequency, which is defined (for a single sequence) as: the number of times the
pattern occurs, without overlap, in a sequence. For a given sequence, we refer
to this frequency measure as the instance support (or i-support), following Lo et al. [2008]. We define the i-support of a pattern for a group of sequences as: the mean of the pattern’s i-support values across all sequences in the group. Other
definitions of group i-support could be employed (e.g., a mean of i-support values normalized by the length of each trace or the maximum/minimum i-support of any
trace in the group), but the mean i-support provides an easily-interpreted value
(e.g., how frequently the pattern is employed by a hypothetical average student when the comparison is between student groups) with a comprehensive view of
pattern frequency for the group as a whole. Analyzing Betty’s Brain interaction
traces, we have found similar results using both the mean i-support value and the
mean normalized i-support value for a group.
Algorithm 1 defines our differential sequence mining technique, which combines
the group s-support and i-support frequency measures to identifydifferentially fre-quent patterns across two groups of action sequences. In this algorithm, the two groups (and their associated datasets, frequent patterns, and values) are referred to
as “left” and “right,” because the order of the two groups in the comparison does not
matter. In this algorithm, we first employ a sequential pattern mining algorithm to
identify the patterns that meet a minimum s-support constraint within each group
(in lines 1-2 of Algorithm 1). One difficulty in mining frequent patterns in learning
interaction traces is that the action sequences are “noisy.” Students may exhibit a
particular learning behavior pattern, but they may also perform additional actions
interspersed with the actions that constitute the pattern. Therefore, we employ a
maximum gap constraint in mining s-frequent patterns. This constraint means that
between each consecutive pair of actions in a frequent pattern, the mining algorithm
allows up togap number of additional actions. A sequential pattern with such an optional (small) gap (e.g., the pattern A →B→ C) means that each subsequent action in the pattern is performed shortly after the previous action even if there
Input :lef t−Left dataset (set of action sequences)
right−Right dataset (set of action sequences)
Parameters:sthresh−s-frequency (support) cutoff for frequent patterns
gap−maximum gap allowed between actions in a pattern
regex−regular expression to match for limiting patterns
pthresh −t-test p value for differential patterns
Output : Ordered lists of patterns in four categories by differential
frequency
1: sF reqP trnslef t←SPAMc(lef t, sthresh, gap, regex) 2: sF reqP trnsright←SPAMc(right, sthresh, gap, regex) 3: for allptrn∈sF reqP trnslef t∪sF reqP trnsright do
4: iSupportptrn(lef t)←Count regular expression matches ofptrnin each sequence in lef t
5: iSupportptrn(right)←Count regular expression matches ofptrnin each sequence in right
6: if t-test(iSupportptrn(lef t), iSupportptrn(right))≤pthresh then 7: if ptrn∈sF reqP trnslef t ANDptrn∈sF reqP trnsright then 8: if Mean(iSupportptrn(lef t))>Mean(iSupportptrn(right))then 9: ptrnsbothLef t=ptrnsbothLef t+ptrn
10: else
11: ptrnsbothRight=ptrnsbothRight+ptrn 12: end if
13: else if ptrn∈sF reqlef t then 14: ptrnslef t=ptrnslef t+ptrn
15: else
16: ptrnsright=ptrnsright+ptrn 17: end if
18: end if
19: end for
20: {Sort categorized patterns by i-frequency difference (left - right)}
21: SortDesc(ptrnsLef t);SortDesc(ptrnsbothLef t);
SortAsc(ptrnsbothRight);SortAsc(ptrnsRight);
A, followed by B, followed by C, in close, but not necessarily direct, succession).
Further, we employ a sequential pattern mining algorithm that allows regular
ex-pression constraints (the regex parameter) on the matched patterns. Specifically, we use the core algorithm (SPAMc) from Pex-SPAM [Ho et al. 2005], which extends
the fast SPAM algorithm [Ayres et al. 2002] with gap and regular expression
con-straints. Incorporating regular expression constraints provides the ability to focus
the comparison between groups on patterns including a specific action, subsequence
of actions, or any other partial pattern of interest in an exploratory investigation.
As employed in this differential sequence mining algorithm, any sequential pattern
mining algorithm will generate the same set of (s-frequent) patterns, subject to any
provided constraints that the algorithm can accommodate. Therefore, we refer the
reader to the relevant work [Ayres et al. 2002; Ho et al. 2005] for additional details
of the SPAMc algorithm.
To compare the identified frequent patterns across groups, we calculate the
i-support of each pattern for each sequence in each group, which results in the vectors
iSupportptrn(lef t) and iSupportptrn(right) in lines 4-5 of Algorithm 1. Again, to allow for noise in learning traces, we use a maximum gap constraint in calculating
the vector of i-support values for a group of sequences. Specifically, we calculate the
component i-support values as the maximum number of non-overlapping matches
for the pattern (as defined for episode mining by Laxmanet al.[2005]) in an action sequence, allowing up togapnumber of actions between consecutive pattern actions during matching.
In order to identify patterns whose usage more clearly differ between the two
groups, we filter the s-frequent patterns based on the p value of a t-test comparing
pattern i-support between the groups (in line 6). Although this approach relies on
multiple comparisons by the t-test statistic between the groups, the t-test is not
used toprovethat the two groups of sequences differ. Rather, it is employed as a heuristic for identifying more interesting patterns in an exploratory analysis.
There-fore, we do not apply the Bonferroni or other corrections to the p-value threshold
for rejecting the null hypothesis. Instead, determining with 95% confidence, for
example, that the i-support of the pattern differs between the groups provides a
useful heuristic for limiting patterns to those that are likely used differentially in
the two groups, while the increased (total) chance of an occasional false positive
(incorrectly identifying a difference between the groups of sequences) does not pose
a major difficulty in this exploratory analysis.
Comparing the mean i-support value for each pattern between groups then allows
than the other. Although a pattern may not be s-frequent in a group of action
sequences, it can still occur in some sequences in the group, so an i-support value
can be calculated (or the i-support is 0 if the pattern does not occur in any trace
in the group). The comparison of i-support values produces four distinct categories
of frequent patterns, that are analyzed separately based on how the two groups
differ with respect to those patterns: two categories where the patterns are
s-frequent in only one group (ptrnslef tandptrnsrightin lines 14 and 16), illustrating patterns primarily employed by the respective groups, and two categories where
the patterns are common to both groups but used more often in one group than
the other (ptrnsbothLef t andptrnsbothRightin lines 9 and 11). The patterns in each of these qualitatively distinct categories are (separately) sorted by the difference
in mean group i-support to focus the analysis on the most differentially frequent
patterns (in line 21).
3.3 Performance Evolution Phase Identification
The differential sequence mining technique can be employed to analyze
differen-tially frequent activity patterns between groups of students, but more generally it
can be applied to compare any two groups of sequences. In many CBLEs, such
as the Betty’s Brain environment described in Section 4, a student’s work can be
assessed in terms of performance on a learning or problem-solving task. When this
assessment can be performed repeatedly over the course of a large task, or a series
of tasks, it can provide a rich source of information regarding the evolution of a
student’s performance and progress. Different patterns of performance evolution
may be important in situating learning behaviors with respect to the student’s
cognitive and metacognitive activities. For example, a student might make slow,
faltering progress during the early portion of a task before mastering an important
skill or strategy, indicated by a generally increasing performance metric on
assess-ments, but including occasional flat areas or small decreases. This period of slow
progress might be followed by a period of rapid, more consistent progress once the
student has gained more skill and familiarity with the task. There could also be
periods during which the student is struggling and any increases in the performance
measure are offset by commensurate (or even larger) decreases.
To more effectively identify and contextualize learning behavior patterns, we
compare sequences of actions that occur during different phases of activity with
respect to the evolution of a performance or progress measure. These phases are
identified by generating a piecewise, linear representation (PLR) for a sequence
of two-dimensional points, which correspond to the performance/progress
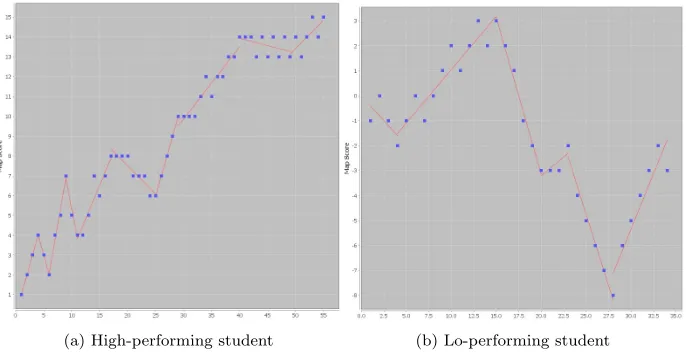
(a) High-performing student (b) Lo-performing student
Fig. 1: Example student performance evolution with identified phases
assessment, and the x-value is a cumulative measure of time or student activity
(e.g., the number of distinct actions taken in the system) since the beginning of the task. A real example of these points, with the performance phases identified by
line segments, is illustrated in Figure 1 for two students in the study described in
Section 5. In this example and the analysis presented in Section 6, the performance
metric (y-value) was the current map score and each data point corresponded to
a map editing action, which was the only type of action that could directly affect
map score. Since the map score can both increase and decrease, depending on
the students’ actions, segments can easily distinguished by positive and negative
slopes. However, even with cumulative performance metrics, as long as a
reason-able distinction can be drawn between ranges of possible slopes, this method can
be applied.
To identify these performance phases, we employ a bottom-up, time-series linear
segmentation algorithm [Keogh et al. 2004]. This method begins with the
finest-grained PLR in which each pair of consecutive points is a separate segment. At
each step every pair of consecutive segments is considered for merging into a new
segment, and the pair with the lowest error metric (for the merged segment) is
merged. This process is continued until no pairs can be merged without exceeding
a given error threshold. In our technique, we employ a standard linear regression
to generate each segment and use sum-squared-error (SSE) as the error metric.
The example in Figure 1 and the analysis presented in Section 6 employed an SSE
threshold of 4, which was determined by a qualitative analysis of productive and
plots.
Our complete methodology consists of four major steps to compare learning
be-haviors between productive phases of performance and counter-productive phases
for a set of students:
(1) Action abstraction: Logfiles are processed to produce a sequence of actions for each student by mapping sets of interaction events to canonical actions.
Each canonical action is split into high (“-REL” suffix) and low (“-IRR” suffix)
relevance types based on its content relation to recent, previous actions. Finally,
any subsequences of a repeated action are condensed into a single repeated
action (“-MULT” suffix).
(2) Performance phase identification: Student action sequences are split into sub-sequences using the time-series segmentation algorithm. These subsub-sequences
are filtered to produce two sequential datasets: a) productive action sequences
corresponding to segments with a positive progress slope above a given cutoff,
and b) counter-productive action sequences corresponding to segments with a
negative progress slope below a given (negative) cutoff.
(3) Differential sequence mining: The productive and counter-productive datasets are compared to identify differentially frequent sequential patterns of action.
(4) Interpretation: The differentially frequent sequential patterns of action are in-terpreted in terms of effective and ineffective learning behaviors exhibited by
students during the learning task. Investigation of pattern details (i.e., raw
event details for instances of these patterns) may yield further insights into
student cognition and metacognition, as well as potential flags and triggers for
adaptive feedback/scaffolding in the system.
4. THE BETTY’S BRAIN LEARNING ENVIRONMENT
This section briefly reviews students’ activities as they learn while teaching the
virtual agent, Betty, and then discusses our formal cognitive and metacognitive
model that outlines the general learning behaviors and strategies that we expect
students to develop as they use the system. Further details of the system are
presented in Biswas, et al. [2005], Leelawong and Biswas [2008], and Segedy, et
al. [2013].
4.1 The Betty’s Brain System
The Betty’s Brain system emulates the learning-by-teaching paradigm to help
mid-dle school students develop cognitive and metacognitive skills as they learn in the
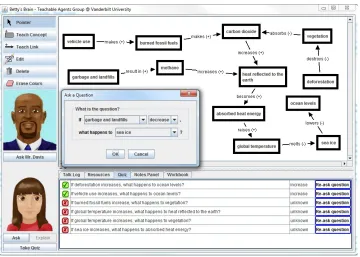
visual interface shown in Figure 2, students explicitly teach Betty by constructing
a causal concept map [Leelawong and Biswas 2008] that models the science topic
under study (e.g., climate change). The nodes in the map are relevant science concepts, and the links represent causal relations between the concepts. Students
can learn the domain material that they need to teach Betty using a set of
hyper-media resource documents organized into sections by scientific processes (e.g., the greenhouse effect). To understand how direct causal relationships (e.g., vehicle use increases fossil fuel use) can be extended to reasoning about indirect effects through
a chain of relations (e.g., vehicle use increases global temperature through a chain of links involving fossil fuel use, carbon dioxide, and heat reflected to the earth),
learners can ask Betty questions about the information she has been taught. Betty
answers questions using qualitative reasoning methods that operate through chains
of links [Leelawong and Biswas 2008] from a source concept to a target concept.
The learner can further probe Betty’s understanding by asking her to explain her
answer. Betty illustrates her reasoning through text and animation; she explains
her thinking using text (e.g., “The question said that Vehicle Use increases. This causes Fossil Fuel Use to increase. The increase in Fossil Fuel Use causes...”) and
animates her explanation by highlighting the concepts and links from the concept
map that she used to generate her answer. By asking questions and following
Betty’s explanations, learners can reflect on and revise their current understanding
of the scientific material to gain a deeper understanding of the processes under
study. The student can also ask their TA to take quizzes, which are a set of
ques-tions created and graded by a Mentor Agent named Mr. Davis. The TA’s quiz
performance helps the students to assess and reflect on their TA’s, and, therefore,
their own learning performance.
We expect students using Betty’s Brain to typically iterate between reading
ma-terial from the resources and teaching Betty by building the causal map, while
also checking and reflecting on Betty’s and their own understanding of the domain
knowledge. Students can use the query, explanation, and quiz features to perform
this checking and then revise their maps until Betty can correctly answer all
ques-tions on the quizzes created by Mr. Davis. To complete their task, students must
teach Betty a causal map that matches an expert model of the domain that is
hidden from the student. When Betty takes a quiz, Mr. Davis (the mentor agent)
compares Betty’s answers to those generated with the expert model, and provides
information about right and wrong answers. Our previous studies also show that
observing Betty’s quiz performance (which is actually a reflection of their own
learning/reviewing material related to the domain and then teaching this new or
revised understanding to Betty.
Fig. 2: Interface to the Betty’s Brain system
Next, we present an idealized student activity model in the Betty’s Brain
en-vironment, which provides the theoretical framing of the students’ learning tasks
in terms of relevant cognitive and metacognitive skills. This model is used to
de-sign the agent feedback in Betty’s Brain and guides the interpretation of identified
patterns from students’ activity traces.
4.2 The Cognitive/Metacognitive Activity Model in Betty’s Brain
The open-ended and choice-rich nature of the Betty’s Brain learning task allows a
learner to engage in many different combinations of learning activities to achieve
their goals. To succeed, learners have to make appropriate decisions regarding
when and how to acquire information, build or modify their causal map to teach
Betty, check Betty’s progress, reflect on their own understanding of both the science
knowledge and the evolving causal map structure, and seek help or feedback from
the Mentor agent. The variety of available activities and the need to sequence them
in appropriate ways requires students to monitor and regulate their own learning
However, a number of researchers (e.g., [Schunk and Zimmerman 1997]) have pointed out that students, who are novice learners, are often poor at forethought,
and their self-judgment abilities are not well developed. Metacognitive strategies
can be taught, but students in typical classrooms are rarely provided the necessary
opportunities to learn and master them. Betty’s Brain addresses this problem by
adopting a cognitive and metacognitive model that promotes a set of comprehensive
skills: setting goals for learning new material and applying them to map-building
tasks; monitoring one’s learning progress; deliberating about strategies to more
effectively facilitate learning; and revising one’s knowledge, beliefs, and strategies
to continually improve the learning performance [Azevedo 2005; Schraw et al. 2002;
Winne and Hadwin 2008; Zimmerman 2001]. This framework has guided the design
of agent-delivered feedback that encourages students to adopt effective learning
strategies as they work in Betty’s Brain [Segedy et al. 2012].
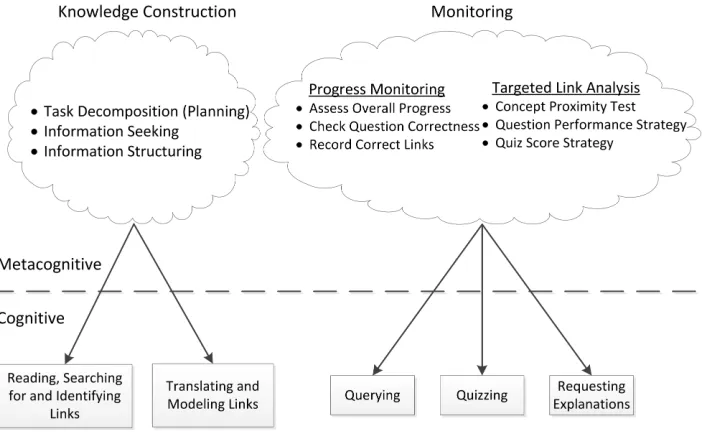
Figure 3 illustrates our conceptual cognitive and metacognitive model that we
employ to both interpret and support student activity in the Betty’s Brain system.
The model is not exhaustive, but it does depict significant cognitive and
metacogni-tive skills that have been identified as important for success in both teaching Betty
and practicing self-regulated learning (for examples of such metacognitive skills,
see [Butler and Winne 1995]). The cognitive layer consists of the cognitive skills
that learners need to employ successfully in order to teach Betty correct
informa-tion. For example, students need to be able to read and understand the resources in
order to teach them to Betty. The metacognitive layer focuses on two general areas:
(1)knowledge constructionin which students choose an area of the resources to fo-cus on, and then use that area to guide their subsequent knowledge-acquisition and
map structuring activities; and (2) monitoring in which students monitor Betty’s learning (and their own) in order to assess progress, identify deficiencies, and
cor-rect misconceptions. Within these areas of metacognition are several specific classes
of strategies for directing students’ use of the cognitive skills. The knowledge
con-struction strategies include task decomposition, information seeking, and
informa-tion structuring; the monitoring strategies include progress monitoring and targeted
link analysis; finally, the help seeking strategies include identifying a need for help,
seeking out help when necessary, and accepting help when offered. The figure also
shows explicit links from the metacognitive strategies to cognitive activities. These
links are indicative of ways in which students may employ metacognitive strategies
using cognitive activities available to them in the learning environment.
Task decomposition involves both determining how to decompose the map
Fig. 3: Model of Cognitive and Metacognitive activities in Betty’s Brain
of the segments. As an example, students may identify and focus on a small set of
related concepts, and then organize their learning and teaching interactions around
this set in a way that promotes efficiency (systematic reading of the resources)
and progress monitoring (easier to check and track map evolution and completion).
Information seeking refers to strategies for determining when and how to locate
needed information in the resources during teaching. For example, if Betty answers
a question incorrectly, students may need to revisit pertinent sections of the
re-sources in order to understand her error. Information-structuring is the process by
which students decide how to organize the evolving causal map structure.
Progress-monitoring describes how students monitor their progress when teaching
Betty, and our model identifies three such strategies: (1) assessing overall progress,
which is accomplished by periodically having Betty take a quiz and making note of
her correct and incorrect answers; (2) checking question correctness, which is more
specific to a particular segment of the map and can involve considering relevant quiz
questions and answers, asking Betty a question and reflecting on her answer, and
reading relevant resources to assess the correctness of an answer; and (3) recording
correct links, which involves noting links that have appeared in one of Betty’s
correct answers, so the students can systematically keep track of which links on
their maps are definitely correct, and which ones may need to be revised.
Targeted link analysis strategies involves using the explanation feature in Betty’s
checked individually. The concept proximity test strategy describes the process of
searching the resources to determine specifically whether or not the two concepts
connected by the link in question appear together in the text. If the two concepts
don’t appear together, then there most likely is not a direct relationship between
them. The question performance strategy is accomplished by asking Betty questions
that involve the targeted link, and then asking Mr. Davis whether or not her answers
are correct. If the link in question repeatedly appears in Betty’s incorrect answers,
but never appears in one of Betty’s correct answers, then the link in question is
most likely incorrect.
The cognitive and metacognitive activity model captures the complexity of the
Betty’s Brain task, and also highlights the wide array of cognitive tasks that
stu-dents should attend to as they are both constructing and monitoring their
under-standing of the science domain. Given that our middle school students are novice
learners, this complexity presents a problem. In past studies, we have observed
that there are many ways to fail in their learning and teaching tasks [Kinnebrew
et al. 2013; Segedy et al. 2013; 2012]. Students may have trouble reading; they may
not understand causal modeling; or they may have difficulty understanding,
select-ing, and applying the various metacognitive strategies in the model. Given these
potential difficulties, we have developed a number of systematic scaffolding and
feedback mechanisms based on our cognitive/metacognitive model described above
to support students as they work on the system. The scaffolding and feedback are
provided through conversational dialogues between the student and the agents. We
do not present the structure and details of our conversational feedback mechanism
in this paper, since they are covered in detail elsewhere (e.g., [Segedy et al. 2013; 2012]). In this paper, we focus on the data mining algorithms that we have
de-veloped to study students’ activity sequences, derive their learning behaviors, and
interpret these behaviors in terms of the model presented in Figure 3.
5. METHODS
To illustrate our methodology, we use interaction trace data from a recent study
with 40 8th-grade students from multiple sections taught by the same teacher in a
middle Tennessee school. At the beginning of the study, students were introduced
to the science topic (global climate change) during regular classroom instruction,
provided an overview of causal relations and concept maps, and given hands-on
training with the system. For the next five days, students taught their agent about
climate change and received feedback from both agents. In this version of the
construction strategies [Segedy et al. 2013]. The Mentor agent also provided some
advice on monitoring strategies to help students recognize and correct errors in
their concept maps.
To analyze the interaction traces from this study, we abstract student activities
into actions in five categories:
(1) READ: students access one of the pages in the resources;
(2) Editing: students edit the causal map, with actions further divided by whether they operated on a causal link (“LINK”) or concept (“CONC”) and by whether
the action was an addition (“ADD”), removal (“REM”), or modification (“CHG”),
e.g., LINKREMorCONCADD;
(3) QUER: students use a template, illustrated in Figure 2, to check their teaching by querying Betty, and she answers using causal reasoning through chains of
links [Leelawong and Biswas 2008];
(4) EXPL: students probe Betty’s reasoning by asking her to explain her answer to a query, which she does through a demonstration of her causal reasoning
process with dialogue and animation on the causal map;
(5) QUIZ: students assess how well they have taught Betty by having her take a quiz, which is a set of questions chosen and graded by the Mentor agent.
Categorized student actions were further distinguished by their relevance to
re-cent actions, as explained in Section 3.1. QUIZ actions were the one exception to this relevance summarization step because the student had no control over whether
the content of a quiz was relevant to their previous actions. For this analysis, an
action was considered relevant (“-REL”) if it was related to at least one of the
previous actions within a 3-action window, and irrelevant (“-IRR”) otherwise. For
Betty’s Brain, a prior action is considered relevant to the current action if it is
related to, or operates on, one of the same map links (or one of the same
con-cepts if one of the actions being compared only relates to a single concept). This
relevance summarization provides an indication of informedness for map build-ing/refinement actions and of diagnosticity for map monitoring activities [Biswas et al. 2010]. Overall, the relevance summarization maintains some action context
by providing a rough measure of strategy focus or consistency over a sequence of
actions.
6. RESULTS
The results of this study presented an interesting dichotomy in student performance
the number of correct links (based on the expert map) in the student’s map minus
the number of incorrect links. 16 of the students taught their agent a correct,
com-plete map or one very close to it (these students achieved map scores between 11
and 15, inclusive, where 15 was the maximum possible score). Another 18 students
taught their agents relatively poor maps with a map score of 5 or below. Only 6
students had a map score in between these groups (i.e., a map score of 6 to 10, inclusive). Therefore, we focus on an analysis and comparison of the learning
ac-tivities of the high-performing (“Hi”) student group and the low-performing (“Lo”)
student group.
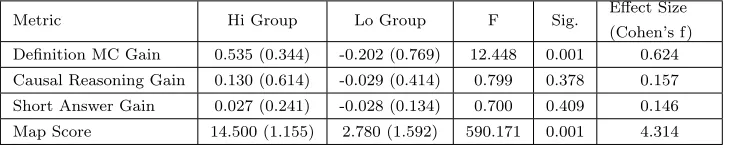
Metric Hi Group Lo Group F Sig. Effect Size
(Cohen’s f) Definition MC Gain 0.535 (0.344) -0.202 (0.769) 12.448 0.001 0.624
Causal Reasoning Gain 0.130 (0.614) -0.029 (0.414) 0.799 0.378 0.157
Short Answer Gain 0.027 (0.241) -0.028 (0.134) 0.700 0.409 0.146
Map Score 14.500 (1.155) 2.780 (1.592) 590.171 0.001 4.314
Table I: High vs. Low Performers - Learning Gain and Map Score
For this study, we used three types of questions to assess students’ learning gains,
calculated as normalized gains (((postmax−−prepre))) in pre- to post-test scores: (i) definition
multiple choice questions about the science topic testing basic recall of the science
material, (ii) short answer questions requiring reasoning about the science topic,
and (iii) causal reasoning questions that were not directly related to the science
topic. Table I presents averages and ANOVA results comparing the Hi and Lo
student groups by their normalized learning gains in each of these categories, as
well as their map scores. This analysis revealed a statistically significant difference
on definition multiple choice gain and map score. Thus, students who achieved
success in teaching Betty accurate causal maps also gained proportionally more
factual information, but their gains in causal reasoning and short answer questions
were not significantly different from the low-performing group. Further details of
the learning gain and pre-/post-test results are available in [Segedy et al. 2012].
Metric High Group Low Group F Sig. Effect Size
(Cohen’s f) Link Accuracy 60.3% (7.1%) 42.8% (10.6%) 31.528 0.001 0.992
Link Creation Effort 11.630 (8.196) 20.665 (5.942) 12.745 0.001 0.652
Action Relevance 53.3% (8.4%) 40.6% (12.2%) 12.401 0.001 0.622
Further, we analyzed the students’ effectiveness and efficiency in teaching their
agent using the causal map representation [Segedy et al. 2012]. Table II displays
the means (and standard deviations) for: (i) link accuracy - the percentage of links
added to the map that were correct; (ii) link creation effort - the total number of
student actions divided by the number of correct link edits, a measure of the effort
by the student in order to produce a correct link edit; and (iii) action relevance
-the percentage of student actions that were relevant (as described in Section 5) to
at least one of the three previous actions2. These results indicate that students in
the Hi group were more accurate in their map edits and generally more efficient in
their learning and teaching activities. Further, they tended to employ a somewhat
more systematic approach to the task, as indicated by their higher action relevance
score. However, the results also highlight the fact that even students in the Hi group
struggled with link accuracy; almost 40% of their link operations (adds, edits, and
deletes) were incorrect. The relatively low link accuracy in the Hi group suggests
that monitoring behaviors, including the ability to identify and correct erroneous
links, may have played an important role in their success.
To identify and compare learning behaviors illustrated by these students’
inter-action traces, we applied the differential sequence mining technique described in
Section 3.2. Because almost all of the most frequent activity patterns in both the
Hi and Lo student groups were the same or very similar, this technique allowed us
to identify a variety of interesting learning behaviors that were not apparent from
separately considering s-frequent or i-frequent patterns. To illustrate these results,
Table III presents the top five patterns (that contained at least two actions) in each
of the differential categories detailed in Section 3.2. In this analysis, we employed
an s-support threshold of 50% to analyze patterns that were evident in the majority
of either group of students and employed a cutoff ofp <0.05 for a reasonable confi-dence that pattern usage differed between the two groups. In all of the differential
sequence mining results presented here, we employed a maximum gap threshold of
1, to allow for “noise” from irrelevant or interchangeable actions in the learning
activity sequences, as described in Section 3.2.
The Hi group’s differentially frequent patterns in Table III suggest a greater
tendency to check low-relevance additions of causal links (possibly links added based
on prior knowledge or guesses) by taking quizzes or by reading relevant resources, as
described in the progress-monitoring strategies in Section 4.2. Further, Hi students
2In all presented results, we employed a 3-action window to calculate action relevance. Qualitative
analysis of interaction traces and talk-aloud sessions has suggested that using a window of more
Pattern I-Support Diff (Hi - Lo)
t-test
(p value)
S-Frequent Group
QUIZ→READ-REL 4.57 0.000 Hi
QUIZ→LINKREM-REL 4.08 0.003 Hi
LINKREM-REL→QUIZ 3.92 0.001 Hi
QUIZ→READ-REL-MULT 3.33 0.002 Hi
LINKADD-IRR→QUIZ→LINKREM-REL 3.14 0.004 Hi
LINKADD-IRR→QUIZ 5.80 0.001 Both
LINKADD-IRR→LINKREM-REL 3.72 0.013 Both
LINKADD-IRR→READ-REL 3.61 0.013 Both
QUIZ→LINKADD-IRR 3.24 0.022 Both
QUIZ→QUER-REL 3.08 0.006 Both
QUIZ→READ-IRR-MULT -1.18 0.026 Both
READ-IRR→READ-REL→READ-IRR-MULT -2.06 0.049 Both
QUIZ→READ-IRR-MULT→READ-IRR-MULT -0.77 0.005 Lo
READ-IRR-MULT→READ-IRR-MULT
→CONCADD-IRR -0.84 0.007 Lo
READ-IRR→READ-IRR-MULT
→READ-IRR-MULT→READ-REL -0.85 0.040 Lo
READ-IRR-MULT→READ-REL-MULT
→READ-IRR→READ-IRR -0.93 0.047 Lo
READ-IRR→READ-IRR-MULT
→READ-IRR-MULT -0.99 0.048 Lo
Table III: High vs. Low Performers - Differentially Frequent Patterns
were more likely than Lo students to follow quizzes with link removals, suggesting
that they were attempting to correct errors in their map. The LINKADD-IRR→
QUIZ→LINKREM-REL pattern, which was not observed at all in the majority of
Lo student action sequences, combines these two trends in monitoring and removing
links when they were not related to recent reading or other actions. The Hi group
was also more likely to follow a quiz with relevant reading or queries, while the
Lo group was more likely to follow a quiz with unrelated reading. Overall, these
results suggest a differential effort by the Hi group to use monitoring strategies that
made more effective use of the quiz results. These approaches to monitoring may
indicate that the Hi students paid more attention to the feedback from Mr. Davis
or were better able to understand and implement the monitoring feedback.
To further investigate which monitoring and other learning behaviors may have
contributed to the high performers success, we identified differentially frequent
dur-Pattern I-Support Diff (Inc - Dec)
t-test
(p value)
S-Frequent Group
READ-REL-MULT→READ-REL 0.74 0.043 Inc
READ-REL→READ-REL-MULT 0.55 0.085 Inc
READ-IRR-MULT→READ-REL 0.48 0.037 Inc
READ-REL→READ-IRR-MULT 0.35 0.039 Inc
LINKADD-REL→READ-REL 0.32 0.016 Inc
READ-REL-MULT 1.18 0.033 Both
READ-REL-MULT→READ-IRR 0.78 0.100 Both
READ-IRR-MULT 0.67 0.036 Both
LINKREM-IRR 0.58 0.000 Both
LINKADD-REL 0.54 0.026 Both
QUER-REL→LINKADD-IRR -0.17 0.032 Dec
LINKADD-IRR→QUER-REL -0.20 0.093 Dec
QUIZ→LINKADD-IRR -0.20 0.073 Dec
LINKADD-IRR→LINKADD-IRR -0.24 0.008 Dec
Table IV: Productive vs. Counter-productive Segments (High Performers) - Differentially Frequent
Patterns
ing their map building activities. The method for extracting the productive versus
counter-productive phases was described in Section 3.3, and we included all
seg-ments with a slope greater than or equal to 0.4 in the productive set and all segseg-ments
with a slope less than or equal to -0.4 in the counter-productive set. The slope cutoff
of 0.4/-0.4 was determined by qualitative analysis of a sample of student map score
plots to distinguish generally productive/counter-productive segments from ones
that were only fluctuating around a stable value. For the differential sequence
min-ing analysis of these segments, we employed a lower s-support threshold because the
sequences were significantly shorter than the complete student activity sequences.
Specifically, we employed an s-support threshold of 20% to analyze patterns that
occurred with some regularity (i.e., in at least one out of every five subsequences). Similarly, given the limited length and number of sequences, we employed a relaxed
cutoff on the t-test comparison ofp <0.10.
Table IV presents an overview of the results of analyzing productive and
counter-productive phases of performance in the Hi group. Of particular interest, these
re-sults indicate that extended sequences of reading (both of high and low relevance)
were more frequent during productive periods. Further, the addition of links
rele-vant to recent actions were more common in these periods and more often followed
by additional reading. Conversely, unrelated reading, especially in conjunction with
querying and quizzing was more frequent in the counter-productive periods. These
of reading and teaching information related to one topic or area of the map at a
time are generally productive activities in the learning task.
Pattern I-Support Diff
(Hi - Lo)
t-test
(p value)
S-Frequent
Group
LINKADD-IRR→QUIZ 0.38 0.000 Hi
QUIZ→READ-REL-MULT 0.34 0.000 Hi
QUER-REL→EXPL-REL 0.31 0.001 Hi
EXPL-REL 0.31 0.062 Hi
QUIZ→QUER-REL 0.24 0.006 Hi
QUIZ 0.78 0.001 Both
LINKADD-IRR 0.63 0.027 Both
LINKREM-IRR 0.49 0.004 Both
LINKREM-REL 0.31 0.081 Both
READ-IRR-MULT→READ-REL-MULT -0.61 0.085 Both
READ-REL-MULT→READ-REL→READ-IRR-MULT -0.29 0.053 Lo
READ-IRR-MULT→READ-REL-MULT→READ-IRR -0.38 0.096 Lo
READ-IRR-MULT→READ-IRR-MULT→READ-REL -0.40 0.068 Lo
READ-IRR-MULT→READ-IRR-MULT -0.43 0.075 Lo
READ-IRR-MULT→READ-REL-MULT→READ-REL -0.48 0.044 Lo
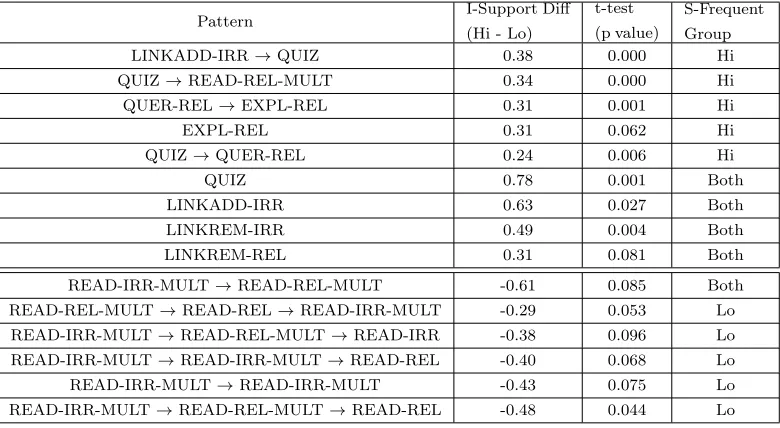
Table V: High vs. Low Performers (Productive Segments) - Differentially Frequent Patterns
To gain further insight into the most productive learning behaviors exhibited
by the students in the Betty’s Brain environment, we employed the differential
sequence mining technique to identify patterns differentiating the productive
sub-sequences of the Hi and Lo groups. Specifically, all subsub-sequences corresponding
to productive segments in the Hi group were compared with all subsequences
cor-responding to productive segments in the Lo group, with the results presented in
Table V. The LINKADD-IRR→QUIZ, QUIZ →READ-REL-MULT, and QUIZ
→QUER-REL monitoring patterns were already identified in the general
compar-ison of Hi to Lo students (Table III), but the results of this analysis suggest some
additional behaviors that may have contributed to the success of the Hi students.
In particular, employing explanations to investigate Betty’s answer to a query
sug-gests a more careful approach to monitoring Betty’s understanding. This behavior
also suggests that Hi students made a greater effort to implement the targeted
link analysis strategies suggested by Mr. Davis, although additional investigation
is required to understand why the Lo students were less likely to implement these
strategies. Further, both relevant and irrelevant link removals were more frequent
in Hi performers’ productive periods, which provides additional support to the
understanding of the material are important for success in the open-ended Betty’s
Brain learning environment.
7. DISCUSSION AND CONCLUSIONS
In this paper, we presented an exploratory data mining methodology for
identify-ing and comparidentify-ing learnidentify-ing behaviors from students’ learnidentify-ing interaction traces.
This novel methodology combines action abstraction, a sequence mining technique
to identify differentially frequent activity patterns, and piecewise linear
segmenta-tion of activity phases with respect to the evolusegmenta-tion of a performance or progress
measure. Results from a recent classroom study with Betty’s Brain illustrate the
effectiveness of this integrated methodology for: (1) identification of important
learning behaviors employed differentially between student groups, and (2) analysis
of learning behaviors distinguished by their relationship to productive or
counter-productive phases of activity.
Although the vast majority of frequent action patterns that can be identified
in these interaction traces are common to both high-performing students and
low-performing students (and occur throughout the course of students’ interaction with
the system), the results presented here illustrated some important learning
behav-iors that are related to either more or less successful performance in the learning
environment. In particular, a variety of monitoring learning behaviors employing
assessment of progress and recent actions distinguished high-performing students
from low-performing students, especially during more productive phases of activity.
Further, some behaviors such as the combination of queries and adding links that
were unrelated to recent actions, may provide warning signs of counter-productive
phases of activity that could be used to provide corrective feedback.
Naturally, the presented data mining methodology is not applicable to analysis
of all possible learning interaction traces. In particular, the differential sequence
mining algorithm is limited to the comparison of two, mutually exclusive groups
of students or activity subsequences (e.g., activity subsequences corresponding to specific phases or other identifiable segments of learning activities) at a time.
Fur-ther, this methodology requires the definition of meaningful student actions that
are relevant to learning behaviors, and the relevance summarization may not be
applicable or easily calculated in all learning environments. The identification of
productive and counter-productive phases with piecewise linear segmentation is
limited to learning environments in which student performance or progress can be
periodically assessed with a scalar metric. In addition, this methodology requires
across all datasets: the sequence mining gap constraint, the t-test p-value cutoff, the
segmentation SSE threshold, and the segmentation slope cutoffs. Although these
parameters provide flexibility in this exploratory methodology, they may have to be
assigned through qualitative assessment of the data or rules of thumb for learning
environments that differ significantly from Betty’s Brain.
This data mining methodology is designed to be exploratory in nature by
iden-tifying potentially important activity patterns for further investigation. Therefore,
we intend to analyze specific instances of the patterns identified here to gain a
better understanding of their relationship to successful/unsuccessful learning and
metacognition. In addition, we will investigate the generality of the identified
pat-terns by determining whether they are identified with students performing similar
learning tasks in different domains. Based on these analyses, we will expand and
revise the feedback triggering conditions and student modeling to improve
metacog-nitive strategy feedback from the Betty’s Brain agents.
In future work, we also intend to expand upon the presented data mining
tech-niques through a variety of enhancements and additional applications. We will
enhance the existing summarization of action-relevance to include determination
of the relationship between the specific actions in all subsequences matching the
identified patterns. For example, this enhanced action-relevance summarization
will allow us to determine how frequently a pattern like LINKADD-IRR→ QUIZ
→ LINKREM-REL involves removing the specific link added in the first action, following a quiz that used the same link in an incorrect answer. Relating
identi-fied patterns of action back to specific details and context in the interaction traces
could provide significant benefits for more efficient and effective interpretation of
learning behaviors. Further, we plan to directly integrate the action abstraction
process with the differential sequence mining to autonomously determine the most
detailed/specific level of action abstraction (for hierarchically defined/categorized
actions) and features (e.g., relevance score and length of reading actions) for which a pattern is differentially frequent.
ACKNOWLEDGMENTS
This work has been supported by NSF-IIS Award #0904387.
REFERENCES
Agrawal, R.,Imieli´nski, T.,and Swami, A. 1993. Mining association rules between sets of items in large databases. InProceedings of The ACM SIGMOD International Conference on Management of Data. Vol. 22. ACM, 207–216.
Agrawal, R. and Srikant, R.1995. Mining sequential patterns. InProceedings of the Eleventh IEEE International Conference on Data Engineering (ICDE). 3–14.