R E V I E W
Open Access
Utility of combining spectral domain
optical coherence tomography structural
parameters for the diagnosis of early
Glaucoma: a mini-review
Jean-Claude Mwanza
1*, Joshua L. Warren
2and Donald L. Budenz
1Abstract
Optical coherence tomography (OCT) has moved to the forefront of imaging modalities in the management of glaucoma and retinal diseases. It is modifying how glaucoma and glaucoma progression are diagnosed clinically and augmenting our understanding of the disease. OCT provides multiple parameters from various anatomic areas for glaucoma diagnosis, evaluation of treatment efficacy, and progression monitoring. While the use of multiple parameters has increased the likelihood of detecting early structural changes, diagnosing glaucoma in early stages is often challenging when the damages are subtle and not apparent on OCT scans, in addition to the fact that assessment of OCT parameters often yields conflicting findings. One promising approach is to combine multiple individual parameters into a composite parameter from the same test to improve diagnostic accuracy, sensitivity, and specificity. This review presents current evidence regarding the value of spectral domain OCT composite parameters in diagnosing early glaucoma.
Keywords:Optical coherence tomography, Combination of parameters, Early glaucoma
Background
Glaucoma is a slowly progressive degenerative optic neuropathy characterized by the death of retinal ganglion cells (RGCs) and their axons, with associated morphologic changes to the optic nerve head (ONH), retinal nerve fiber layer (RNFL), and ganglion cell-inner plexiform layer (GCIPL). In most cases, the disease slowly leads to complete blindness if inadequately or not treated. Both medical and surgical treatment are often able to significantly slow the disease progression, which demonstrates the critical importance of accurate and early detection of the disease for early initiation of
treatment [1]. Over the years, a number of imaging
devices (i.e., retinal thickness analyzer, scanning laser polarimetry, and confocal scanning laser ophthalmos-copy) have been developed and used in the clinical set-ting to aid the clinician in the diagnosis and monitoring
of glaucoma [2]. These modalities have since been
supplanted by optical coherence tomography (OCT), particularly its spectral domain variant.
OCT has rapidly become the most widely used imaging modality for glaucoma management. Since its commercialization, it has revolutionized the manage-ment of retinal diseases (i.e. AMD, diabetic maculopathy, macular hole, central serous chorioretinopathy, retinal vein occlusions, and vitreo-retinal interface disorders) and glaucoma. In glaucoma, OCT provides objective, precise, and highly reproducible quantitative evaluation of inner retinal layers and the ONH [3–9]. Since diag-nosing glaucoma is often unequivocal in moderate to ad-vanced stages, imaging of the ONH, RNFL, and macula is, therefore, more valuable in the diagnosis of early than moderate to advanced disease. This review presents a compilation of available data on the usefulness of spectral domain OCT (SDOCT) in diagnosing early glaucoma by combining its parameters.
* Correspondence:[email protected]
1Department of Ophthalmology, School of Medicine, University of North
Carolina at Chapel Hill, Chapel Hill, NC, USA
Full list of author information is available at the end of the article
Diagnosis of Glaucoma
While identification of glaucomatous optic neuropathy in moderate to advanced cases is often apparent clinic-ally, diagnosing glaucoma in early stages can be challen-ging. Reasons for the challenge include the symptomless nature of the disease until a substantial number of RGCs and axons have been lost, the fact that no damage can be detected at the stage of RGC apoptosis along the
glaucoma continuum [10], the wide interindividual
variation in the anatomy of the ONH and RNFL, and the lack of a gold standard for establishing the diagnosis.
Studies have shown that glaucomatous structural
changes often precede functional loss [11–13], implying that in some patients with early stage (i.e., pre-perimetric glaucoma) effort should be made to establish the diagnosis based on structural changes alone. This is crucial because waiting for more visible signs of the dis-ease would correspond to allowing the occurrence of some irreversible damage. Thus, identification of early damage to ocular structures affected by the disease is of paramount importance for early treatment to prevent ir-reversible functional loss.
SDOCT glaucoma modules currently include single parameters from the ONH, peripapillary RNFL, and macular GCIPL and/or ganglion cell complex (GCC). One device, Spectralis OCT by Heidelberg, also provides total retina thickness measurements in the macula. There are currently more than a dozen OCT parameters for glaucoma assessment; this number varies slightly be-tween platforms. A number of other parameters have been described (i.e., lamina cribrosa depth or LCD [14], lamina cribrosa curvature index or LCCI [15], neuroret-inal rim minimum distance band or MDB [16]) that are not currently reported on OCT printouts. Despite good diagnostic abilities of single parameters in early glau-coma, SDOCT devices still falsely classify healthy eyes as having glaucoma or miss the diagnosis of early glaucoma in substantial proportions of subjects [17–22]. Use of more than one individual parameter from the ONH, RNFL, and GCIPL or GCC for glaucoma assessment is therefore justified because it increases the likelihood of detecting a structural abnormality in at least one ana-tomic area. Indeed, findings from the three areas do not always show agreement. The caveat of such an approach is that it may increase the rate of false-positive conclu-sions unless appropriate corrections for multiple com-parisons are made.
Combination of parameters
There is abundant and convincing in vivo evidence of the association between glaucoma and structural damage to the ONH, RNFL, and macular GCIPL or GCC. OCT pro-vides proof regarding qualitative and quantitative informa-tion collected on multiple parameters. The diagnosis is
then based on careful interpretation of data on parameters from these anatomic structures combined with the clinical impression from the visual field and ocular examination. While the ideal situation to ascertain the diagnosis is to have an agreement among results on parameters from anatomic areas, that is not always the case in reality. In-deed, the results are more likely to agree in moderate to advanced disease. On the contrary, they often disagree in early stages when structural changes are subtle. Thus, OCT results classified as within normal range at initial visits in early stages do not necessarily indicate the ab-sence of glaucomatous structural damage. It may only mean that the magnitude of the changes is still below the threshold of detection by OCT. Monitoring with serial scans over time is then required for OCT to detect an ab-normality, when the device reaches its minimum sensitiv-ity threshold. In addition, change within the normal range beyond the change expected from aging may also be an important sign of early disease. Therefore, it is important to develop methods to optimize OCT’s ability to differen-tiate healthy eyes from eyes with early glaucoma.
The availability of refined statistical methods allows the development of combinatorial algorithms as tools for disease risk categorization, diagnostic classification, and prognostic determination. These methods combine information from single parameters to enhance diagnos-tic accuracy. Although there is still a shortage of data, available evidence shows that combining individual SDOCT parameters using various methods can offer im-proved diagnostic performance for early glaucoma. Such an approach minimizes the clinician’s challenge of men-tally integrating and processing the panoply of clinical information and OCT data from various parameters when attempting to determine whether a subject has glaucoma or not. This challenge is expected to be greater should OCT glaucoma modules include add-itional parameters in the future. The sections below present available data on detection of early glaucoma
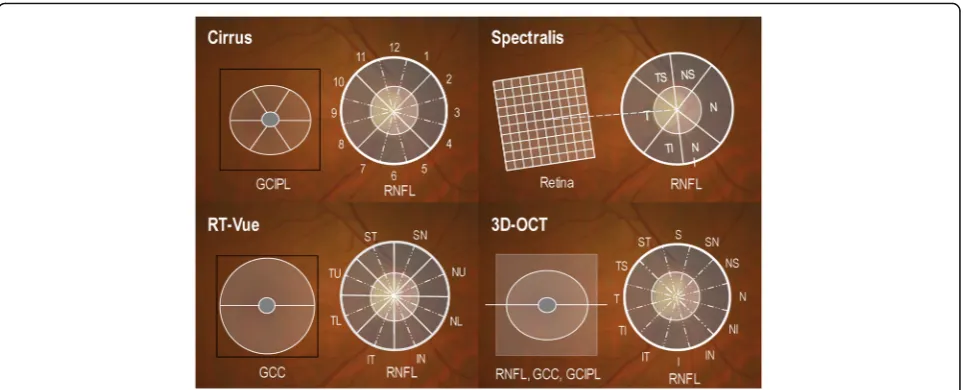
using a combination of SDOCT parameters. Figure 1
shows locations of the scans on four selected SDOCT platforms and the anatomical structure from which the parameters are measured.
AND- and OR-logic combinations
AND- and OR-Logic are binary concepts and basic operations of Boolean algebra. In this frameworkxAND y = 1 if both x= 1 and y= 1, so xAND y= 0 ifx, y, or both = 0.xORy=1 ifx= 1 and y = 0 or the opposite, or
if both x and y=1; so x OR y= 0 if both x and y=0.
early perimetric glaucoma and 49 age-matched normal subjects when used individually or in combination with peripapillary RNFL or ONH parameters measured with Cirrus HD-OCT (Carl Zeiss Meditec, Inc., Dublin, California, USA) [23]. The results indicated that pairing the minimum GCIPL and average RNFL, the minimum GCIPL and rim area, or the minimum GCIPL and infer-ior quadrant RNFL through OR-Logic method improved the sensitivity, negative predictive value (NPV) and negative likelihood ratio (NLR) relative to the best single GCIPL, RNFL, and ONH parameters, without signifi-cantly affecting the specificity. The binary OR-Logic combination of minimum GCIPL and average peripapil-lary RNFL provided the best overall sensitivity (94%), specificity (85.7%), positive likelihood ratio (PLR, 6.58), and NLR (0.07) compared to the best single GCIPL (minimum: 82%, 87.8%, 6.69, and 0.21), RNFL (inferior quadrant: 74%, 95.9%, 18.1, and 0.27), ONH (rim area: 68%, 98%, 33.3, and 0.33), and best AND-Logic combin-ation (minimum GCIPL + inferior quadrant RNFL: 64%, 100%, infinity, and 0.36). The same approach was used by Jeoung et al., who reported that combining average RNFL and minimum GCIPL measured with Cirrus HD-OCT achieved significantly higher sensitivity (81.1%) and specificity (97.5%) than other OR-Logic and AND-Logic combinations, and single parameters [24]. The findings by both Mwanza et al., [23] and Jeoung et al., [24] sug-gest that AND-Logic combinations are associated with low diagnostic performances in early glaucoma, likely because of the disagreement between RNFL and GCIPL results at this stage of the disease. From the practical standpoint, the findings also suggest that the diagnosis
of early glaucoma should be considered in the presence of either abnormal GCIPL or RNFL parameters, not ne-cessarily both combined.
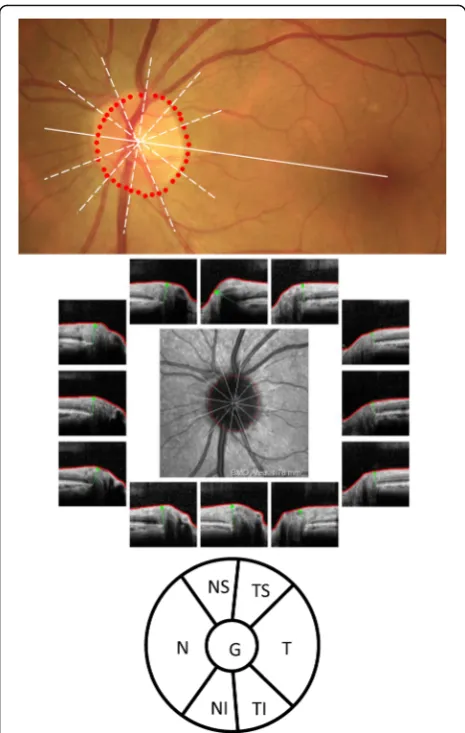
The MDB is a recently described SDOCT three-dimensional (3D) quantitative neuroretinal rim parameter, although it was first mentioned a decade ago [25,26]. It is captured with high-density raster scan (i.e., 193 raster line volume scan) with Spectralis OCT (Heidelberg Engineer-ing GmbH, Heidelberg, Germany) and represents the shortest distance between the internal limiting membrane (ILM) and the Bruch’s membrane/retinal pigmented epi-thelium (BM/RPE) termination [16]. It differs from the MRW, a 3D neuroretinal rim parameter obtained with a low-density ONH scan made of 24 radial lines, defined as the shortest distance between the ILM and the BMO [27]. The MRW uses the BMO to determine the disc margin whereas the MDB uses the RPE/BM complex as disc mar-gin [16,25]. Although by itself it distinguishes normal eyes from eyes with early glaucoma well (area under the curve of the receiver operating characteristics or AUC of 0.952 and sensitivity of 77.4% at 95% specificity for global MDB thickness), AND-Logic combinations of MDB of the inferior, superotemporal, and superonasal sectors, with the inferior quadrant RNFL performed significantly better (AUC: 0.984) than the best combination of RNFL parame-ters (0.966) and all single RNFL parameparame-ters [28]. The model suggested by Gmeiner and colleagues was created by combining each of the 7 Spectralis BMO-MRW parameters (global, temporal superior, nasal superior, nasal, nasal inferior, temporal inferior, and temporal) (Fig.2) to its corresponding RNFL parameter [29], based on the following formula:
BMOMRWþRN FL T hickness ðMean BMOMRW Control=
Mean RN FL T hickness ControlÞ
The combined parameters were compared to single ones for their ability to distinguish healthy subjects and patients with pre-perimetric glaucoma. The overall best multivariable parameter resulted from the combination of global parameters (AUC: 0.849, sensitivity at 90% and 95% specificity: 56% and 42%), which increased the per-formance, but non-significantly, compared to global BMO-MRW (0.821, 52% and 28%) and global RNFL
(0.839, 50% and 44%). This method is, in fact, an AND-Logic strategy, although the combinations are limited to BMO-based parameters of the same location.
Machine learning classifiers and linear discriminant analysis
Imaging data are commonly used in medical decision-making for both diagnosis and treatment and monitor-ing of diseases. Machine learnmonitor-ing classifiers (MLCs) (i.e. linear regression, logistic regression, decision trees, Ran-dom Forest, support vector machines, artificial neural networks) and linear discriminant analysis (LDA) are well-established analytical methods for combining input parameters into discriminant functions for classification of patients into groups. Fang et al., studied 34 eyes with early glaucoma and 42 normal eyes and assessed the discriminating abilities of single ONH, RNFL, and GCC parameters measured with RTVue OCT (Optovue Inc., Fremont, California, USA) [30]. Vertical cup-to-disc ratio (VCDR) (AUC: 0.930 and 79.4% sensitivity at 95%), average RNFL (0.915 and 76.5%) and rim area (0.913 and 61.8%) were the best single discriminants. Their combination using a logistic regression model improved the discriminating ability (0.949 and 82.4%) relative to the best single parameter, but the increase was not sta-tistically significant. The disadvantage of this approach is that the choice of parameters used in the combination ignores other factors that may also contribute to the im-provement of the diagnostic performance. A recent study compared the diagnostic performance of 19 indi-vidual ONH and RNFL Cirrus OCT parameters and a multivariable predictive model using logistic regression with backward elimination technique in a study popula-tion of African Americans (103 healthy and 52 with early glaucoma) [31]. The best combination included age, disc area, and RNFL parameters and the multivariable model was defined as:
0:147þ0:73SQ RN FLþ0:002CH8 RN FL þ0:016CH12 RN FLþ0:045CH1 RN FL þ0:001CH6 RN FLþ2:409Disc Areaþ0:098Age
where SQ is superior quadrant and CH is clock-hour. Despite the multivariable model having an improved performance (AUC: 0.892) compared to the best single RNFL parameters (clock-hour 12: 0.868; inferior quad-rant RNFL: 0.857; and average RNFL: 0.855), the im-provement was not statistically significant. Individual GCIPL parameters were not included in the logistic re-gression analysis. It is unclear whether adding inferotem-poral GCIPL (AUC: 0.936) would have further improved the performance of the combination. In another investi-gation, the diagnostic performances of linear discrimin-ant analysis (LDA) and Classification And Regression
Tree (CART) were compared to those of single Cirrus HD-OCT ONH and RNFL parameters in early glaucoma [32]. Both the CART model (0.99) and the LDA (0.94) discriminated better than any of the single parameters (AUCs: 0.61–0.89). They also had much lower misclassi-fication rates than single parameters. The CART model included thicknesses of the average, superior, inferior, and nasal quadrant RNFL, disc area, VCDR, cup volume, and RNFL symmetry. LDA combined disc area, rim area, average CDR, VCDR, inferior quadrant RNFL, superior quadrant RNFL, and average RNFL in the following equation:
1:56Disc Area−1:83Rim Area−6:21Average CDR þ5:12V CDR−0:022SQ RN FL T hickness
−0:031IQ RN FL T hickness þ0:016Average RN FL T hickness
ONH, peripapillary RNFL, and GCC parameters mea-sured with RTVue were also assessed by Huang et al. for their ability to differentiate normal from glaucomat-ous eyes, as single parameters and after their
combin-ation using LDA [33]. Although glaucomatous eyes
were classified as stage 1 (MD: −5 to −0.01 dB) and
stage 2 (MD:−12 to−5.01 dB) on the Bascom Palmer
Modified Glaucoma Staging System [34], the MD of the group was−3.30 ± 2.64 dB, indicating that they all had early glaucoma[Hodapp, 1993 #464]. Their final linear discriminant function was as follows:
−4:332−0:969Disc Areaþ0:17ST1RN FLþ0:22ST2RN FL
þ0:01N U2RN FLþ0:012IT1RN FL
þ0:048Standard Deviation o f Superior −In f erior Hemisphere GCC
This combination provided an overall better diagnostic performance (AUC: 0.970, sensitivity: 86.3%, and specifi-city: 95.9%) in early glaucoma than the best single vari-ables (0. 919, 81.5%, and 87.8% for average RNFL; 0.871, 75.3% and 90.5% for inferior hemisphere GCC; 0.854, 71.9%, and 91.9% for VCDR). Yoshida et al. also used the random forests classification method to investigate the discrimination between 126 glaucomatous and 84 normal eye using a total of 151 peripapillary RNFL, macular RNFL, and GCIPL parameters measured with
3D-OCT 1000 (Topcon Corp., Tokyo, Japan) [35]. The
method determined that 81 of the 151 parameters (aver-age RNFL; mean, superior and inferior hemiretina macu-lar RNFL; mean, superior and inferior and hemiretina GCIPL; grid macular RNFL in the inferior and superior temporal areas; grid GCIPL in the inferior and superior temporal areas; superior, nasal and inferior quadrant peripapillary RNFL; 30o superotemporal, superonasal, nasal superior, inferior and inferotemporal peripapillary RNFL) were significant predictors of early glaucoma. The diagnostic performance of the random forests
combination (AUC: 0.985, sensitivity: 92.9%, specificity: 96.0%) was significantly larger than that of macular RNFL (AUC: 0.934). While random forests are considered an effective MLC algorithm with higher classification accuracy, its prediction performance beyond the limits of the response values in the training data is weak, particularly when used for regression tasks. Overall, it appears from these studies that combination of single OCT parameters using MLCs and LDA allows incremental diagnostic performance in early glaucoma. The magnitude of the improvement varies from one method to another based on the type of device used; the original parameters entered in the model, and the characteristics of the
population. Table 1 summarizes the main features of
selected combinatorial models discussed below.
The UNC OCT index
MD: −0.7 ± 1.0 dB) than eyes used in the modeling group (MD:−3.19 ± 1.69 dB). The AUC and sensitivity at 95% specificity of the UNC OCT Index were 0.96 and 85.4% in patients with visual field mean deviation≥ −4 dB and 0.95 and 81.7% in those with mean deviation >−2 dB. Relative to the UNC OCT index, the diagnostic perform-ance indices of the best single variables from each ana-tomic area the two ≥ −4 dB group were 0.93 (P= 0.05) and 0.92 (P= 0.06) for VCDR, 0.92 (P= 0.014) and 0.91 (P= 0.03) for average RNFL, and 0.91 (P= 0.009) and 0.90 (P= 0.026) for minimum GCIPL. The sensitivities of the best single parameters were all significantly (allP≤0.008), except for rim rea (P= 0.07). The results of the independent validation confirmed the effectiveness of the UNC OCT Index combinatorial algorithm over that of single OCT parameters in detecting early glaucoma. The algorithm is stable regarding accuracy and computational speed, and allows more OCT and/or non-OCT parameters to be
added as necessary. It is a promising way forward for im-proving the diagnostic performance of OCT information, and it could be a useful tool for clinical decision-making in
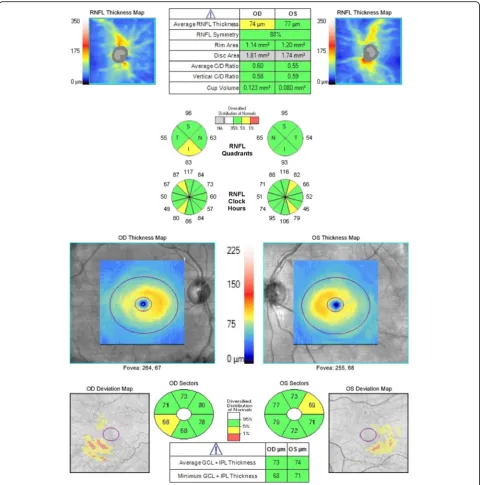
glaucoma practice. Figure 4 shows Cirrus HD-OCT
data obtained in a glaucoma suspect in whom the UNC OCT Index algorithm suggested a high probability that the right eye was likely glaucomatous (predictive prob-ability: 0.768) whereas the left eye was likely non-glaucomatous (predictive probability: 0.087).
The Glaucoma structural diagnostic index (GSDI) The GSDI is a tool developed to improve glaucoma diagnostic accuracy using a combination of SDOCT
ONH, peripapillary RNFL, and GCC parameters [37].
The parameters were measured with RTVue OCT in glaucomatous eyes (n= 236), a reference normal eye popu-lation (n= 105), and a cohort of normal eyes (n= 118). The multivariable logistic model used to construct the
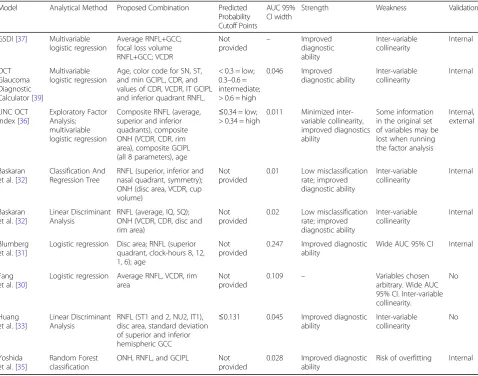
Table 1Summary of main features of models combining OCT parameters for the diagnosis of early glaucoma
Model Analytical Method Proposed Combination Predicted Probability Cutoff Points
AUC 95% CI width
Strength Weakness Validation
GSDI [37] Multivariable logistic regression
Average RNFL+GCC; focal loss volume RNFL+GCC; VCDR Not provided – Improved diagnostic ability Inter-variable collinearity Internal OCT Glaucoma Diagnostic Calculator [39]
Multivariable logistic regression
Age, color code for SN, ST, and min GCIPL, CDR, and values of CDR, VCDR, IT GCIPL and inferior quadrant RNFL.
< 0.3 = low; 0.3–0.6 = intermediate; > 0.6 = high
0.046 Improved diagnostic ability Inter-variable collinearity Internal UNC OCT Index [36]
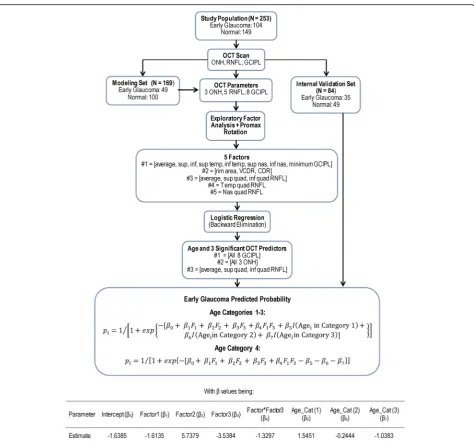
Exploratory Factor Analysis; multivariable logistic regression
Composite RNFL (average, superior and inferior quadrants), composite ONH (VCDR, CDR, rim area), composite GCIPL (all 8 parameters), age
≤0.34 = low; > 0.34 = high
0.011 Minimized inter-variable collinearity, improved diagnostics ability
Some information in the original set of variables may be lost when running the factor analysis
Internal, external
Baskaran et al. [32]
Classification And Regression Tree
RNFL (superior, inferior and nasal quadrant, symmetry); ONH (disc area, VCDR, cup volume)
Not provided
0.01 Low misclassification rate; improved diagnostic ability Inter-variable collinearity Internal Baskaran et al. [32]
Linear Discriminant Analysis
RNFL (average, IQ, SQ); ONH (VCDR, CDR, disc and rim area)
Not provided
0.02 Low misclassification rate; improved diagnostic ability Inter-variable collinearity Internal Blumberg et al. [31]
Logistic regression Disc area; RNFL (superior quadrant, clock-hours 8, 12, 1, 6); age
Not provided
0.247 Improved diagnostic ability
Wide AUC 95% CI Internal
Fang et al. [30]
Logistic regression Average RNFL, VCDR, rim area
Not provided
0.109 – Variables chosen arbitrary. Wide AUC 95% CI. Inter-variable collinearity.
No
Huang et al. [33]
Linear Discriminant Analysis
RNFL (ST1 and 2, NU2, IT1), disc area, standard deviation of superior and inferior hemispheric GCC
≤0.131 0.045 Improved diagnostic ability
Inter-variable collinearity
No
Yoshida et al. [35]
Random Forest classification
ONH, RNFL, and GCIPL Not provided
0.028 Improved diagnostic ability
Risk of overfitting Internal
GSDI identified the following 3 significant predictors: 1) composite overall RNFL + GCC thickness, 2) composite RNFL focal loss volume (FLV) + GCC FLV, and 3) VCDR. The final model function was defined as:
−0:74Composite Overall T hickness
þ0:70Composite FLVþ3:37V CDR−3:69
The overall diagnostic accuracy of the combination of these parameters (0.922) was significantly better than that of the best single parameter (nerve fiber layer global loss volume, NFL GLV: 0.896). Below stage 2 of the Glaucoma Severity Staging 2 (GSS2) [38], which may be
regarded as early glaucoma, the GSDI was at most 0.874 with a sensitivity of 60.7% at 95% specificity although it was not clear how it compared to single variables since their performances at this stage were not provided.
The OCT Glaucoma diagnostic calculator
The OCT Glaucoma Diagnostic Calculator was pro-posed as a tool for the detection of glaucoma regardless of the stage of the disease [39]. It is based on a multivar-iable predictive model that uses a combination of Cirrus HD-OCT ONH, peripapillary RNFL thickness, and macular GCIPL thickness parameters. A total of 17 parameters were evaluated. The development and validation
of this model included data of 500 healthy eyes and a separ-ate group of 187 glaucomatous eyes of all severity stages. The study and validation groups covered 92 and 37 stage 1 glaucomatous eyes based on the GSS2, respectively. Three different models were evaluated and compared, with model #1 using quantitative data only, model #2 qualitative data only, and model #3 a combination of qualitative and
quantitative information. Model #3 proved to be the best and used a combination of age, color classification code for superonasal GCIPL, superotemporal GCIPL, minimum GCIPL and average CDR; thicknesses of inferotemporal GCIPL and inferior quadrant RNFL; and values of average CDR and VCDR. Colors are based on the classification rela-tive to the normarela-tive database and are given scores of 0 for
green (all parameters), 1 for yellow (all parameters), 2 for red (all parameters), and 3 for gray (average CDR). Though details were not provided, it was reported that this model significantly outperformed all single parameters in early glaucoma. The predicted probability of the model 3 is given as:
e^ð0:905þ0:044Age−1:477ðSNGCC¼yellowÞ
−1:190ðSNGCC¼redÞ þ1:403ðSTGCC¼yellowÞ
þ1:095ðSTGCC¼redÞ þ1:455ðMCGC¼yellowÞ
þ1:109ðMCGC¼redÞ þ0:006ðCDAC¼yellowÞ
þ2:231ðCDAC¼redÞ þ0:583ðCDAC¼grayÞ −0:034ITGC−0:035IRNFL−0:099CDAð100Þ
þ0:117VCDð100Þ=ð1þe^ð0:905þ0:044Age −1:477ðSNGCC¼yellowÞ−1:190ðSNGCC¼redÞ
þ1:403ðSTGCC¼yellowÞ þ1:095ðSTGCC¼redÞ
þ1:455ðMCGC¼yellowÞ þ1:109ðMCGC¼redÞ
þ0:006ðCDAC¼yellowÞ þ2:231ðCDAC¼redÞ
þ0:583ðCDAC¼grayÞ−0:034ITGC−0:035IRNFL
−0:099CDAð100Þ þ0:117VCDð100ÞÞÞ
with SNGCC, STGCC, and MCGC being colors of the superonasal, superotemporal, and minimum GCIPL; re-spectively. CDAC is the color of the average CDR; ITGC, IRNFL are values of the inferotemporal GCIPL and infer-ior quadrant RNFL thicknesses, respectively. CDA C/D and CVD are values of the average and vertical CDR, re-spectively. The calculator outputs a probability classifica-tion that ranges between 0.00 and 1.00 and labelled the result as positive (high probability of glaucoma), negative (low probability), or inconclusive (intermediate probabil-ity). This model achieved an AUC of 0.937 and sensitivity of 77.8% at 95% specificity compared to 0.877 and 59.8% (allP< 0.001) for inferotemporal RNFL.
Conclusions and future perspectives
Multiple SDOCT parameters from various ocular ana-tomic areas are now available that clinicians use for dis-tinguishing between diseased and non-diseased subjects, particularly in early stages. The challenge for diagnosing early glaucoma clinically and the difficulty of interpret-ing several parameters that yield conflictinterpret-ing information have been the impetus for investigating various ways to improve diagnosis of early glaucoma while alleviating the clinician’s tasks. A desirable approach has been to combine multiple diagnostic tests or parameters from the same test to obtain an optimal composite diagnostic test with higher sensitivity and specificity that detects the presence of the disease more accurately. This mini-review has outlined how combining information from different structural OCT parameters may be a comple-mentary tool for the diagnosis of early glaucoma. It transpires from this review that: (1) combinatorial models of OCT structural parameters for glaucoma have so far remained research tools, (2) such models for early glaucoma should be prioritized, as the clinical diagnosis
of moderate to advanced glaucoma is generally straight-forward, and (3) combination of single parameters into composite improves the diagnostic ability of OCT in early glaucoma. The improvement should not be judged based on AUC alone, but together with sensitivity, speci-ficity and other diagnostic performance indices. However as of to date, just as there is no agreed-upon unique standard guideline for diagnosing early glaucoma with the aid of single OCT parameters, there is equally no consensus yet on what constitutes the best combinatorial model for OCT parameters. Although some patients with early glaucoma can be diagnosed with a single base-line visit, many of them will be diagnosed after follow-up and detection of progressive glaucomatous changes to the structures affected by the disease even if they remain in the normal range for age. The question for future research is whether OCT combinatorial models may help detect progression earlier than single parame-ters in early glaucoma. Despite a few recent reports to the contrary [13,40–42], it is generally known that glau-comatous structural changes are more difficult to detect in moderate to advanced disease. Thus, future research may also need to investigate whether combinatorial models may improve detection of structural progression in moderate to advanced glaucoma. It is an improve-ment in detection of early glaucoma and progression throughout the course of the disease that will allow earl-ier diagnosis and timely initiation or adjustment of treat-ment, to reduce the burden of glaucoma-related visual loss and its consequences.
Abbreviations
AIC:Akaike’s Information Criterion; BM: Bruch’s membrane; CART: Classification and regression tree; CDR: Cup-to-disc ratio;
EFA: Exploratory factor analysis; FLV: Focal loss volume; GCC: Ganglion cell complex; GCIPL: Ganglion cell-inner plexiform layer; GLV: Global loss volume; GSS: Glaucoma staging system; ILM: Internal limiting membrane;
LCCI: Lamina cribrosa curvature index; LCD: Lamina cribrosa depth; LDA: Linear discriminant analysis; MD: Mean deviation; MDB: Minimum distance band; MLC: Machine learning classifier; NFL: Nerve fiber layer; NLR: Negative likelihood ratio; ONH: Optic nerve head; PIL: Prediction interval length; PRL: Positive likelihood ratio; RNFL: Retinal nerve fiber layer; RPE: Retinal pigmented epithelium; SDOCT: Spectral domain optical coherence tomography; UNC: University of North Carolina
Acknowledgments
Not applicable
Funding
This publication was supported by the Department of Ophthalmology, University of North Carolina at Chapel Hill, USA, and by CTSA Grant UL1 TR001863 from the National Center for Advancing Translational Science, Yale University, New Haven, Connecticut, USA. These institutions had no role in the design, data collection, and drafting of the manuscript.
Availability of data and materials
Not applicable
Authors’contributions
Competing interests
JCM, JLW, and DLB have a patent licensed to Carl Zeiss Meditec, Inc.
Author details
1Department of Ophthalmology, School of Medicine, University of North
Carolina at Chapel Hill, Chapel Hill, NC, USA.2Department of Biostatistics,
Yale University, New Haven, CT, USA.
Received: 11 January 2018 Accepted: 1 April 2018
References
1. Heijl A, Leske MC, Bengtsson B, Hyman L, Bengtsson B, Hussein M, et al. Reduction of Intraocular Pressure and Glaucoma Progression: Results From the Early Manifest Glaucoma Trial. Arch Ophthalmol. 2002;120:1268–79. 2. Vizzeri G, Kjaergaard SM, Rao HL, Zangwill LM. Role of imaging in glaucoma
diagnosis and follow-up. Indian J Ophthalmol. 2011;Suppl 59:S59–68. 3. Enders P, Bremen A, Schaub F, Hermann MM, Diestelhorst M, Dietlein T, et
al. Intraday Repeatability of Bruch's Membrane Opening-Based Neuroretinal Rim Measurements. Invest Ophthalmol Vis Sci. 2017;58:5195–200. 4. Garas A, Vargha P, Holló G. Reproducibility of retinal nerve fiber layer and
macular thickness measurement with the RTVue-100 optical coherence tomograph. Ophthalmology. 2010;117:738–46.
5. Mwanza JC, Chang RT, Budenz DL, Durbin MK, Gendy MG, Shi W, et al. Reproducibility of peripapillary retinal nerve fiber layer thickness and optic nerve head parameters measured with cirrus HD-OCT in glaucomatous eyes. Invest Ophthalmol Vis Sci. 2010;51:5724–30.
6. Mwanza JC, Oakley JD, Budenz DL, Chang RT, Knight OJ, Feuer WJ. Macular ganglion cell-inner plexiform layer: automated detection and thickness reproducibility with spectral domain-optical coherence tomography in glaucoma. Invest Ophthalmol Vis Sci. 2011;52:8323–9.
7. Park K, Kim J, Lee J. Reproducibility of Bruch's Membrane Opening-Minimum Rim Width Measurements With Spectral Domain Optical Coherence Tomography. J Glaucoma. 2017;6:1041–50.
8. Reis ASC, Zangalli CES, Abe RY, Silva AL, Vianna JR, Vasconcellos JPC, et al. Intra- and interobserver reproducibility of Bruch's membrane opening minimum rim width measurements with spectral domain optical coherence tomography. Acta Ophthalmol. 2017;95:e548–55.
9. Wu H, de Boer JF, Chen TC. Reproducibility of retinal nerve fiber layer thickness measurements using spectral domain optical coherence tomography. J Glaucoma. 2011;20:470–6.
10. Weinreb RN, Friedman DS, Fechtner RD, Cioffi GA, Coleman AL, Girkin CA, et al. Risk assessment in the management of patients with ocular hypertension. Am J Ophthalmol. 2004;138:458–67.
11. Quigley HA, Katz J, Derick RJ, Gilbert D, Sommer A. An evaluation of optic disc and nerve fiber layer examinations in monitoring progression of early glaucoma damage. Ophthalmology. 1992;99:19–28.
12. Sommer A, Katz J, Quigley HA, Miller NR, Robin AL, Richter RC, et al. Clinically detectable nerve fiber atrophy precedes the onset of glaucomatous field loss. Arch Ophthalmol. 1991;109:77–83.
13. Zhang X, Dastiridou A, Francis BA, Tan O, Varma R, Greenfield DS, et al. Comparison of Glaucoma Progression Detection by Optical Coherence Tomography and Visual Field. Am J Ophthalmol. 2017;184:63–74. 14. Kim DW, Jeoung JW, Kim YW, Girard MJ, Mari JM, Kim YK, et al. Prelamina
and Lamina Cribrosa in Glaucoma Patients With Unilateral Visual Field Loss. Invest Ophthalmol Vis Sci. 2016;57:1662–70.
15. Kim YW, Jeoung JW, Kim DW, Girard MJ, Mari JM, Park KH, et al. Clinical Assessment of Lamina Cribrosa Curvature in Eyes With Primary Open-Angle Glaucoma. PLoS One. 2016;11:e0150260.
16. Tsikata E, Lee R, Shieh E, Simavli H, Que CJ, Guo R, et al. Comprehensive Three-Dimensional Analysis of the Neuroretinal Rim in Glaucoma Using High-Density Spectral-Domain Optical Coherence Tomography Volume Scans. Invest Ophthalmol Vis Sci. 2016;57:5498–508.
17. Aref AA, Sayyad FE, Mwanza JC, Feuer WJ, Budenz DL. Diagnostic specificities of retinal nerve fiber layer, optic nerve head, and macular ganglion cell-inner plexiform layer measurements in myopic eyes. J Glaucoma. 2014;23:487–93.
18. Hwang YH, Jeong YC, Kim HK, Sohn YH. Macular ganglion cell analysis for early detection of glaucoma. Ophthalmology. 2014;121:1508–15. 19. Hwang YH, Kim YY, Kim HK, Sohn YH. Ability of cirrus high-definition
spectral-domain optical coherence tomography clock-hour, deviation, and
thickness maps in detecting photographic retinal nerve fiber layer abnormalities. Ophthalmology. 2013;120:1380–7.
20. Kim KE, Jeoung JW, Park KH, Kim DM, Kim SH. Diagnostic classification of macular ganglion cell and retinal nerve fiber layer analysis: differentiation of false-positives from glaucoma. Ophthalmology. 2015;122:502–10.
21. Leal-Fonseca M, Rebolleda G, Oblanca N, Moreno-Montañes J, Muñoz-negrete FJ. A comparison of false positives in retinal nerve fiber layer, optic nerve head and macular ganglion cell-inner plexiform layer from two spectral-domain optical coherence tomography devices. Graefes Arch Clin Exp Ophthalmol. 2014;252:321–30.
22. Mwanza JC, Sayyad FE, Aref AA, Budenz DL. Rates of abnormal retinal nerve fiber layer and ganglion cell layer OCT scans in healthy myopic eyes: Cirrus versus RTVue. Ophthalmic Surg Lasers Imaging. 2012;43(Suppl 6):S67–74. 23. Mwanza JC, Budenz DL, Godfrey DG, Neelakantan A, Sayyad FE, Chang RT,
et al. Diagnostic performance of optical coherence tomography ganglion cell–inner plexiform layer thickness measurements in early glaucoma. Ophthalmology. 2014;121:849–54.
24. Jeoung JW, Choi YJ, Park KH, Kim DM. Macular ganglion cell imaging study: glaucoma diagnostic accuracy of spectral-domain optical coherence tomography. Invest Ophthalmol Vis Sci. 2013;54:4422–9.
25. Chen TC. Spectral domain optical coherence tomography in glaucoma: qualitative and quantitative analysis of the optic nerve head and retinal nerve fiber layer (an AOS thesis). Trans Am Ophthalmol Soc. 2009;107: 254–81.
26. Povazay B, Hofer B, Hermann B, Unterhuber A, Morgan JE, Glittenberg C, et al. Minimum distance mapping using three-dimensional optical coherence tomography for glaucoma diagnosis. J Biomed Opt. 2007;12: 041204.
27. Reis AS, O'Leary N, Yang H, Sharpe GP, Nicolela MT, Burgoyne CF, et al. Influence of clinically invisible, but optical coherence tomography detected, optic disc margin anatomy on neuroretinal rim evaluation. Invest Ophthalmol Vis Sci. 2012;53:1852–60.
28. Shieh E, Lee R, Que C, Srinivasan V, Guo R, DeLuna R, et al. Diagnostic Performance of a Novel Three-Dimensional Neuroretinal Rim Parameter for Glaucoma Using High-Density Volume Scans. Am J Ophthalmol. 2016;169: 168–78.
29. Gmeiner JM, Schrems WA, Mardin CY, Laemmer R, Kruse FE, Schrems-Hoesl LM. Comparison of Bruch's Membrane Opening Minimum Rim Width and Peripapillary Retinal Nerve Fiber Layer Thickness in Early Glaucoma Assessment. Invest Ophthalmol Vis Sci. 2016;57:575–84.
30. Fang Y, Pan YZ, Li M, Qiao RH, Cai Y. Diagnostic capability of Fourier-Domain optical coherence tomography in early primary open angle glaucoma. Chin Med J (Engl). 2010;123:2045–50.
31. Blumberg DM, Dale E, Pensec N, Cioffi GA, Radcliffe N, Pham M, et al. Discrimination of Glaucoma Patients From Healthy Individuals Using Combined Parameters From Spectral-domain Optical Coherence Tomography in an African American Population. J Glaucoma. 2016;25:e196–203.
32. Baskaran M, Ong EL, Li JL, Cheung CY, Chen D, Perera SA, et al. Classification algorithms enhance the discrimination of glaucoma from normal eyes using high-definition optical coherence tomography. Invest Ophthalmol Vis Sci. 2012;53:2314–20.
33. Huang JY, Pekmezci M, Mesiwala N, Kao A, Lin S. Diagnostic power of optic disc morphology, peripapillary retinal nerve fiber layer thickness, and macular inner retinal layer thickness in glaucoma diagnosis with fourier-domain optical coherence tomography. J Glaucoma. 2011;20:87–94. 34. Mills RP, Budenz DL, Lee PP, Noecker RJ, Walt JG, Siegartel LR, et al.
Categorizing the stage of glaucoma from pre-diagnosis to end-stage disease. Am J Ophthalmol. 2006;141:24–30.
35. Yoshida T, Iwase A, Hirasawa H, Murata H, Mayama C, Araie M, et al. Discriminating between glaucoma and normal eyes using optical coherence tomography and the 'Random Forests' classifier. PLoS One. 2014; 9:e106117.
36. Mwanza JC, Warren JL, Budenz DL; Ganglion cell analysis study group. Combining spectral domain optical coherence tomography structural parameters for the diagnosis of glaucoma with early visual field loss. Invest Ophthalmol Vis Sci. 2013;54:8393–400.
38. Brusini P, Filacorda S. Enhanced Glaucoma Staging System (GSS 2) for classifying functional damage in glaucoma. J Glaucoma. 2006;15:40–6. 39. Larrosa JM, Moreno-Montañés J, Martinez-de-la-Casa JM, Polo V,
Velázquez-Villoria Á, Berrozpe C, et al. A Diagnostic Calculator for Detecting Glaucoma on the Basis of Retinal Nerve Fiber Layer, Optic Disc, and Retinal Ganglion Cell Analysis by Optical Coherence Tomography. Invest Ophthalmol Vis Sci. 2015;56:6788–95.
40. Belghith A, Medeiros FA, Bowd C, Liebmann JM, Girkin CA, Weinreb RN, et al. Structural Change Can Be Detected in Advanced-Glaucoma Eyes. Invest Ophthalmol Vis Sci. 2016;57:511–8.
41. Bowd C, Zangwill LM, Weinreb RN, Medeiros FA, Belghith A. Estimating Optical Coherence Tomography Structural Measurement Floors to Improve Detection of Progression in Advanced Glaucoma. Am J Ophthalmol. 2017; 175:37–44.