VOLUME 36, ARTICLE 30, PAGES 863
,
892
PUBLISHED 21 MARCH 2017
http://www.demographic-research.org/Volumes/Vol36/30/ DOI: 10.4054/DemRes.2017.36.30
Research Article
Functional limitation trajectories and their
determinants among women in the Philippines
Zachary Zimmer
Feinian Chen
Luoman Bao
Tita Lorna L. Perez
Nanette L. Mayol
Paulita L. Duazo
© 2017 Zimmer, Bao, Mayol, Chen, Perez & Duazo.
This open-access work is published under the terms of the Creative Commons Attribution NonCommercial License 2.0 Germany, which permits use, reproduction & distribution in any medium for non-commercial purposes, provided the original author(s) and source are given credit.
1 Introduction 864
1.1 Population aging and functional limitation 864
1.2 Predictors of functional limitation trajectories 866
2 Data and methods 868
2.1 Sample 868
2.2 Functional limitation 869
2.3 Predictors 869
2.4 Analytical strategy 871
3 Results 873
3.1 Functional limitation prevalence 873
3.2 Functional limitation trajectories 877
3.3 Predictors of functional limitation trajectories 879
4 Discussion and conclusion 880
5 Acknowledgments 884
Functional limitation trajectories and their determinants among
women in the Philippines
Zachary Zimmer1
Luoman Bao2
Nanette L. Mayol3, 5
Feinian Chen4
Tita Lorna L. Perez5
Paulita L. Duazo5
Abstract
BACKGROUND
Limited evidence exists regarding how functional limitation patterns of women in developing countries unfold through midlife and into old age, a critical period during which the tendency to develop severe problems is fomented.
OBJECTIVE
Functional limitation prevalence and patterns through midlife into early old age, and their determinants, are examined among women in the Philippines.
METHODS
Data from the Cebu Longitudinal Health and Nutrition Study are monitored from 1994 to 2015. Patterns are categorized using group-based trajectory modeling. Predictors of group membership are modeled.
RESULTS
About half responding to all survey waves report functional limitation at least once over the study period. Movements in and out of functional limitation states are common. Between age 30 and 70, trajectories are categorized into four groups: 1) robust, 2) late
1 Family Studies and Gerontology, Canada Research Chair and Director, Global Aging and Community
Initiative, Mount Saint Vincent University, Halifax, Nova Scotia B3M 2J6, Canada. E-Mail:[email protected]. Website:https://globalagingandcommunity.com
2 Department of Sociology, California State University, Los Angeles, USA.
3 Department of Anthropology, Sociology and History, University of San Carlos, Cebu, Philippines. 4 Department of Sociology, University of Maryland, College Park, USA.
onset, 3) early onset, and 4) recovery. Being married, living in a nuclear household, higher successful birth ratio, and higher education associate with favorable trajectories. More births, higher age at first birth, wealth, and urbanicity associate with less favorable trajectories.
CONCLUSION
Many possible routes into and out of functional limitation exist. The manifold patterns can be grouped into common trajectories. A number of earlier life characteristics associate with these trajectories.
CONTRIBUTION
This is the first analysis to ascertain common functional limitation trajectories and earlier life predictors among women as they age in a high fertility developing country setting. Recognizing these is an important step toward understanding global health given aging of the population and the likelihood of functional problems developing in women as they move into old age.
1. Introduction
1.1 Population aging and functional limitation
High fertility in past generations coupled with recent declines in mortality is resulting in a precipitous growth in the global population now moving into later adult and early old age (Lee 2011; UNFPA and HelpAge International 2012; Zimmer and McDaniel 2013). Because the incidence and prevalence of physical functioning disorders increases with age, this aging of the population goes hand in hand with growing numbers living with disability and functional limitation. Consequently, recognizing how functional health problems develop and evolve over time and what factors associate with healthy functional trajectories is consequently critical for understanding broad trends in global health.
rates of population aging (Kinsella and Phillips 2005; World Health Organization 2011, 2015). Further, while research on sex differences in functionality is fairly nascent in middle and lower income countries, a modest amount of investigation suggests that women in these settings carry a substantial disability burden (Miszkurka et al. 2012).
Utilizing 21 years of follow-up panel data of women in the Philippines, this current set of analyses has three aims. The first is to describe prevalence of functional limitation among the sample being studied. Next is a categorization of common patterns or trajectories in functional limitation experienced by these women as they age through middle life and into early old age. The third is to examine potential predictors of more versus less favorable trajectories.
The women studied are part of the Cebu Longitudinal Health and Nutrition Survey (CLHNS). Evidence suggests that the period after childbirth is particularly consequential for the development of functional problems in later life (Adair et al. 2011; Murray et al. 2011). CLHNS data involves a cohort of women that were pregnant in 1983, gave birth that year or early in 1984, and have been monitored until 2015. This makes CLHNS data especially relevant. Cebu is a province of the Philippines that was characterized by relatively high fertility at the time these women were recruited. Because they were pregnant during enlistment, the sample is by selection a higher fertility cohort than the general population. There are no comparable samples of childbearing women followed for this length of time and no research that examines the unfolding of functional limitations for women aging from mid-age to early old age. This data therefore provides a singular opportunity to examine long-term patterns in functional limitation of women in a developing country setting during a critical period of their lives.
1.2 Predictors of functional limitation trajectories
After establishing common trajectories in functional limitation, the current study will examine predictors of these patterns, seeking to determine characteristics associated with more and less healthy trajectories. The CLHNS allows for a number of potential predictors measured at or near the initiation of the study, permitting examination of the association of earlier life characteristics and later life functional health. The predictors included are discussed in this section along with some preliminary ideas about their likely effects.
Available predictors are divided into four domains. The first is demographic characteristics. Besides a woman’s age, this study considers marital disruption and household type. Marital history and transitions have been connected to health outcomes particularly through stress and social support (Hughes and Waite 2009; Williams and Umberson 2004). A study of women at ages similar to the current sample indicated evidence of health deterioration after the death of a spouse (Wilcox et al. 2003). Nearly all women in the current study were married at first observation. Marital status at final observation indicates a marital disruption. Because the Philippines has the distinctive characteristic of not legalizing divorce, a disruption almost always means that the spouse died and the woman being observed is a widow. Household type is defined as nuclear versus extended. Extended households generally are larger in size. While it has not been studied often, household type and size earlier in life has been shown to associate with health. One notion is that women in nuclear households are more likely to be autonomous, which has in turn been found to relate to maternal health (McCarthy and Maine 1992).
The second domain includes several childbearing or reproductive characteristics: total number of live births, ratio of successful births to total pregnancies, and age at first birth. Studies have linked these to a variety of later life health outcomes (Grundy and Tomassini 2005; Hanson, Smith, and Zimmer 2015; Kvåle, Heuch, and Nillsen 1994; Smith et al. 2009; Spence 2008). With very few exceptions (Yi and Vaupel 2004), these studies have considered samples in higher income countries. Older age at first birth has been shown to associate with opportunities for education and employment. Earlier parenthood restricts such opportunities with deleterious outcomes for health. In contrast, early pregnancy has been shown to have some health advantages such as being protective for breast cancer (MacMahon, Cole, and Brown 1973). The general health of a mother is thought to associate with fecundability and thus both total number of live births and a higher ratio of births brought to term versus total pregnancies (Waldron, Weiss, and Hughes 1998). Higher ratios may also indicate more protective living environments (Hawkes 2010; Uhlenberg and Cooney 1990).
education in earlier life have detrimental accumulative impacts throughout, while also associating with diminished opportunities and less favorable socioeconomic conditions. (Galobardes, Lynch, and Davey Smith 2004; Luo and Waite 2005; Pudrovska and Anikputa 2014; Ross and Wu 1996). While the current data does not contain measures of the respondent’s childhood (SES), there are measures of SES at the time of her childbearing. Along with individual measures of SES, evidence suggests community level characteristics are consequential (Wen, Hawkley, and Cacioppo 2006; Wight et al. 2008). Communities with more amenities and resources are healthier environments in which to age. In the current study a measure of urbanicity, which quantifies the concentration of amenities typically found in urban communities, is used as a community measure of SES.
Finally, the study considers three measures of health status: having a chronic condition, body mass index (BMI), and self-rated health. Midlife health has been shown to be associated with and have lingering effects on functional health into old age (Ben Shlomo and Kuh 2002; Rantanen et al. 1999; Reilly and Kelly 2011; Willis et al. 2012). Although it is possible to recover from earlier life ailments, poor health in early life is a sign of weak physical condition. Poor health in early life may interact with chronic conditions that accumulate throughout life. Earlier life BMI has been shown to be a clear predictor of later life health, relating to such conditions as heart disease and diabetes as well as general functional disorders (Himes 2000; Reynolds, Saito, and Crimmins 2005; Tirosh et al. 2011). Self-rated health is a global indicator of health status that can encapsulate a host of issues not captured by BMI and chronic conditions (Idler and Benyami 1997; Jylha 2009).
2. Data and methods
2.1 Sample
CLHNS was launched in 1983 with a baseline sample of about 3,000 women, all of whom lived in Metropolitan Cebu, Philippines and all of whom gave birth between May 1, 1983 and April 30, 1984 (Adair et al. 2011). Metro Cebu is the second largest metropolitan area in the Philippines next to Metro Manila. In 1983 the area contained 270 administrative units or ‘barangays’ which consisted of both rural villages and urban neighborhoods. Sampling involved a single stage cluster design beginning with a random selection of 17 urban and 16 rural barangays. In each barangay, households were enumerated and all pregnant women were asked to take part in the study. There was less than a 4% refusal rate. CLHNS data has been employed for hundreds of published analyses (Several important examples include: Adair and Cole 2003; Adair, Popkin, and Guilkey 1993; Croteau-Chonka et al. 2011; McDade et al. 2001).
Study participants were followed over time with waves of data collection taking place every several years. In 1994 functional limitation items were collected for the first time, making this Wave 1 for the current analysis. Waves 2 to 6 are based on subsequent data collected in 1998, 2002, 2005, 2012, and 2015. As such, functional limitation items were observed among this panel of women over a 21-year period. There was a 2007 wave but it was dropped because analyses indicated this wave was anomalous, likely a function of the fact that it was a ‘tracking’ survey rather than a full survey and procedures for data collection, coding, cleaning, and editing differed from other waves.
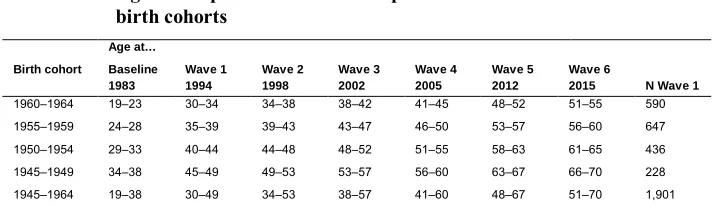
more valid observations in the sample. Table 1 shows the number of observations at Wave 1, dividing the sample into four birth cohorts, and the ages of the women at each observation if they survived. The youngest person in the sample was age 30 when first observed and 51 when last observed; the oldest person was 49 when first observed and 70 when last observed.
Table 1: Age of sample at data collection points and N at Wave 1 for four birth cohorts
Age at…
Birth cohort Baseline 1983
Wave 1 1994
Wave 2 1998
Wave 3 2002
Wave 4 2005
Wave 5 2012
Wave 6
2015 N Wave 1
1960‒1964 19‒23 30‒34 34‒38 38‒42 41‒45 48‒52 51‒55 590 1955‒1959 24‒28 35‒39 39‒43 43‒47 46‒50 53‒57 56‒60 647 1950‒1954 29‒33 40‒44 44‒48 48‒52 51‒55 58‒63 61‒65 436 1945‒1949 34‒38 45‒49 49‒53 53‒57 56‒60 63‒67 66‒70 228 1945‒1964 19‒38 30‒49 34‒53 38‒57 41‒60 48‒67 51‒70 1,901
2.2 Functional limitation
Functional limitation is recorded across six waves using items that asked women if they were able to do the following without any difficulty: walk a distance of one kilometer, climb a flight of stairs or walk up a hill, and carry a weight of 5 kg for a short distance. These items compare well with studies of older persons around the world often employed for the purpose of determining rates and patterns of functional limitation (e.g., Freedman, Martin, and Schoeni 2002; Nogueira and Reis 2014; Ofstedal et al. 2007). In each wave, respondents are coded dichotomously as reporting or not reporting difficulty with at least one task.
2.3 Predictors
in 1983, measures from the baseline survey are, in fact, direct non-retrospective indicators of earlier life characteristics.
Besides age, the demographic domain consists of marital status at Wave 6 and household type at baseline. Nearly all participants were married when they gave birth in 1983/1984. Marital status at Wave 6 therefore indicates whether a marital disruption occurred before the end of the observation period. With no divorce in the Philippines, not married at Wave 6 is usually indicative of widowhood. Household type is dichotomized into nuclear (consisting of respondent and/or spouse and children) or extended.
The childbearing domain includes the total number of live births measured at Wave 6, the ratio of successful births to total lifetime pregnancies measured at Wave 6, and age of the woman at time of birth of her first child determined at baseline.
The SES domain includes respondent’s education at Wave 1, household wealth measured at baseline, and urbanicity of barangay measured at baseline. Education is categorized as elementary or less (0 to 6 years), high school (7 to 10 years), and college (11 or more years). With a technique popularized using household data from Demographic and Health Surveys, wealth is a composite index measure that is a linear sum of assets owned or not owned by the household, with each asset weighted by a Principal Component Analysis (Filmer and Pritchett 2001; Fry, Firestone, and Charkraboty 2014). The composite is calculated from 26 assets such as a car, television, and cookware. The index is normalized to have a mean of zero and a standard deviation of one. The urbanicity score is based on the work of Dahly and Adair (2007) who used CLHNS to quantify the urban environment. The measure is at the level of the barangay and is based on population density plus a collection of amenities categorized into communication (mail, newspaper, telephone, cell phone, internet, and cable service), education (primary, secondary, vocational schools, and colleges), transportation (bus, jeepney, and taxi service classified as continuous and daily, and paved roadways), health (hospital, private medical, pharmacies, maternal health clinic, family planning clinic, puericulture center, and rural health unit) and markets (grocery store, gas station, and drug store). The scale has been tested for reliability and validity and against a more standard urban/rural dichotomy (Dahly and Adair 2007). A higher score indicates more amenities within the barangay and therefore is a proxy of both urbanicity and community level SES.
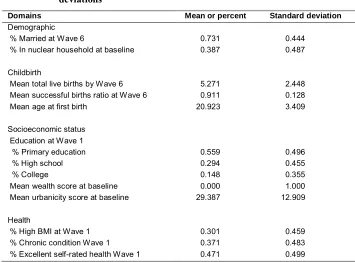
three-point scale: poor, good, and excellent. Poor is an infrequent response and therefore the measure is dichotomized into excellent versus good or poor. Table 2 provides descriptive statistics for predictors.
Table 2: Descriptive statistics for predictors showing means and standard deviations1
Domains Mean or percent Standard deviation
Demographic
% Married at Wave 6 0.731 0.444
% In nuclear household at baseline 0.387 0.487
Childbirth
Mean total live births by Wave 6 5.271 2.448
Mean successful births ratio at Wave 6 0.911 0.128
Mean age at first birth 20.923 3.409
Socioeconomic status Education at Wave 1
% Primary education 0.559 0.496
% High school 0.294 0.455
% College 0.148 0.355
Mean wealth score at baseline 0.000 1.000
Mean urbanicity score at baseline 29.387 12.909
Health
% High BMI at Wave 1 0.301 0.459
% Chronic condition Wave 1 0.371 0.483
% Excellent self-rated health Wave 1 0.471 0.499
1 Means for dichotomous variables are also proportions.
2.4 Analytical strategy
The first analytical stage is a description of functional limitation prevalence of the sample over time. Functional limitation prevalence is examined for different birth cohorts based on age at first observation at Wave 1 in 1994 and across waves.
grouped into a category of ‘robust’ women; others will have limitations in anywhere from one to all six waves. Given the dichotomous measurement of functional limitation (i.e., has or does not have a functional limitation), the number of possible distinct patterns of onset, recovery, and progression of functional limitation for those that respond to all six waves is equal to 26 or 64.
Preliminary analyses show that almost all possible sequences of movements into and out of functional limitation over time and age are possible and therefore summarizing common patterns is complex. About 48% of respondents have no limitations at any wave, but among the other 52%, almost all possible trajectories are reported. For instance, 158 women out of the sample of 1,901 respond in each of the six waves and report limitation in two waves. Of these, 32 report limitations in Waves 5 and 6, 8 report limitations in Waves 4 and 6, 7 report limitations in Waves 3 and 6, and so on.
In order to make sense of this variation and to determine categories to use in the next analytical stage, it is necessary to cluster individuals into groups representing similar patterns or trajectories over time. One way of doing this would be subjectively establishing a priori typologies (for instance, those without limitations at any wave; with limitations in early waves; with limitations in late waves; with limitations in both early and late waves). While such a strategy may result in ‘sensible’ groups, there are disadvantages. Subjective categorization makes it difficult to incorporate those dying or missing observations, meaning the sample size is reduced in a non-random way; subjective categorization cannot possibly consider all the available data but rather usually requires waves to be clumped; using subjective categorization there is no test for affirming the existence of each group or for estimating the probabilities of being in one group versus another.
current data). Parameters are assumed to have a logistic distribution since the dependent variable, functional limitation, has values 0 and 1. Outputs include the number of groups that best describe the data, parameters that determine the shape of the trajectory by age, and the proportion of the sample that fits into each group. Like other procedures that cluster or group observations or indicators, the determination of number of groups is partially based on pragmatic interpretation and partially on fit statistics. In this case, they include Bayesian Information Criterion (BIC) and post-estimation procedures. The GBTM approach used here allows the cause of missing observations to be distinguished as due to death or simply missing as long as ‘alive and missing’ and ‘deceased’ are not reported for the same person across different waves (Haviland, Jones, and Nagin 2011). Therefore, the few respondents with missing observations followed by a known death are deleted from the analysis (89 cases).
After common trajectory groups are defined, membership assignment is used as a dependent variable in the third stage, which uses a multinomial regression to estimate the association between earlier life predictors and functional limitation trajectory. The GBTM approach provides posterior probabilities, which is the chance that each individual belongs to each group. Individuals are assigned to the group for which they have the highest posterior probability. Since the probability of fitting into a particular group is not always 100%, there is the possibility of error. To assure unbiased standard errors in the regression procedure, weights are constructed equal to the posterior probability. Two models are tested. The first includes all predictors except for the health variables (BMI, chronic conditions, and self-rated health). The second adds the health variables. The reason for two models is that the health characteristics are measured at Wave 1 and are not necessarily exogenous to group membership.
3. Results
3.1 Functional limitation prevalence
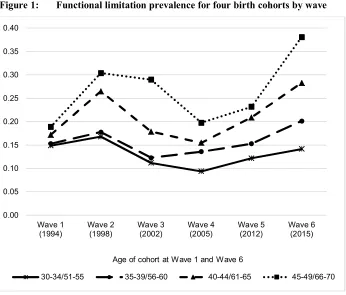
differences across age groups are not very pronounced, ranging from 0.15 for the youngest group to 0.19 for the oldest. At Wave 6 differences are much wider. The prevalence of limitation in Wave 6 is 0.14 for those 51 to 55; 0.20 for those 56 to 60; 0.28 for those 61 to 65; and 0.38 for those 66 to 70.
Figure 1: Functional limitation prevalence for four birth cohorts by wave
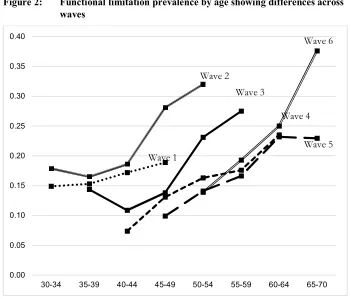
An expectation might be that over time prevalence would increase steadily for each cohort, since over time those in the cohort are aging. However, this is not necessarily the case over the first few waves. The reason is that there is an underlying trend towards lower prevalence of functional limitation from wave to wave. This is shown in Figure 2, which plots prevalence by age in five-year groups, using stacked person-wave observations wherein each measure of age and functional limitation at each wave is considered as a single observation. The sample in Wave 1 falls into four five-year age groups (30 to 34, 35 to 39, 40 to 44, and 45 to 49). As more waves of data are collected, the age range of the women gets older. The figure demonstrates that
0.00 0.05 0.10 0.15 0.20 0.25 0.30 0.35 0.40
Wave 1 (1994)
Wave 2 (1998)
Wave 3 (2002)
Wave 4 (2005)
Wave 5 (2012)
Wave 6 (2015)
30-34/51-55 35-39/56-60 40-44/61-65 45-49/66-70
regardless of wave there is a sharp increase in the tendency to report a limitation at higher ages. But, there is also a general trend toward lower prevalence as time passes from Wave 1 until Wave 6 (Wave 6 seems to be the exception). Take, for example, the age group 45 to 49, who appear in five waves. The prevalence of functional limitation from Wave 1 onward for women of this age is .19, .28, .14, .14, and .10 respectively. As another example, women age 50 to 54, who began appearing in the data in Wave 2, have prevalence respectively across waves of .32, .23, .16, .14, and .14 by Wave 6.
Figure 2: Functional limitation prevalence by age showing differences across waves
The trend of decreasing prevalence over time was confirmed in a supplementary logistic regression predicting functional limitation probability using stacked person-wave observations. Adjusting for age, prevalence is highest in Waves 1 and 2, significantly lower in Waves 3 and 4, and significantly lower again in Waves 5 and 6.
0.00 0.05 0.10 0.15 0.20 0.25 0.30 0.35 0.40
30-34 35-39 40-44 45-49 50-54 55-59 60-64 65-70
Wave 1
Wave 2
Wave 3
Wave 4
At the same time, adjusting for wave, the age of the mother is a significant predictor of having a functional limitation with older age resulting in higher prevalence.
Table 3: Distribution of number of waves in which a functional limitation is reported for four birth cohorts among those observed all six waves
Birth cohorts Age at
Wave 1/Wave 6 30‒34/51‒55 35‒39/56‒60 40‒44/61‒65 45‒49/66‒70 Total
N 377 437 283 148 1,245
Number of waves in which a limitation is reported
0 55.4 50.3 38.9 35.1 47.5
1 26.0 24.9 26.2 25.0 25.5
2 9.3 12.6 15.2 16.9 12.7
3 4.5 7.8 10.6 14.2 8.2
4 3.2 2.7 5.7 3.4 3.6
5 1.3 1.1 2.5 4.1 1.8
6 0.3 0.5 1.1 1.4 0.6
Total 100.0 100.0 100.0 100.0 100.0
N died before final wave (% of total) 22 (3.7) 24 (3.7) 26 (6.0) 20 (8.8) 92 (4.8)
N missing one+ wave (% of total) 191 (32.4) 186 (28.8) 127 (29.1) 60 (26.3) 554 (29.7)
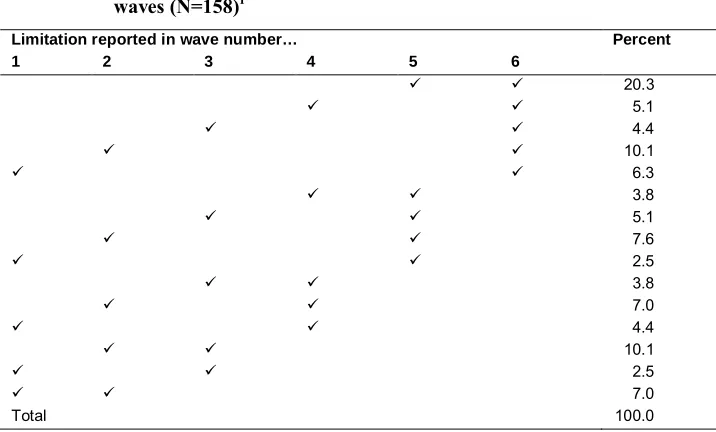
Prevalence is examined further in Table 3, which shows the percent distribution of the number of waves in which individuals report limitations. Since those dropping out due to death or missing at any wave are not at risk of having limitations in every wave, these cases are dropped. The number dropped due to death or missing observations is also reported in the last two rows of the table. The percent that are observed without limitation in all six waves is 55.4, 50.3, 38.9, and 35.1 for the four birth cohorts, which again shows that older women are less likely to be limitation free. Increasingly smaller percentages report limitations in an increasingly greater number of waves, with the tendency to report limitations in more waves being higher for older women.
earlier waves and that recovery was experienced at some point. For instance, the second largest proportion consists of those that report a limitation in Wave 2 and then not again until Wave 6 (10.1%). Some report functional limitation in the first two waves and then not again (7.0%). While two limitations are used for heuristic purposes, the same degree of variation is found for those reporting any number of limitations over time.
Table 4: Distribution of patterns of functional limitation by wave for those reporting limitations in two waves among those observed all six waves (N=158)1
Limitation reported in wave number… Percent
1 2 3 4 5 6
20.3
5.1
4.4
10.1
6.3
3.8
5.1
7.6
2.5
3.8
7.0
4.4
10.1
2.5
7.0
Total 100.0
1 Check marks used to indicate the wave in which a limitation is reported
3.2 Functional limitation trajectories
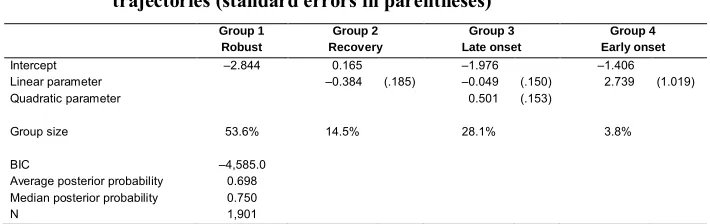
trajectories without obvious overlaps. A .698 average posterior probability indicates generally high confidence in the classification of women into these groups. A median posterior probability of .750 indicates that there is higher than 75% confidence of classification in more than half the sample. The parameters determine the shape of the trajectory by age. Group 1 is described by an intercept only and therefore suggests an unchanging probability. Group 2 is a linear declining trajectory. Group 3 is described by a negative linear and positive quadratic term indicating a declining probability at younger ages and a rising probability with increasing age. Group 4 is a linear positive trajectory.
Table 5: Maximum likelihood parameter estimates for functional limitation trajectories (standard errors in parentheses)a
Group 1 Robust
Group 2 Recovery
Group 3 Late onset
Group 4 Early onset
Intercept ‒2.844 0.165 ‒1.976 ‒1.406 Linear parameter ‒0.384 (.185) ‒0.049 (.150) 2.739 (1.019) Quadratic parameter 0.501 (.153)
Group size 53.6% 14.5% 28.1% 3.8%
BIC ‒4,585.0 Average posterior probability 0.698 Median posterior probability 0.750
N 1,901
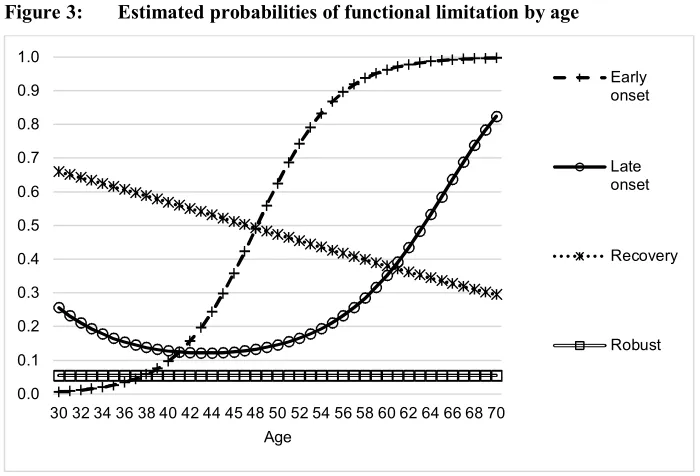
a limitation for this group reaches 50% by age 48, 16 years earlier than the late onset group, thus these women are likely to enter early old age having already experienced an onset. By age 70 nearly 100% of this group is functionally limited. This is the smallest sized group with only 4% of the sample. Note that a three-group solution, which actually has a better BIC but does not distinguish the sample as well, looks fairly similar except that the distinction between late and early onset is not present.
Figure 3: Estimated probabilities of functional limitation by age
3.3 Predictors of functional limitation trajectories
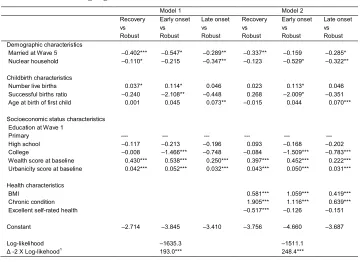
Results of the multinomial regression predicting group membership are shown in Table 6. Coefficients provide an estimate in the form of log odds of the chance of being in each specific group in contrast to the robust group. Therefore, variables with negative coefficients can be interpreted generally as protective. That is, it indicates a lower chance of being in the recovery, early onset, or late onset group relative to robust.
Looking at Model 1, which does not include health predictors, and summarizing across the contrasts, the following factors appear to be protective by increasing the chance of being in the robust group and decreasing the chance of being in other groups:
0.0 0.1 0.2 0.3 0.4 0.5 0.6 0.7 0.8 0.9 1.0
30 32 34 36 38 40 42 44 45 48 50 52 54 56 58 60 62 64 66 68 70 Age
Early onset
Late onset
Recovery
remaining married over the 21-year observation period, living in a nuclear household arrangement at baseline, and having higher education. The following appear to be detrimental by increasing the chance of being in a group other than the robust group: a greater number of live births, coming from a higher wealth household, and living in a barangay with a higher urbanicity score. Further, higher age at birth of first child is associated with a greater chance of being in the late onset group, while having a higher successful birth ratio is protective against being in the early onset group. Some of these associations are consistent with expectations, but some are not. In particular, total number of children born, wealth, and urbanicity scores run contrary to hypotheses. In supplementary analyses each predictor was examined unadjusted. This confirmed the direction of the associations, even for results like wealth and urbanicity that are inconsistent with expectations.
When adding health indicators, the other predictors do not change much. Health variables indicate that those in the robust group are more likely to have a BMI less than 25 and do not have a chronic condition at Wave 1. It is notable that the coefficient for chronic condition is much higher for the recovery versus robust contrast than for the other contrasts, an indication that the recovery group consists of women that have a health condition early in life from which they may recover. This may be, for instance, an injury or temporary illness. Similarly, the recovery group is related to poorer self-rated health at Wave 1.
4. Discussion and conclusion
common functional limitation patterns, and to correlate these patterns with characteristics measured earlier in life.
Table 6: Multinomial logistic regression predicting group membership showing log odds
Model 1 Model 2 Recovery vs Robust Early onset vs Robust Late onset vs Robust Recovery vs Robust Early onset vs Robust Late onset vs Robust Demographic characteristics
Married at Wave 5 ‒0.402*** ‒0.547* ‒0.289** ‒0.337** ‒0.159 ‒0.285* Nuclear household ‒0.110* ‒0.215 ‒0.347** ‒0.123 ‒0.529* ‒0.322**
Childbirth characteristics
Number live births 0.037* 0.114* 0.046 0.023 0.113* 0.046 Successful births ratio ‒0.240 ‒2.108** ‒0.448 0.268 ‒2.009* ‒0.351 Age at birth of first child 0.001 0.045 0.073** ‒0.015 0.044 0.070***
Socioeconomic status characteristics Education at Wave 1
Primary ‒-- --- --- --- --- High school ‒0.117 ‒0.213 ‒0.196 0.093 ‒0.168 ‒0.202 College ‒0.008 ‒1.466*** ‒0.748 ‒0.084 ‒1.509*** ‒0.783*** Wealth score at baseline 0.430*** 0.538*** 0.250*** 0.397*** 0.452*** 0.222*** Urbanicity score at baseline 0.042*** 0.052*** 0.032*** 0.043*** 0.050*** 0.031***
Health characteristics
BMI 0.581*** 1.059*** 0.419*** Chronic condition 1.905*** 1.116*** 0.639*** Excellent self-rated health ‒0.517*** ‒0.126 ‒0.151
Constant ‒2.714 ‒3.845 ‒3.410 ‒3.756 ‒4.660 ‒3.687
Log-likelihood ‒1635.3 ‒1511.1 Δ -2 X Log-likehood1 193.0*** 248.4***
* .05 < p < .10 ** .01 < p < .05 *** p < .01
1model 1 compared to intercept-only, model 2 compared to model 1.
elsewhere for a number of reasons, that half of this fairly young sample reported limitations at some point suggests a fairly high prevalence.
At the same time, movements into and out of functional limitation are frequent. For those with limitations over the course of six waves of data collection, most reported these at some points and not others. This suggests that aging through midlife into old age often involves repeatedly experiencing onset and recovery from functional health problems. Therefore, there are manifold possible patterns of functional limitation over time that are subjectively hard to describe. In the current study these were collapsed into common trajectories using GBTM modeling. A four-group model indicates that the most populous group is also functionally the healthiest, consisting of women that are unlikely to experience a limitation at any time between age 30 and 70. Those that are likely to experience a late onset – that is, they tend to be limitation free until their 60s – are the next largest group. This is followed by a recovery group that is likely to have a limitation in their 30s but not in their 60s. The smallest group, and likely the least favorable, is an early-onset group that is limitation-free in their 30s but likely to experience an onset by age 48 and nearly certain to have a limitation in their 60s.
A multinomial regression assessed factors best able to predict group membership. Living in a nuclear family at time of birth of the indexed child and remaining married throughout the observation period is deemed to be generally protective. The salutary influence of being married in older age is consistent with much previous literature (Wilcox et al. 2003; Williams and Umberson 2004). That being in a nuclear family setting relates to better functional health is intriguing though not exceptional. While it has not been often studied, other investigations have linked household type at the time a woman gives birth to her health (McCarthy and Maine 1992; Saikia and Singh 2009). The supposition is that nuclear households and subsequently smaller households may be a proxy for nontraditional attitudes, personal freedom, and autonomy – factors that tend to influence maternal health favorably. A woman that has greater autonomy tends to seek medical attention more frequently and likely takes care of her own health needs more conscientiously throughout life.
with more frequent contact with the health care system, itself related to higher order parity.
At the same time, when holding number of births constant, a younger age at first birth is protective but only of late onset of functional limitation; a result that is in agreement with at least one recent study that linked reproductive characteristics to later life health trajectories (Hanson, Smith, and Zimmer 2015). A high successful birth ratio, a general indication of the health of the mother, is protective of early onset of functional limitations, which is likely the least auspicious trajectory.
Results related to the SES characteristics are somewhat perplexing. A substantial body of research links higher SES with better health outcomes, and higher early-life SES with better later life health outcomes. The current analysis supports this notion using education as an indicator. However, contrary findings with wealth and urbanicity suggest that the association in the current context is complex and may vary across indicators. Similar associations are found with wealth and urbanicity unadjusted for education and are also reported in other independent research using this data (Lee, Perez, and Duazo 2013). These seemingly paradoxical findings are however not totally without explanation. Evidence for the protective effects of higher early-life SES has almost exclusively come from the United States and other high income countries. Whether these associations are consistent in other settings is uncertain. Some studies find unhealthy behaviors, such as smoking, poor diets and exercise regimes, and greater exposure to environmental hazards among urbanites and wealthier people in societies that are moving quickly out of low income status; a situation that does characterize the district of Cebu from which the current data originates (Bradley et al. 1992; Du et al. 2004; Stephens 1996; Zhai and McGarvey 1992). In these circumstances those who are wealthier and living in more urban places may be at higher risk for health problems related to lifestyle, such as hypertension and diabetes. Another possible connection with the current setting is that the type of labor that is typically undertaken by rural lower income women may be more physically intensive, which could benefit longer term functional health outcomes, as has been suggested elsewhere in developing country settings (Yi et al. 2002). The rural areas of Cebu from which this data comes are typically mountainous and have poor transportation links. The necessity of walking long distances with elevation changes may also be beneficial. The potential of selectivity factors cannot be ignored. It may be that those less healthy but wealthier can and do decide to live in more urban areas. It may also be that wealthier and those living in more urban areas have a greater tendency to report health problems due to having more contact with a health care system and subsequently greater health awareness.
since they come from Wave 1 rather than from baseline and therefore are not independent of the first measure of functional status. It is likely for this reason that chronic conditions are highly correlated with recovery and early onset.
Results herein could be shaped by the context of Cebu, Philippines and might differ in different parts of the world. Still, the examination of functional limitation among aging women in a high fertility lower income setting is an important step toward a better understanding of global health. These parts of the world are experiencing the most rapid rates of population aging, and the highest likelihood of functional problems is experienced by women in older age groups. That lower fertility within families is protective of women’s health is perhaps relevant given that many of these countries are going through fertility transition. While studies would be of interest elsewhere where the role of women, marital customs, and normative household structures is different, available data over such long periods of time is unfortunately rare and therefore it would be difficult to reproduce this analysis. The CLHNS indeed provides a unique opportunity. Our examination suggests a fairly high prevalence and many different possible patterns into and out of functional limitation as women age through mid-life and early old age in this developing country setting.
5. Acknowledgments
References
Adair, L.S. and Cole, T.J. (2003). Rapid child growth raises blood pressure in adolescent boys who were thin at birth. Hypertension 41(3): 451‒456.
doi:10.1161/01.HYP.0000054212.23528.B2.
Adair, L.S., Popkin, B.M., Akin, J.S., Guilkey, D.K., Gultiano, S., Borja, J., Perez, L., Kuzawa, C.W., McDade, T., and Hindin, M.J. (2011). Cohort profile: The Cebu longitudinal health and nutrition survey. International Journal of Epidemiology 40(3): 619‒625.doi:10.1093/ije/dyq085.
Adair, L.S., Popkin, B.M., and Guilkey, D.K. (1993). The duration of breast-feeding: How is it affected by biological, sociodemographic, health sector, and food industry factors?Demography 30(1): 63‒80.doi:10.2307/2061863.
Ben Shlomo, Y. and Kuh, D. (2002). A life course approach to chronic disease epidemiology: Conceptual models, empirical challenges and interdisciplinary perspectives. International Journal of Epidemiology 31(2): 285‒293.
doi:10.1093/intjepid/31.2.285.
Bradley, J.B., Stephens, T., Harpham, T., and Cairncross, S. (1992). A review of environmental health impacts in developing country cities. Washington, D.C.: The World Bank.
Connor, J. (2006). Multivariate mixture models to describe longitudinal patterns of frailty in American seniors. [doctoral dissertation]. Pittsburgh: Department of Statistics, Carnegie Mellon University.
Crimmins, E.M. and Saito, Y. (1993). Getting better and getting worse: Transitions in functional status among older Americans.Journal of Aging and Health 5(1): 3‒ 36.doi:10.1177/089826439300500101.
Croteau-Chonka, D.C., Marvelle, A.F., Lange, E.M., Lee, N.R., Adair, L.S., Lange, L.A., and Mohlke, K.L. (2011). Genome-wide association study of anthropometric traits and evidence of interactions with age and study year in Filipino women.Obesity 19(5): 1019‒1027.doi:10.1038/oby.2010.256.
Dahly, D.L. and Adair, L.S. (2007). Quantifying the urban environment: A scale measure of urbanicity outperforms the urban‒rural dichotomy. Social Science and Medicine 64(7): 1407‒1419.doi:10.1016/j.socscimed.2006.11.019.
Du, S., Mroz, T.A., Zhai, F., and Popkin, B.M. (2004). Rapid income growth adversely affects diet quality in China ‒ Particularly for the poor! Social Science and Medicine 59(7): 1505‒1515.doi:10.1016/j.socscimed.2004.01.021.
Filmer, D. and Pritchett, L. (2001). Estimating weath effects without expenditure data ‒ or tears: An application to educational enrollments in states of India. Demography 38(1): 115‒132.doi:10.1353/dem.2001.0003.
Freedman, V.A., Martin, L.G., and Schoeni, R.F. (2002). Recent trends in disability and functioning among older Americans: A critical review of the evidence. Journal of the American Medical Association 288(24): 3137‒3146. doi:10.1001/jama. 288.24.3137.
Fry, K., Firestone, R., and Charkraboty, N.M. (2014).Measuring equity with nationally representative wealth quintiles. Washington, D.C.: PSI.
Galobardes, B., Lynch, J.W., and Davey Smith, G. (2004). Childhood socioeconomic circumstances and cause-specific mortality in adulthood: Systematic review and interpretation.Epidemiolgical Review 26(1): 7‒21.doi:10.1093/epirev/mxh008. Gill, T.M., Gahbauer, E.A., Han, L., and Allore, H.G. (2010). Trajectories of disability
in the last year of life. New England Journal of Medicine 362(13): 1173‒1180.
doi:10.1056/NEJMoa0909087.
Grundy, E. and Tomassini, C. (2005). Fertility history and health in later life: A record linkage study in England and Wales.Social Science and Medicine 61(1): 217‒ 228.doi:10.1016/j.socscimed.2004.11.046.
Guralnik, J.M. and Ferrucci, L. (2003). Assessing the building blocks of function: Utilizing measures of functional limitation. American Journal of Preventive Medicine 25(3): 112‒121.doi:10.1016/S0749-3797(03)00174-0.
Haas, S. (2008). Trajectories of functional health: The ‘long arm’ of childhood health and socioeconomic factors. Social Science and Medicine 66(4): 849‒861.
doi:10.1016/j.socscimed.2007.11.004.
Hanson, H.A., Smith, K.R., and Zimmer, Z. (2015). Reproductive history and later-life comorbidity trajectories: A Medicare-linked cohort study from the Utah Population Database. Demography 52(6): 2021‒2049. doi:10.1007/s13524-015-0439-5.
Haviland, A.B., Jones, B.L., and Nagin, D.S. (2011). Group-based trajectory modeling extended to account for nonrandom participant attrition. Sociological Methods and Research 40(2): 367‒390.doi:10.1177/0049124111400041.
Hawkes, K. (2010). How grandmother effects plus individual variation in frailty shape fertility and mortality: Guidance from human–chimpanzee comparisons. Proceedings of the National Academy of Sciences 107(Supplement 2): 8977‒ 8984.doi:10.1073/pnas.0914627107.
Himes, C.L. (2000). Obesity, disease, and functional limitation in later life. Demography 37(1): 73‒82.doi:10.2307/2648097.
Hughes, M.E. and Waite, L.J. (2009). Marital biography and health at mid-life.Journal of Health and Social Behavior 50(3): 344‒358.doi:10.1177/002214650905000 307.
Idler, E.L. and Benyami, Y. (1997). Self-rated health and mortality: A review of twenty-seven community studies. Journal of Health and Social Behavior 38(1): 21‒37.doi:10.2307/2955359.
Johnson, R.J. and Wolinsky F.D. (1993). The structure of health status among older adults: Disease, disability, functional limitation, and perceived health.Journal of Health and Social Behavior34(2): 105‒121.doi:10.2307/2137238.
Jones, B.L. and Nagin, D.S. (2012). A Stata plugin for estimating group-based trajectory models. Pittsburgh: Heinz College Research, Carnegie Mellon University (working paper).
Jylha, M. (2009). What is self-rated health and why does it predict mortality? Towards a unified conceptual mode. Social Science and Medicine 69(3): 307‒316.
doi:10.1016/j.socscimed.2009.05.013.
Kington, R., Lillard, L., and Rogowski, J. (1997). Reproductive history, socioeconomic status, and self-reported health status of women aged 50 years or older. American Journal of Public Health 87(1): 33‒37.doi:10.2105/AJPH.87.1.33. Kinsella, K. and Phillips, D.R. (2005). Global aging: The challenge of success.
Population Bulletin 60(1): 3‒40.
Lawrence, R.H. and Jette, A.M. (1996). Disentangling the disablement process.Journal of Gerontology: Social Sciences 51(4): S173‒S182. doi:10.1093/geronb/51B. 4.S173.
Lee, N.R., Perez, T.L., and Duazo, P. (2013).Examining disability patterns over time in Cebuano women. Paper presented at the annual meeting of the Philippine Population Association, Cebu City, February 7‒8, 2013..
Lee, R.D. (2011). The outlook for population growth. Science 333(6042): 569‒573.
doi:10.1126/science.1208859.
Liang, J., Wang, C.-N., Xu, X., Hsu, H.-C., Lin, H.-S., and Lin, Y.-H. (2010). Trajectory of functional status among older Taiwanese: Gender and age variations. Social Science and Medicine 71(6): 1208‒1217. doi:10.1016/j.soc scimed.2010.05.007.
Luo, Y. and Waite, L.J. (2005). The impact of childhood and adult SES on physical, mental, and cognitive well-being in later life. Journal of Gerontology: Social Sciences 60(2): S93‒S101.doi:10.1093/geronb/60.2.S93.
MacMahon, B., Cole, P., and Brown, J. (1973). Etiology of human breast cancer: A review. Journal of the National Cancer Institute 50(1): 21‒42. doi:10.1093/ jnci/50.1.21.
Martin, L.G., Zimmer, Z., and Lee, J. (2015). Foundations of activity of daily living trajectories of older Americans. Journal of Gerontology: Social Sciences 72(1): 129‒139.doi:10.1093/geronb/gbv074.
McCarthy, J. and Maine, D. (1992). A framework for analyzing the determinants of maternal mortality. Studies in Family Planning 23(1): 23‒33. doi:10.2307/ 1966825.
McDade, T.W., Beck, M.A., Kuzawa, C., and Adair, L.S. (2001). Prenatal undernutrition, postnatal environments, and antibody response to vaccination in adolescence.The American Journal of Clinical Nutrition 74(4): 543‒548. Miszkurka, M., Zunzunegui, M.V., Langlois, É.V., Freeman, E.E., Kouanda, S., and
Haddad, S. (2012). Gender differences in mobility disability during young, middle and older age in West African adults. Global Public Health 7(5): 495‒ 508.doi:10.1080/17441692.2011.630676.
Murray, E.T., Hardy, R., Strand, B.H., Cooper, R., Guralnik, J.M., and Kuh, D. (2011). Gender and life course occupational social class differences in trajectories of functional limitations in midlife: Findings from the 1946 British birth cohort. Journal of Gerontology: Biological Sciences and Medical Sciences 66(12): 1350‒1359.doi:10.1093/gerona/glr139.
Nagi, S.Z. (1976). An epidemiology of disabilty among adults in the United States. Milbank Memorial Fund Quarterly 54(3): 439‒467.doi:10.2307/3349677. Nagin, D.S. (1999). Analyzing developmental trajectories: A semiparametric,
group-based approach.Psychological Methods 4(2): 139‒157.doi:10.1037/1082-989X. 4.2.139.
Nagin, D.S. (2005). Group-based modeling of development. Cambridge: Harvard University Press.doi:10.4159/9780674041318.
Nagin, D.S. and Tremblay, R.E. (2001). Analyzing developmental trajectories of distinct but related behaviors: A group-based method. Psychological Methods 6(1): 18‒34.doi:10.1037/1082-989X.6.1.18.
Nogueira, D. and Reis, E. (2014). Longevity and health: Trends in functional limitations and disability among older adults in Portugal, 1985‒2005. Ageing International 39(3): 195‒209.doi:10.1007/s12126-013-9186-3.
Ofstedal, M.B., Zimmer, Z., Hermalin, A.I., Chan, A., Chuang, Y.-L., Natividad, J., and Tang, Z. (2007). Short-term trends in functional limitation and disability among older Asians: A comparison of five Asian settings. Journal of Cross-Cultural Gerontology 22(3): 243‒261.doi:10.1007/s10823-006-9025-z.
Onder, G., Pennix, B.W.J.H., Lapuerta, P., Fried, L.P., Ostir, G.V., Guralnik, J.M., and Pahor, M. (2002). Change in physical performance over time in older women: The Women’s Health and Aging Study. Journal of Gerontology: Biological Sciences and Medical Sciences 57A(5): 289‒293. doi:10.1093/gerona/57.5. M289.
Pudrovska, T. and Anikputa, B. (2014). Early-life socioeconomic status and mortality in later life: An integration of four life-course mechanisms. Journal of Gerontology: Social Sciences 69(3): 451‒460.doi:10.1093/geronb/gbt122. Rantanen, T., Guralnik, J.M., Foley, D., Masaki, K., Leveille, S., Curb, D., and White,
Reilly, J.J. and Kelly, J. (2011). Long-term impact of overweight and obesity in childhood and adolescence on morbidity and premature mortality in adulthood: Systematic review. International Journal of Obesity 35(7): 891‒898.
doi:10.1038/ijo.2010.222.
Reynolds, S.L., Saito, Y., and Crimmins, E.M. (2005). The impact of obestiy on active life expectancy in older American men and women. Gerontologist 45(4): 438‒ 444.doi:10.1093/geront/45.4.438.
Roeder, K., Lynch, K.G., and Nagin, D.S. (1999). Modeling uncertainty in latent class membership: A case study in criminology. Journal of the American Statistical Association 94(447): 766‒776.doi:10.1080/01621459.1999.10474179.
Ross, C.E. and Wu, C.-L. (1996). Education, age and the cumulative advantage in health. Journal of Health and Social Behavior 37(1): 104‒120. doi:10.2307/ 2137234.
Saikia, N. and Singh, A. (2009). Does type of household affect maternal health? Evidence from India.Journal of Biosocial Science 41(3): 329‒353.doi:10.1017/ S0021932008003209.
Smith, J.P. and Kington, R. (1997). Demographic and economic correlates of health in old age.Demography 34(1): 159‒170.doi:10.2307/2061665.
Smith, K.R., Mineau, G.P., Garibotti, G., and Kerber, R. (2009). Effects of childhood and middle-adulthood family conditions on later-life mortality: Evidence from the Utah Population Database, 1850‒2002. Social Science and Medicine 68(9): 1649‒1658.doi:10.1016/j.socscimed.2009.02.010.
Spence, N.J. (2008). The long-term consequences of childbearing: Physical and psychological well-being of mothers in later life.Research on Aging 30(6): 722‒ 751.doi:10.1177/0164027508322575.
Stephens, C. (1996). Healthy cities or unhealthy islands? The health and social implications of urban inequality. Environment and Urbanization 8(2): 9‒30.
doi:10.1177/095624789600800211.
Tirosh, A., Shai, I., Afek, A., Dubnov-Raz, G., Ayalon, N., Gordon, B., Derazne, E., Tzur, D., Shamis, A., and Vinker, S. (2011). Adolescent BMI trajectory and risk of diabetes versus coronary disease. New England Journal of Medicine 364(14): 1315‒1325.doi:10.1056/NEJMoa1006992.
UNFPA and HelpAge International (2012). Ageing in the twenty-first century: A celebration and a challenge. New York: United Nations Population Fund and Help Age International.
Verbrugge, L.M. and Jette, A.M. (1994). The disablement process.Social Science and Medicine 38(1): 1‒14.doi:10.1016/0277-9536(94)90294-1.
Waldron, I., Weiss, C.C., and Hughes, M.E. (1998). Interacting effects of multiple roles on women’s health. Journal of Health and Social Behavior 39(3): 216‒236.
doi:10.2307/2676314.
Wen, M., Hawkley, L.C., and Cacioppo, J.T. (2006). Objective and perceived neighborhood environment, individual SES and psychosocial factors, and self-rated health: An analysis of older adults in Cook County, Illinois.Social Science and Medicine 63(10): 2575‒2590.doi:10.1016/j.socscimed.2006.06.025. Wight, R.G., Cummings, J.R., Miller-Martinez, D., Karlamangla, A.S., Seeman, T.E.,
and Aneshensel, C.S. (2008). A multilevel analysis of urban neighborhood socioeconomic disadvantage and health in late life.Social Science and Medicine 66(4): 862‒872.doi:10.1016/j.socscimed.2007.11.002.
Wilcox, S., Evenson, K.R., Aragaki, A., Wassertheil-Smoller, S., Mouton, C.P., and Loevinger, B.L. (2003). The effects of widowhood on physical and mental health, health behaviors, and health outcomes: The Women’s Health Initiative. Health Psychology 22(5): 513‒522.doi:10.1037/0278-6133.22.5.513.
Williams, K. and Umberson, D. (2004). Marital status, marital transitions, and health: A gendered life course perspective. Journal of Health and Social Behavior 45(1): 81‒98.doi:10.1177/002214650404500106.
Willis, B.L., Gao, A., Leonard, D., DeFina, L.F., and Berry, J.D. (2012). Midlife fitness and the development of chronic conditions in later life. Archives of Internal Medicine 172(17): 1333‒1340.doi:10.1001/archinternmed.2012.3400.
Wolf, D.A., Mendes de Leon, C.F., and Glass, T.A. (2007). Trends in rates of onset of and recovery from disability at older ages: 1982‒1994.Journal of Gerontology: Social Sciences62(1): 3‒10.doi:10.1093/geronb/62.1.S3.
World Health Organization (2011). World report on disability: Summary, 2011. Geneva: World Health Organization. http://www.refworld.org/docid/50854 a322.html
Yi, Z. and Vaupel, J.W. (2004). Association of late childbearing with healthy longevity among the oldest-old in China.Population Studies 58(1): 37‒53.doi:10.1080/00 32472032000175437.
Yi, Z., Vaupel, J.W., Zhenyu, X., Chunyuan, Z., and Yuzhi, L. (2002). Sociodemographic and health profiles of the oldest old in China. Population and Development Review 28(2): 251‒273.doi:10.1111/j.1728-4457.2002.00251.x. Zhai, S. and McGarvey, S.T. (1992). Temporal changes and rural‒urban differences in
cardiovascular disease risk factors and mortality in China.Human Biology 64(6): 807‒819.
Zimmer, Z., Martin, L.G., Jones, B.L., and Nagin, D.S. (2014). Examining late-life functional limitation trajectories and their associations with underlying onset, recover, and mortality.Journal of Gerontology: Social Sciences 69(2): 275‒286.
doi:10.1093/geronb/gbt099.
Zimmer, Z., Martin, L.G., Nagin, D.S., and Jones, B.L. (2012). Modeling disability trajectories and mortality of the oldest-old in China. Demography 49(1): 291– 314.doi:10.1007/s13524-011-0075-7.