The Thirty-First AAAI Conference on Innovative Applications of Artificial Intelligence (IAAI-19)
Separating Wheat from Chaff: Joining Biomedical
Knowledge and Patient Data for Repurposing Medications
Galia Nordon
Technion- Israel Institute of TechnologyHaifa, Israel
Gideon Koren, Varda Shalev
Maccabi-Kahn Institute ofResearch and Innovation Tel-Aviv, Israel
Eric Horvitz
Microsoft ResearchRedmond, WA
Kira Radinsky
Technion- Israel Institute of TechnologyHaifa, Israel
Abstract
We present a system that jointly harnesses large-scale elec-tronic health records data and a concept graph mined from the medical literature to guide drug repurposing—the process of applying known drugs in new ways to treat diseases. Our study is unique in methods and scope, per the scale of the concept graph and the quantity of data. We harness 10 years of nation-wide medical records of more than 1.5 million peo-ple and extract medical knowledge from all of PubMed, the world’s largest corpus of online biomedical literature. We em-ploy links on the concept graph to provide causal signals to prioritize candidate influences between medications and tar-get diseases. We show results of the system on studies of drug repurposing for hypertension and diabetes. In both cases, we present drug families identified by the algorithm which were previously unknown. We verify the results via clinical expert opinion and by prospective clinical trials on hypertension.
1
Introduction
The cost of developing a new drug nearly doubles every nine years (Nosengo 2016). Eroom’s law states that drug discov-ery is becoming slower and more expensive over time, in spite of advances in technology. Developing a new medica-tion requires more than 14 years and 2–3 billion dollars in cost (Nosengo 2016).
Given the cost and expense of drug development, phar-maceutical companies have increased investments in drug repurposing, the process of applying known drugs to treat new diseases. Successful repurposing can reduce costs and time to market as medications have already passed stud-ies of human safety. It has been estimated that drug re-positioning cuts development time in half and significantly reduces costs (Nosengo 2016). Numerous successes include a medication for high blood pressure and angina developed in 1989 that was found to be a treatment for erectile dys-function, branded as Viagra in 1998. Repurposing applica-tions include re-examining failed drugs for successful treat-ments: Azidothymidine, originally designed as a chemother-apy drug, was repurposed in the 1980s as a therchemother-apy for HIV. Over the last few years, the process of repurposing drugs has become more systematic. One such example is a set of discoveries for treating bipolar disorder (Singh et al. 2013).
Copyright c2019, Association for the Advancement of Artificial Intelligence (www.aaai.org). All rights reserved.
We propose a methodology for candidate generation and prioritization which uses both medical records and causal hints from the biomedical literature to identify potential drugs to be repurposed. The approach brings together princi-ples and clinical observations to create a better understand-ing. We obtain access to a unique large database of medical records containing more than 1.5 million people monitored for more than 10 years. The data-set contains information on patients who are routinely treated by doctors. This large, longitudinal data-set provides an unusual and valuable pic-ture of long-term patient health that tracks visits to primary-care physicians, hospitals and pharmacies, and demographic attributes and their relationships to health outcomes.
We identify correlation between potential drugs and in-fluences on diseases and mimic the process of conducting randomized clinical trials on influences. For each potential drug candidate, we identify a representative control group, and verify that the candidate has the potential to be repur-posed to treat a disease. The process alone cannot confirm valuable repurposing candidates as the identification may be the result of spurious correlations. For example, when naively trying to identify drugs that have correlation with the success of hypertension treatment, we find that the pur-chase of bandage supplies (gauze, band-aids etc.) are linked to higher success rate for hypertension treatment (43% suc-cess rate, chi square results of 34.4 andp= 4.7e−9). It is highly unlikely that this success is due to the use of ban-dages. Rather the bandages are likely serving as proxies for attributes of a subgroup of people, e.g., perhaps a subgroup that sustains more injuries because they are more physically active or who have other distinguishing factors.
To deprioritize candidates that may have been selected solely due to confounding variables, we implement a methodology that searches for biological processes that could explain how a medication might affect a target dis-ease. We employ a graph of causal relationships mined from PubMed to create feasible causal pathways to explain these processes. For example, the path that our system identified for a potential drug group, statins, in consideration for re-purposing for treating hypertension is:
We show results of the system on identifying repurposing candidates for two diseases: hypertension and diabetes. In both cases, we present drug families identified by the algo-rithm which were previously unknown.Clinical opinionby experts in the field andmedical literature reportson those drug families show evidence for their being repurposed. The system presented has now been pressed into use by medi-cal researchers as an interactive tool for exploring drug re-purposing at Maccabi Health care which is Israel’s second largest health care provider currently treating over two mil-lion patients.
2
Medical Community Model
Clinical research is a resource-intensive process. To date, decisions on medications to pursue for potential repurpos-ing are based primarily on: (1) expert medical knowledge and understanding, (2) clinical experience with small groups of patients, (3) medical intuition, and (4) current medical trends. We illustrate this process in Algorithm 1. We posit that the motivation for a repurposing study typically starts when a medical practitioner notices a correlation between a response to a medical condition and treatment with a med-ication that is seemingly unrelated to the condition. Condi-tioncand drugdarecorrelatedif patients that are prescribed
dshow a higher or lower success rate in treatment for con-ditionc. In line 1 in Algorithm 1,corr(drug)represents a correlation discovered between use ofdrugand successful treatment of some condition c (treatSucc). Note that the number of patients or the definition of difference from the average success rate is not included in the definition of cor-relation. This is because the correlations observed by a doc-tor in the current model are often based on a limited number of cases. The spark of intuition in advance of more intensive research can emerge from very few patients; statistical anal-yses are done at a later stage. Once a correlation is noticed, the researcher will refer to relevant research and pharma-ceutical and biological knowledge in search of supporting work or explanations. If the researcher is persuaded that the premise is strong enough, the next step is devising an obser-vational study (lines 5-7 in Algorithm 1). The final step is the pursuit of a formal clinical trial (lines 8-10 in Algorithm 1). Since the initial premise of the research is devised “in-dividually” (i.e. by a single researcher or team), this model is prone to be influenced by individual belief, local medi-cal protocols, and recent popular research. In this work, we propose and augmented model which uses comprehensive observational data and textual knowledge to overcome these shortcomings.
3
Data-Driven Medical Model
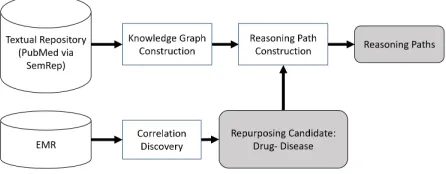
While there have been many benefits of the Medical Com-munity Model to date, we suggest that automated tools pow-ered by knowledge graphs mined from a comprehensive cor-pus of biomedical literature and probabilistic analysis can accelerate discovery. Figure 1 describes the overall frame-work for identifying candidates for drug repurposing. In an initial stage of analysis, a large store of electronic health records (EMR) are systematically scanned, and correlation
Algorithm 1Medical Community Model
corr(drug) := Correlation(drug,treatSucc) ≥ threshould
2: sup(drug) := ExistsSupportingResearch(drug) reas(drug) := ExistsTheoreticalReasoning(drug) 4: if (corr(drug) and (sup(drug) or reas(drug)))
then
ifObservationalStudyPossible(drug)then 6: observRes := ObservationalStudy(drug)
end if
8: ifobservResthen
InterventionStudy(drug) 10: end if
end if
Medical Community Model algorithm. A correlation is discovered between successful treatment of some condition
c and treatment with drug drug. If supporting research or theoretical reasoning exists, and observational study is conducted. Followed by a clinical study is the results are sufficient.
studies are employed to identify as repurposing candidates the set of drugs prescribed for patients for whom improve-ments are observed in off-drug conditions. Next, a subset of these candidates is selected as having higher potential based upon biological processes. This phase of analysis is performed via use of a biomedical knowledge graph1. We construct a knowledge graph based on the academic publi-cation data. A repurposing candidate is represented as a pair: a drug and the medical condition it might effect. For each re-purposing candidate, the system searches the graph for paths between the candidate drug to the medical condition. The output of the framework is a collection of candidates and a list of possible reasoning paths for each candidate.
Figure 1: Re purposing framework
3.1
Electronic Medical Records Repository
In our experiments, we relied on a large electronic medi-cal data-set provided by Maccabi healthcare - a large health-care provider currently caring for over two-million patients.1
From this data-set, we mined possible drugs to be repur-posed based on correlations. The data in our repository has been collected for over ten years for more than 1.5 mil-lion patients. The data-set contains an inventory of all pre-scription and non-prepre-scription pharmaceuticals dispensed by their pharmacies. The drugs are categorized according to 286“treatment groups”. We regard these treatment groups as the drug types to be tested. The treatment groups vary in size and generality. For example, the “Paracetamol” group is rather specific. It includes all paracetamol brands and dosages. The “gynecological” group on the other hand, is much larger and less specific. This issue is partially con-trolled for by using matching and goodness of fit criteria described in Section 3.3. Treatment groups that are too ab-stract will not pass the goodness-of-fit criteria. We identified drugs taken by patients via prescription purchase records. Thisminimizes compliance issuesas patients who purchase the drug are more likely to take it.
3.2
Biomedical Knowledge Graph
PubMed is a database and search engine for accessing all MEDLINE (Kilicoglu et al. 2012) citations and several other resources2. It is a literary repository of over 27 million citations and abstracts for biomedical academic literature. As such, it represent detailed professional peer-reviewed medical knowledge. The Semantic MEDLINE Database (SemMedDB) (Kilicoglu et al. 2012) contains, among oth-ers, semantic predications (subject-predicate-object triples) extracted from PubMed citations. These predications were created by a text analysis tool called SemRep (Rindflesch and Fiszman 2003) which performs text processing of the PubMed abstracts, including named entity recognition, matching each entity with its UMLS representation, and re-lation extraction for rere-lations between these entities. Each relation is extracted from a single sentence in a PubMed ab-stract.
A predication consists of a subject, object and a relation between them. For example: hand PART OF human, spleen LOCATION OF gangrene, Urethane TREATS Multiple Myeloma. We construct a graph based on SemMedDB pred-ications by creating a node in the graph for each subject and object, and a link for each relation. The PubMed graph contains 90M edges. This is due to the high granularity of the PubMed data. We therefore perform filtering both on the relation types and entity types. We limit the rela-tions we use, avoiding general relarela-tions (e.g. LOCATION OF,DIAGNOSES) as they have low value for explaining re-positions. The semantic types are filtered according to their generality as explained in Section 3.4.
3.3
Discovering Candidates by Correlation
Algorithm 2 describes an augmented method to the one de-scribed in Section 2 (Medical Community Model model). We use large medical and textual knowledge data-sets for discovering repurposing candidates rather than rely on an in-dividual clinician’s experience, thus improving the prospect2
for the sake of simplicity, we refer to this repository as PubMed in this paper
of positive trial outcomes and effectiveness of the entire pro-cess.
Algorithm 2Data-Driven Medical Model for alld∈Drugsdo
2: corr(d) := CohortCorrelation(d,treatSucc) ≥ threshould
sup(d) := ExistsSupportingResearch(d) 4: reas(d) := CohortReasoning(d)
ifcorr(d) and ((sup(d) or reas(d))then 6: current :=d where corr(d) := max{corr(d)}
ifObservationalStudyPossible(current)then 8: observRes := ObservationalStudy(current)
end if
10: ifobservResthen
IterventionStudy(current) 12: end if
remove current 14: end if
end for
Data-Driven Medical Model algorithm.All drugs in elec-tronic medical records data set are tested for correlation with treatment success. In addition to searching for supporting research, reasoning for the correlation is extracted from a medical literature data repository.
As opposed to Algorithm 1, in line 2 of Algorithm 2, in-stead of identifying a potential drug by noticing a correla-tion on a limited number of cases, we mine a large medi-cal database and extract the correlations from it. In line 4, we mine a large knowledge base to extract reasoning to the correlations found in line 2. The process is repeated for all drugs in the medical database. In our augmented mode, both drug correlations and reasoning are discovered methodolog-ically using a large data or knowledge base, allowing for diverse and high quality results. We provide experimental results and analysis of our model in Section 4.3.
The CohortCorrelation algorithm (described in Algo-rithm 3) overcomes challenge of false positive or spurious correlations with the following two steps:
1. Discover correlations in medical data repository via sim-ilar control group identification.
2. Correct for multiple testing.
Given a specific disease, we iterate over all pharmaceutical groups in our data-set. We create a matched group of un-treated patients and use Pearson’s chi-squared test to iden-tify if the treated and untreated patients differ in their treat-ment success rate. We then consider the correlated drugs and make sure the statistical difference holds after correcting for multiple testing.
Algorithm 3Cohort Correlation fordrug∈Drugsdo
2: treated =group of treated with drug unTreated := Match(treated,d)
4: ifExistsMatch()then
pval := ChiSquare(treated,unTreated) 6: MatchedDrugs+ = drug
end if 8: end for
fordrug∈MatchedDrugsdo
10: ifCorrectedPValue(MatchedDrugs,drug)then returndrug
12: end if end for
Cohort Correlation algorithm.Foreach drug in the EMR and each group of patients that received the drug, create a matched group of patients that did not receive the drug. If the treatment success in the two groups is statistically different - return the drug as a repurposing candidate.
seen in Algorithm 4. Finally, we correct for multiple tests using Bonferroni correction (Dunn 1959).
Algorithm 4Match forf ∈featuresdo
2: pval := KS(treated,unTreated) if0.001≥pvalthen
4: returnfalse
end if 6: end for
returntrue
Match. Go over all features and preform a Kelmogorov-Smirnov goodness of fit test.
3.4
Correction by Reasoning
So far we have described how we produce research can-didates based on correlations discovered in a medical data repository. In Section 4 we show that merely relying on these candidates is not enough. Spurious correlations of drugs still exist.
Doctors often try to identify feasible biochemical and physiologic mechanisms to explain potential effects to re-duce the chances of spurious correlations. We now present an algorithm for correcting the potential drug discoveries us-ing external knowledge bases. Relyus-ing solely on statistical analysis of electronic medical databases is insufficient for several reasons:
1. Partial representation. As comprehensive as our database may be, it still only holds “discrete evidence” of the com-plex biological processes composing the human body. We would not want to ignore the vast amount of medical knowledge that is present outside of this database. Fur-thermore, medical professionals presented with the re-sults of correlation findings may be left to find support via
personal reflection or research, a process which is prone to the disadvantages of the individual model described in Section 2.
2. Bias. In contrast to data collected from randomly con-troller trials, in observational medical data treatment is not randomly assigned to patients. Rather, treatment is a result of the patient’s overall medical condition. Other factors such as the rarity of the medical condition, choice of doctor and local treatment protocols can also intro-duce biased data (Hammer, du Prel, and Blettner 2009). As much as we try to correct for this bias, we will most likely not eliminate it completely. Consider the matching method for example. We will probably find a match that is close enough for each treated patient but is not com-pletely identical in all parameters.
3. Algorithmic parameterization. The algorithms we present rely on several parameters such as thresholds or choice of statistical correction. There will always be a trade-off between the values chosen for these thresholds and the accuracy of the results.
As an additional measure, we can consider causal support for the discovered correlations in knowledge graphs con-structed from the text of biomedical literature. In the knowl-edge graph, each term is a node and knowl-edges between them represent relations between the nodes. We search for paths leading from the correlated drug to the disease under inves-tigation (Algorithm 6). We limit the length of the path and the nodes constructing it with the following assertions (Al-gorithm 5):
1. Path length. The longer the path, the less likely it is to be informative.
2. Node generality. The more general a term is, the less likely the path will be informative.
Consider the following path:
Statin→Vitamins→United States→Blood Pressure
The path is comprised of very general terms: “Vitamins” and “United States” which add little information for explain-ing the mechanism of the statin drug family to the hyperten-sion medical condition. The path:
Statin→Pharmaceutical preparations→Blood Pressure
is shorter but still contains general terms that do not con-tribute to explaining the relation between statins and blood pressure. The path:
Proton-pump inhibitor→Serotonin Uptake Inhibitors →Contraceptives, Oral→Blood pressure
is composed of less generic terms but is instead a rather long list of associations producing a somewhat weak association between proton-pump inhibitors and blood pressure. In con-trast, the following is an example of a more informative path:
Statin→Atrial Natriuretic Paptide→Blood Pressure
Algorithm 5Filter Reasoning Paths
allPaths := FAP(drug,condition,limit 2: forpath∈allPathsdo
fornode∈pathdo
4: ifgenerality(node)≥thresholdthen allPaths.remove(path)
6: end if end for 8: end for
return allPaths
Filter Reasoning Paths.Remove reasoning paths that con-tain nodes that are too general.
Algorithm 6Find All Paths (FAP) current := source
2: current.discovered :=true
neighbors := current.neighbors 4: ifpath.length() = cutoffthen
path := path.dropLast() 6: return
end if
8: for alln∈neighborsdo ifn= targetthen
10: allPaths := allPaths.append(path) path := path.dropLast()
12: return end if
14: ifn.discovered =falsethen path := path.append(n)
16: return FAP(n,target,path,allPaths,cutoff) end if
18: end for
Find All Paths. Preform a depth first search for all paths from source to target. Path length is limited bycutoff.
Limiting General Nodes Experiments with the auto-mated use of the knowledge graph to find causal path-ways between candidate medications and conditions demon-strated that invalid pathways contained one or more nodes that Relying on structural graph properties such as central-ity or page rank (Page et al. 1999) to define node generalcentral-ity is not sufficient in our case due to the size and structure of the PubMed graph. Therefore we rely on the semantic prop-erties of the nodes, excluding nodes that belong to a general semantic type according to the unified medical language sys-tem (UMLS) (Bodenreider 2004). UMLS contains an ontol-ogy of biomedical concepts and relationships between them. The UMLS semantic networks consists of a large set of se-mantic types which consistently categorize biomedical con-cepts. There are over 100 semantic types in UMLS ranging from specific types such as “Nucleic Acid, Nucleoside, or Nucleotide” to more general ones such as “Physical Object”. We limited the group of semantic types used for our analy-sis according to their generality and excluded any paths that
contained concepts from these groups.
4
Experimental Evaluation
In this section, we outline our experimental methodology and results.
4.1
Baselines
Using a large medical data-set, we identify patients receiv-ing first time treatment for a given medical condition and collect all drugs prescribed to these patients. Our aim is to find concomitant drugs that contribute to treatment success. We compare our method (Section 3) to a correlation discov-ery baseline that identifies drug treatment groups with sta-tistically significant result. The baseline uses the Pearson’s Chi-squared test with statistical significance of 5% to reject the null hypothesis that the response to a treatment is iden-tical in the treated and untreated group. For example, ex-perimentally selecting a random sampling of 1500 patients shows this group will have a treatment success rate of 1.5% around this average, i.e. 41%, 39% etc. The baseline ap-proach to finding correlation will be selecting any drug with success rate different than 40% (the average success rate in treating hypertension) using a standard chi-squared test. Specifically, we test for two baselines: one which identifies deviations of 3% and more, and one that identifies deviations of 5% and more.
4.2
Experimental Methodology
We now compare the Medical Community Model to the Data-Driven Medical Model based on the number of corre-lating drugs (i.e. research candidates) they produce and their diversity. We specifically show our results on two medical conditions: hypertension and diabetes.
Hypertension Hypertension is a prevalent condition af-fecting roughly 20 percent of the world population3. It is a leading cause of mortality and morbidity in the general population. We identified first-time drug treatment of hy-pertension using the first hyhy-pertension diagnosis reported in the patient record and first anti-hypertensive drug purchase for patient. The success criteria was defined as blood pres-sure lower than 140/90 within 90 days of treatment where there are at least two blood pressure (BP) measurements in that period. The resulting data-set contained 30,705 patients. Treatment success rate was found to be 40%.
Type II Diabetes Type II diabetes is a very common medical condition with sever and often fatal complications (Shi and Hu 2014). There are 15,893 diabetic patients in our database. These patients were already identified in our database by the health-care provider. We use a glycolated haemoglobin (HbA1c) lab test result for defining treatment success. HbA1c values under 6.5 in the period between 90 and 365 days following first diagnosis are considered suc-cessful treatment. Under this definition, the success rate in our database is 53%.
3
Metric and Gold Standard Validating these kind of re-sults via a full clinical trial is a long and expensive task. In this work, we validate the results via: (1) PubMed publica-tions of small trials and (2) opinion of medical experts in the field that review the drugs recommended by the different algorithms.
If a relevant publication reports positive results or an ex-pert in the field found the discovery plausible, we consider these to be positive signs that further exploration of this drug is appropriate and the drug is a good candidate for repur-posing. The small clinical trials information was extracted from PubMed. We evaluated the relevant papers supporting or negating our findings.
When consulting medical experts we used two phases. First we presented the drug-disease correlation results with-out the reasoning and then we added the reasoning provided by our system. This was done to better compare the methods from a statistical point of view without biasing their opin-ion. We present results of the top 10 drugs identified by the algorithms and provide the results via Precision@2, Preci-sion@5 and Precision@10 metrics.
4.3
Key Results on Drug Repurposing
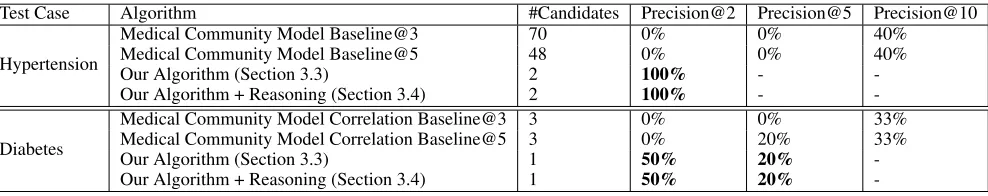
We now present experimental results for the Data-Driven Medical Model as compared to the baseline method. We test these models on two test cases: hypertension and type II di-abetes. Table 1 summarizes the results.
The table shows the significant advantage of our algo-rithm as compared to the results of the baselines. The num-ber of treatment group candidates produced by the algo-rithm is smaller in magnitude than the baselines approach and provides a more manageable set of candidates for fur-ther investigation. The candidates produced by the baselines were mostly found to be either irrelevant (e.g. “anti-vertigo treatment”) or too general (e.g. “gynecological”). The Data-Driven Medical Model produced fewer candidates. Most of the candidates were validated with relevant medical research of small clinical trials. Our algorithm found two candidates for the hypertension test case: “statins” and “proton-pump inhibitors”. “statins” were easily accepted by the medical researches as there is a large body of work confirming the positive effects of statins on hypertension. ‘Proton-pump in-hibitors’ were considered more cautiously. The reservations were mediated by the supporting PubMed path analysis and further investigation by a supporting clinical trial (Mu˜noz-Torrero et al. 2014).
For diabetes the group titled ”Prostate drugs” was found as a candidate. This group contains alpha blockers. Search-ing for reasonSearch-ing paths for alpha blockers, a few publications were found supporting the repurposing of alpha blockers to diabetes treatment, including work reporting results from the omics data mining system, which focuses on proteins and target sites (Zhang et al. 2015).
4.4
Effect of Path Length
We consider biological processes via reasoning with the biomedical knowledge graph to support influences between candidate medications and the conditions of “hypertension”
and “diabetes,” respectively. Table 2 summarizes the num-bers of paths found for each treatment group candidate for the hypertension and diabetes test cases. Three length cutoff were employed in the tests: 2,3,4. Cutoff@2 and Cutoff@3 are presented in the table. As should be expected, the num-ber of paths produced for each cutoff increased significantly. Cutoff@4 produced a very large number of paths, that was hard to handle computationally for some groups. We present for each cutoff the original number of paths and the num-ber of paths that passed a pagerank based generality filter (marked as “gen. filter” in the table).
5
Related Work
Traditionally, systematic testing of known drugs for a spe-cific disease is done via laboratory analysis, either by in-vitro (Singh et al. 2013) or in-vivo testing 4, or compu-tational models and simulations (in-silico) (Hurle et al. 2013; Dudley, Deshpande, and Butte 2011; Siavelis et al. 2016; Dai et al. 2015). (Chong and Sullivan 2007) ad-dressed the difficulties in composing an accessible library of all known drug compounds for such exhaustive research. These challenges include patent restrictions and syntheses of compounds. The NCGC Pharmaceutical collection (NPC) (Huang et al. 2011) is a publicly accessible collection of drugs which is attempting to fill this need. Additional dif-ficulties also stem from defining the drug (Chong and Sulli-van 2007; Huang et al. 2011). (Xu et al. 2015) used medical data-sets to validate results of drug repurposing predictions made using biochemical computations.
The field of literature-based discovery (Swanson 1986) at-tempts to identify new relations in existing knowledge by mining academic publications. Traditionally, this is done by linking two “unrelated” concepts A and B through a third concept C which co-appeared with the previous in medi-cal publications. This approach and its variations have been successfully used for medical and biomedical discoveries (Swanson and Smalheiser 1999; Spangler et al. 2014). Span-gler et al.(SpanSpan-gler et al. 2014) applies text mining tech-niques to identify entities and relations relevant to a spe-cific query. Our work differs by building a single reason-ing graph that is used for all queries and by utilizreason-ing UMLS concepts and relations. DiseaseConnect (Liu et al. 2014) is a web based system for analysis of disease connectivity. It is aimed at genome and mechanism-based connectivity and, unlike our work, is limited to a small sub set of UMLS semantic types. Other works focused on disease networks (Goh et al. 2007) , again limiting the scope of the knowledge represented. More closely to our work, MOLIERE frame-work (Sybrandt, Shtutman, and Safro 2017), allows a user to mine potential connections between two medical key-words. The results are related academic paper abstracts shar-ing common topics which are candidates for the connectshar-ing the two queried keywords. Our work differs in several as-pects: (1) the system presented in this paper is not aimed at exploratory general medical research but rather on the specific task of drug re-positions and drug-disease
explana-4
Table 1: Results of the different algorithms on the medical test cases
Test Case Algorithm #Candidates Precision@2 Precision@5 Precision@10
Hypertension
Medical Community Model Baseline@3 70 0% 0% 40%
Medical Community Model Baseline@5 48 0% 0% 40%
Our Algorithm (Section 3.3) 2 100% -
-Our Algorithm + Reasoning (Section 3.4) 2 100% -
-Diabetes
Medical Community Model Correlation Baseline@3 3 0% 0% 33% Medical Community Model Correlation Baseline@5 3 0% 20% 33%
Our Algorithm (Section 3.3) 1 50% 20%
-Our Algorithm + Reasoning (Section 3.4) 1 50% 20%
-Table 2: PubMed Reasoning Paths
Test Case Source Target Cutoff@2 Cutoff@2 gen. filter Cutoff@3 Cutoff@3 gen. filter
Hypertension Statins Blood Pressure 241 45 >161000 >42000 Proton pump inhibitors Blood Pressure 41 15 >38000 >15000
Diabetes Alpha blockers Diabetes 151 124 >47000 >31000
tions. (2) our system does not provide a search interface but rather surfaces candidates from mining external electronic medical records and validates them via literature-based dis-covery techniques to reduce spurious correlations. (3) We do not limit our explanations to a single connecting entity. Specifically, for drug re-positioning simple similarities be-tween the repurposed drug usually require several hops in explanation. (4) We also do not take into account topic simi-larity or abstract relatedness to allow for more innovation in explanation. Specifically, for drug re-positioning purposes textual similarities between the repurposed drug and disease are very low, as usually they are not known to be linked. (5) lastly, the system presented in our paper was developed and is in use by medical researchers.
EMR data can also be used to discover drug repurpos-ing (Dang, Ouankhamchan, and Ho 2016; Xu et al. 2015). This approach utilizes the large amounts of data collected on patients to discover correlations and connections between drugs and the medical parameters of the patients. While the observational data collected in electronic medical records is valuable as it is contains “real” data (as opposed to theo-retical data that is often found in literature) it also contains much bias and confounding variables. In addition, any dis-coveries based on it will lack any explanation or reasoning. Explanations are typically added at a later stage by experts based on the literature (or their belief and knowledge). The literature repository on the other hand, will be much better at providing reasoning but will lack empirical evidence. To the best of our knowledge, this is the first attempt at combining these two aspects to identify drug repurposing candidates.
6
Conclusions and Discussion
We presented a novel methodology that produces candidates for drug repurposing research by jointly leveraging knowl-edge from a knowlknowl-edge graph of biological processes that is constructed from PubMed and a large medical records database. The approach identifies correlations in large med-ical data repositories and supporting reasoning for a large literature knowledge base (PubMed).
We constructed an interactive system that produces high-quality hypotheses by methodically searching through a large number of candidates and providing biological path-ways to support the influence of the candidate medications on conditions.
Our system is currently in use for research in Israel’s sec-ond largest health care provider, Maccabi healthcare, and provides the medical researcher with both knowledge and data based information supporting the drug repurposing can-didate. Our experience so far demonstrates the usefulness and effectiveness of providing text-based reasoning to algo-rithmic findings. The reasoning paths help eliminate spuri-ous correlations and increase clinical experts’ trust in the framework.
We see promising future research around developing new kinds of interfaces and visualizations that support interactive analyses and study by researchers. We foresee the methods as providing a foundation for a new form of interactive clin-ical research tool for drug repurposing studies.
7
Acknowledgments
This work was supported in part by the Lorry I. Lokey Inter-disciplinary Center for Life Sciences and Engineering.
References
Bodenreider, O. 2004. The unified medical language system (umls): Integrating biomedical terminology.
Chakravarti, I. M., and Laha, R. G. 1967. Handbook of methods of applied statistics. In Handbook of methods of applied statistics. John Wiley & Sons.
Chong, C. R., and Sullivan, D. J. 2007. New uses for old drugs. Nature448(7154):645–646.
Dai, W.; Liu, X.; Gao, Y.; Chen, L.; Song, J.; Chen, D.; Gao, K.; Jiang, Y.; Yang, Y.; Chen, J.; and Lu, P. 2015. Matrix Factorization-Based Prediction of Novel Drug Indications by Integrating Genomic Space.Comput Math Methods Med
Dang, T. T.; Ouankhamchan, P.; and Ho, T. B. 2016. De-tection of new drug indications from electronic medical records. In2016 IEEE RIVF International Conference on Computing Communication Technologies, Research, Inno-vation, and Vision for the Future (RIVF), 223–228.
Dudley, J. T.; Deshpande, T.; and Butte, A. J. 2011. Ex-ploiting drug–disease relationships for computational drug repositioning.Briefings in bioinformatics12(4):303–311. Dunn, O. J. 1959. Estimation of the medians for dependent variables. Ann. Math. Statist.30(1):192–197.
Goh, K.-I.; Cusick, M. E.; Valle, D.; Childs, B.; Vidal, M.; and Barab´asi, A.-L. 2007. The human disease net-work. Proceedings of the National Academy of Sciences
104(21):8685–8690.
Hammer, G. P.; du Prel, J. B.; and Blettner, M. 2009. Avoid-ing bias in observational studies: part 8 in a series of articles on evaluation of scientific publications. Dtsch Arztebl Int
106(41):664–668.
Huang, R.; Southall, N.; Wang, Y.; Yasgar, A.; Shinn, P.; Jadhav, A.; Nguyen, D. T.; and Austin, C. P. 2011. The NCGC pharmaceutical collection: a comprehensive re-source of clinically approved drugs enabling repurposing and chemical genomics.Sci Transl Med3(80).
Hurle, M. R.; Yang, L.; Xie, Q.; Rajpal, D. K.; Sanseau, P.; and Agarwal, P. 2013. Computational drug reposi-tioning: from data to therapeutics. Clin. Pharmacol. Ther.
93(4):335–341.
Kilicoglu, H.; Shin, D.; Fiszman, M.; Rosemblat, G.; and Rindflesch, T. C. 2012. Semmeddb: a pubmed-scale repos-itory of biomedical semantic predications. Bioinformatics
28(23):3158–3160.
Liu, C.-C.; Tseng, Y.-T.; Li, W.; Wu, C.-Y.; Mayzus, I.; Rzhetsky, A.; Sun, F.; Waterman, M.; Chen, J. J.; Chaud-hary, P. M.; et al. 2014. Diseaseconnect: a comprehensive web server for mechanism-based disease–disease connec-tions.Nucleic acids research42(W1):W137–W146. Mu˜noz-Torrero, J. F. S.; Joya-Vazquez, P.; Bacaicoa, M. A.; Velasco, R.; Chic´on, J.; Trejo, S.; Carrasco, M. A.; and Rob-les, N. R. 2014. Proton-pump inhibitors therapy and blood pressure control. International Journal of Pharmacological Research4(3).
Nosengo, N. 2016. Can you teach old drugs new tricks?
Nature534(7607):314–316.
Page, L.; Brin, S.; Motwani, R.; and Winograd, T. 1999. The pagerank citation ranking: Bringing order to the web. Technical report, Stanford InfoLab.
Pearl, J. 2000.Causality: Models, Reasoning, and Inference. New York: Cambridge University Press.
Pearl, J. 2010. The foundations of causal inference. Socio-logical Methodology40(1):75–149.
Rindflesch, T. C., and Fiszman, M. 2003. The interac-tion of domain knowledge and linguistic structure in natu-ral language processing: interpreting hypernymic proposi-tions in biomedical text. Journal of Biomedical Informatics
36(6):462 – 477. Unified Medical Language System.
Rosenbaum, P. R., and Rubin, D. B. 1983. The central role of the propensity score in observational studies for causal effects. Biometrika70(1):41–55.
Shi, Y., and Hu, F. B. 2014. The global implications of diabetes and cancer. The Lancet383(9933):1947 – 1948. Siavelis, J. C.; Bourdakou, M. M.; Athanasiadis, E. I.; Spy-rou, G. M.; and Nikita, K. S. 2016. Bioinformatics methods in drug repurposing for Alzheimer’s disease. Brief. Bioin-formatics17(2):322–335.
Singh, N.; Halliday, A. C.; Thomas, J. M.; Kuznetsova, O.; Baldwin, R.; Woon, E. C. Y.; Aley, P. K.; Antoniadou, I.; Sharp, T.; Vasudevan, S. R.; and Churchill, G. C. 2013. A safe lithium mimetic for bipolar disorder. InNature commu-nications.
Spangler, S.; Wilkins, A. D.; Bachman, B. J.; Nagarajan, M.; Dayaram, T.; Haas, P.; Regenbogen, S.; Pickering, C. R.; Comer, A.; Myers, J. N.; et al. 2014. Automated hypothesis generation based on mining scientific literature. In Proceed-ings of the 20th ACM SIGKDD international conference on Knowledge discovery and data mining, 1877–1886. ACM. Swanson, D., and Smalheiser, N. 1999. Implicit text link-ages between medline records: Using arrowsmith as an aid to scientific discovery. Library Trends48(1):48–61. Swanson, D. R. 1986. Fish oil, raynauds syndrome, and undiscovered public knowledge.Perspectives in Biology and Medicine30(1):7–18.
Sybrandt, J.; Shtutman, M.; and Safro, I. 2017. Moliere: Au-tomatic biomedical hypothesis generation system. In Pro-ceedings of the 23rd ACM SIGKDD International Confer-ence on Knowledge Discovery and Data Mining, KDD ’17, 1633–1642. New York, NY, USA: ACM.
Xu, H.; Aldrich, M. C.; Chen, Q.; Liu, H.; Peterson, N. B.; Dai, Q.; Levy, M.; Shah, A.; Han, X.; Ruan, X.; Jiang, M.; Li, Y.; Julien, J. S.; Warner, J.; Friedman, C.; Roden, D. M.; and Denny, J. C. 2015. Validating drug repurposing signals using electronic health records: a case study of metformin associated with reduced cancer mortality.J Am Med Inform Assoc22(1):179–191.
Zhang, M.; Luo, H.; Xi, Z.; and Rogaeva, E. 2015. Drug repositioning for diabetes based on ’omics’ data mining.