A peer-reviewed, open-access journal of population sciences
DEMOGRAPHIC RESEARCH
VOLUME 28, ARTICLE 42, PAGES 1213-1262
PUBLISHED 18 JUNE 2013
http://www.demographic-research.org/Volumes/Vol28/42/
DOI: 10.4054/DemRes.2013.28.42
Research Article
Drop-out
mayors
and
graduate
farmers:
Educational fertility differentials by
occupa-tional status and industry in six European
countries
Bilal Barakat
Rachel E. Durham
c
2013 Bilal Barakat & Rachel E. Durham.
2. Theoretical framework 1215
2.1 Education and fertility 1215
2.2 Compatibility between occupation, industry and childbearing 1218
2.3 Context and compatibility 1219
3. Data and methods 1220
3.1 Data source and transformations 1220
3.2 Model specifications 1224
4. Analysis and results 1225
4.1 Univariate relationships 1225
4.2 Interactions 1230
4.3 Changes over time 1231
4.4 Main parameter estimates 1235
5. Discussion 1241
5.1 Key implications 1241
5.2 Limitations and directions for further research 1242
5.3 Causal aspects 1243
6. Conclusions 1246
7. Acknowledgements 1246
References 1247
Drop-out mayors and graduate farmers:
Educational fertility differentials by occupational status and industry
in six European countries
Bilal Barakat1
Rachel E. Durham2
Abstract
BACKGROUND
Understanding the relationship of education to fertility requires the disentangling of the potentially confounding effect of social status, which is highly correlated with education.
OBJECTIVE
We contribute to this aim by examining educational fertility differentialswithin occupa-tional groups and industries across a broad swath of Central and Eastern Europe, specifi-cally Austria, Greece, Hungary, Romania, Slovenia, and Switzerland.
METHODS
Cross-sectional individual-level census samples from theIntegrated Public Use Micro-data Series(IPUMS) are sufficiently large to contain sizeable numbers of unusual com-binations, e.g., university graduates in low-status jobs or primary school dropouts in pro-fessional categories. Completed cohort fertility, as well as the share childless and with high parity, are regressed on effects for educational attainment, occupation, industry, and alltheir interactions within a Bayesian framework, and the contributions to the outcome variation are analysed.
RESULTS
Education has a strong, consistent association with fertility outcomes when industry and occupation are held constant. Furthermore, fertility by industry and occupation yields fairly disparate patterns. We also find that differences in completed fertility across coun-tries can be attributed to country-specific compositional differences in education, industry, and occupation, and to interaction effects. However, differences by country in the baseline rate of childlessness and high parity cannot be attributed to such compositional effects.
CONCLUSIONS
The educational fertility gradient in the settings studied cannot be attributed to an occu-pational composition effect.
1Vienna Institute of Demography, Austrian Academy of Sciences. E-Mail: [email protected].
1.
Introduction
Education is strongly related to fertility outcomes, but the theoretical model for this is still surprisingly lacking. This is true particularly with respect to disentangling the relation-ship between fertility and education, and other socio-economic correlates of education (Bollen, Glanville, and Stecklov 2001, 2007). Determining the respective impact of edu-cation (or its timing) and its resulting material and intangible consequences is extremely challenging because educational attainment and focal life choices, such as occupation and family formation, are likely both driven by underlying preferences about each (Hakim 2003; Lesthaeghe and Meekers 1987). Moreover, the relationships between education, career and fertility are complex. Higher fertility goals may discourage career and edu-cational investment, but conversely, an investment in education and/or commitment to a career may lead to lower fertility (Becker 1981; Brewster and Rindfuss 2000). This may be unintentional, by postponing childbearing to the extent that realised fertility is lower than desired. Alternatively, many women place a high value onbothfamily and career and search for balance between them (Kravdal 1994; Lappegård and Rønsen 2005; Liefbroer and Corijn 1999; Santow and Bracher 2001).
To date, there exists a great deal of research exploring the tempo effects of educational attainment on fertility, the relationship between fertility and women’s labour, the proxi-mate indicators of family or career orientations according to academic fields of study, and the direct and indirect quantum effects of education on fertility. However, all such stud-ies are unable to completely overcome the difficultstud-ies associated with the fully recursive relationships involved. The ostensibly exogenous personal values that drive both educa-tional attainment and career choices can be further shaped by the process of education and the accumulation of working experiences. We can neither assume that childbearing behaviour temporally follows educational matriculation, nor that the relationship between childbearing and career is one-way only. Efforts to establish causation are further com-plicated by differential contexts, shaped by institutional, cultural, and structural factors (Matysiak 2011). As Matysiak (2011, 59) points out, the “difficulty [in understanding causal mechanisms] still lies in the unavailability of appropriate data”.
be-tween these characteristics, examining their interactive effects is also essential. Research concerning migration, for instance, has already demonstrated that the correspondence be-tween education and occupation especially matters for the decision to migrate (Quinn and Rubb 2005). Finally, we explore whether variation in fertility according to education and vocational characteristics is country-specific. The application of our findings to causal research is discussed in detail in Section 5.3.
We accomplish our aims by exploiting data that allows us to examine fertility out-comes within unique combinations of education, occupational status and industry. The Integrated Public Use Microdata Series (IPUMS) samples from six Central and Eastern European countries—Austria, Hungary, Greece, Romania, Slovenia, and Switzerland— contain sizeable numbers of women with relatively low educational attainment in high prestige occupations, and conversely, women with high educational attainment in low-prestige occupational groups. Fertility and education data are also available by industry of occupation. Moreover, we are able to examine relationships across different age co-horts to test whether or not sources of variation in fertility are a result of timing effects.
The paper is organised as follows: We first provide a brief review of the existing re-search detailing the ways in which fertility varies according to level of education. This is followed by a review of how vocational characteristics relate to fertility and how con-textual circumstances may affect these relationships. Next, we provide details of the data source and model specifications, followed by univariate and multivariate results. We con-clude with a discussion of the implications of this research in which we elaborate further the limitations and consequences of our findings for further research in general, but causal analysis in particular.
2.
Theoretical framework
2.1 Education and fertility
to lifestyles and opportunities beyond motherhood (Lesthaeghe 1995). In sum, there is something unique and intrinsic about the process or content of education that seems to affect both reproductive behaviour and outcomes.
The decrease in fertility during the First Demographic Transition was undoubtedly driven in large part by increases in women’s participation in education. One particular concern has been timing effects, as prolonged enrolment in school may inhibit fertility or its onset, but in turn, childbearing may preclude further educational attainment. The research examining event timing strongly suggests, however, that the effect of educational participation on fertility outcomes is far more powerful than the other way around. School enrolment and the completion of schooling is powerfully predictive of fertility tempo and hence, ultimate fertility, since enrolment tends to delay the onset of childbearing (Krav-dal 1994; Lappegård and Rønsen 2005; Ní Bhrolcháin and Beaujouan 2012) and union formation (Billari and Philipov 2004; Blossfeld and Huinink 1991; Hoem 1986). These findings likely indicate a prevailing conflict between the roles of student and mother, to a greater or lesser extent depending on the institutional constraints on combining the re-sponsibilities.
Research has also demonstrated that education influences family size preferences. More highly educated mothers are likely to place a high value on having well-educated offspring (Axinn 1993), and in most cases this would discourage bearing a large number of children (Lesthaeghe and Meekers 1987; Martin 1995). However, while research often finds a negative relationship between more years of education and fertility in more devel-oped countries (Bagavos 2010; Liefbroer and Corijn 1999; Martín-García 2009; Muresan and Hoem 2010; Neyer and Hoem 2008), some studies have shown more nuanced effects of education on fertility. For instance, among Norwegian women, Kravdal (1994) found that once wages and partnership status were controlled, the suppressive effect of educa-tion on fertility virtually disappeared, and in another study that the educaeduca-tional gradient in fertility has weakened considerably among recent cohorts (Kravdal and Rindfuss 2008). Among Russian women, Billingsley (2011) demonstrated that women educated for pro-fessional careers postponed childbearing more often, but found virtually no difference in birth rates across educational attainment groups.
female-dominated fields may indicate career paths in which job discontinuity, such as maternity leave or absence to care for young children, may be less problematic in terms of returning to the job market later. Her hypothesis was confirmed with results demon-strating that Norwegian women who had studied for nursing and teaching careers had the lowest probability of being childless and the highest probability of having a third birth. Similar results were found by Van Bavel (2010) among women in 21 European coun-tries. Those who studied care-taking or pedagogical fields were less likely to postpone motherhood, regardless of years of education, suggesting that their field of study signified underlying values about motherhood and career. These conclusions regarding educational fields that attract family-minded women are also evident in studies of women in Sweden (Hoem, Neyer, and Andersson 2006), Austria (Neyer and Hoem 2008; Spielauer 2005) and Spain (Martín-García 2009), where field of study proved to be more strongly asso-ciated with fertility than educational attainment. Thus, to the extent that preparing for a career in care-taking or teaching is associated with higher fertility, it may be justifiable to conclude that realised fertility among these women reflected pre-existing attitudes and values about family. However, it must also be acknowledged that a woman’s ideals con-cerning childbearing can be affected by family-minded friends and peers within such a course of study or her subsequent work environment. In any case, industry of work may serve to some extent as an indicator of fertility preferences.
A second reason for examining field of study is that as a likely correlate of a woman’s later industry and occupation, it may then determine later flexibility that facilitates child-bearing or the subsequent commitment to work that may hinder it. Careers in care-taking, such as nursing, offer the possibility of non-standard shifts and thus provide the flexibility (flexibility in scheduling as well as leaving and re-entering the labour market) required for combining working life and motherhood (Swanberg, Pitt-Catsouphes, and Drescher-Burke 2005). Additionally, teaching careers can be amenable to family life due to the cor-respondence of women’s and children’s daily and seasonal schedules. Beyond practical concerns, research has demonstrated that women who study for high-status occupations begin childbearing at much later ages, due to long educational investments that precluded a willingness to stall career advancement later due to motherhood. Martín-García (2009) demonstrated that women who had prepared for higher-status careers were apparently less willing to jeopardise a lucrative, high-status professional life with a rapid transition to childbearing. Similarly, Edwards (2002) noted that only a fraction of the rise in age at first birth over the last 30 years could be explained by the increase in educational attain-ment. Instead, the particularly lengthy educational requirements of certain high-ranking occupations were responsible for the shift in age at first birth, as longer waiting peri-ods between the end of education and first births were observed among women who had prepared for such careers.
com-pelling insights into how career plans may reflect fertility aspirations, and field of study (or college major) correlates quite strongly with later job (i.e., approximately .80, see Robst 2007). Here, we are concerned with the extent to which occupational status or industry relate to realised fertility, whether via its utility in identifying prior preferences about motherhood, the flexibility each offers, or via its correspondence to lengthy edu-cational investments. We therefore propose that actual reported occupation or industry of work are more proximate to fertility behaviour than field of study during schooling. Thus combining information about attainment, occupation and industry, as we do here, is preferable when analysing the relationship between fertility and vocational choice.
2.2 Compatibility between occupation, industry and childbearing
As discussed above, careers in certain industries, such as health or education, may fea-ture characteristics that increase the compatibility between working life and motherhood. Non-standard working schedules or the prevalence of female colleagues, for example, provide a degree of convenience and camaraderie that are perhaps conducive to childbear-ing. Other industry traits may render having a child (or several children) more favourable, for instance, the job stability and primacy of employees’ rights (i.e., maternity/paternity leave, and family health leave benefits) that often characterize positions in public admin-istrative or service sectors (Adsera 2011; Hoem, Neyer, and Andersson 2006).
Yet perhaps another salient feature of a woman’s career is specific occupation. Oc-cupation often dictates professional prestige and associated autonomy, earnings, wage profiles and employment security. All of these factors bear on the level of compatibility between working and family life. First, occupational status may decide the amount of autonomy a woman has to determine her daily schedule, in order to balance job tasks and child care. Citing Applebaum and Golden (2003) and Bond (2002), Swanberg, Pitt-Catsouphes, and Drescher-Burke (2005) report that someone serving in a professional, managerial or executive occupation is more than two and a half times as likely as those in semi-skilled jobs, such as craft workers, to be able to vary their working hours as they choose. Compared to those in manual labour occupations, such as unskilled operators, they are even more than three times as likely to be able to do so. This does not by itself answer the question of whether or not greater autonomy can off-set longer working hours with respect to their compatibility with family life. All else being equal, greater auton-omy can, however, certainly be advantageous when attempting to balance roles and could facilitate higher fertility.
care for a child carries the anticipation of a substantial financial commitment. So in that sense, childbearing may be more compatible with an occupation that promises higher earnings. On the other hand, having children may interfere with a lucrative career path and thus present a particularly high opportunity cost for a woman in a high status occu-pation. Research exploring this tension has found that several factors may affect the rela-tionship. Kravdal (1994) demonstrated that among women in stable partnerships, higher wages imparted no significant negative effect with the onset of childbearing, suggesting perhaps that women with higher wages could more easily afford child care. Other studies have shown that while women with higher status and higher paying careers may postpone having children for enough time to become established, they subsequently had rather high fertility owing to greater financial stability and job security (Cooney and Uhlenberg 1989; Hoem and Hoem 1989). However, the relationship likely also depends upon a woman’s earnings trajectory, or wage profile. Indeed, several studies have shown that women with relatively high starting wages (as a result of higher educational attainment and occupa-tional status) are more likely to postpone births than those with more slow growing wages (Kravdal 1994; Lappegård and Rønsen 2005; Van Bavel 2010). In sum, the weight of findings seems to suggest that higher prestige and income potential is not by any means a deterrent to fertility, and is perhaps even a stimulant, provided that women can achieve a sense of stability and balance in combining family and professional roles.
2.3 Context and compatibility
The research suggests, however, that employment stability and combining the roles of motherhood and career are dependent on structural and institutional contexts (Matysiak 2011). Period total fertility rates (TFR) in Europe have, on average, been declining over the past few decades (United Nations Population Division 2012). But between 1990 and 2000, with the collapse of the Soviet regime, TFR declined even more steeply in for-mer Communist bloc countries such as Hungary, Romania and Slovenia. Some have associated this decline with the relative increase in opportunity costs in these countries. However, fertility also declined in countries such as Greece, Austria, and Switzerland, where no such change in returns to labour occurred. Researchers have therefore looked toward the effect on fertility of country-specific policies directed towards the combina-tion of work and motherhood. Prevailing cultural attitudes concerning appropriate roles for women may influence such policies, creating incentives, whether intentional or not, that encourage women to make trade-offs between motherhood and labour force partici-pation.
obtainability of paid parental leave or the availability of affordable child care, and struc-tural constraints such as women’s unemployment levels or the prevalence of flexible work schedules. Her analysis concludes that countries with favourable policies and labour mar-ket characteristics, along with egalitarian attitudes towards women’s roles, on average had higher TFRs. Support for similar conclusions has been offered by a number of other re-searchers examining individual country contexts (e.g., for Austria see Sobotka (2009); for Romania see Muresan et al. (2008); for Hungary see Kocourkova (2002); for Greece see Rendall et al. (2010)).
Yet the relationship between contextual factors and fertility outcomes is not entirely straightforward. Matysiak (2011) notes that some countries maintain relatively low fer-tility in spite of favourable policies and few institutional constraints while others demon-strate still below-replacement, but relatively high fertility. Hantrais (1997) also notes in-consistency in the impact of policies intended to stimulate fertility. While in some coun-tries, such policies have caused fertility levels to decline more slowly than they might have otherwise, in others they have yielded little effect. Thus, in any analysis exploring the relationship between context and fertility, it is important to simultaneously consider the population on which the country-level policies are expected to have an impact. It may be that in any policy environment, fertility is more strongly affected by the compo-sitional characteristics of its female population. It is possible that variation in fertility is less strongly related to education in a context where tertiary degree completion among women is commonplace, or conversely, more strongly related when it is not. If so, the effect on fertility of a policy designed to, say, facilitate the balance between a professional career and motherhood, would not be expected to be the same in these two contexts.
In the current study, though we do not explicitly analyse particular policies, we con-trol for their impact to a certain extent by testing whether or not the relationships between women’s educational and vocational characteristics and fertility outcomes vary according to country. In other words, in addition to analysing whether fertility is more strongly related to education, or whether variation is more strongly linked to vocational charac-teristics, we discover if being situated in a particular country explains further variation in fertility or if this interacts with the compositional characteristics of its female population.
3.
Data and methods
3.1 Data source and transformations
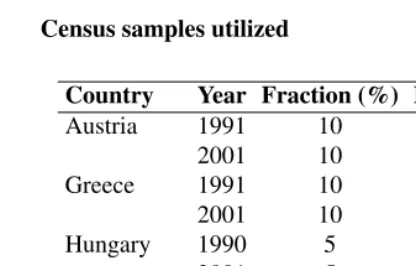
for research use by the IPUMS project (Minnesota Population Center 2011). See Table 1 for details of the included samples. Person weights are constant within each sample and therefore ignored.
Table 1: Census samples utilized
Country Year Fraction (%) Females 40–49
Austria 1991 10 50,370
2001 10 57,230
Greece 1991 10 58,764
2001 10 72,493
Hungary 1990 5 35,425
2001 5 39,211
Romania 1992 10 135,293
2002 10 153,413
Slovenia 2002 10 13,517
Switzerland 2000 5 24,716
Complete birth, educational or occupational histories are not available. Instead, three measures at census time are used as fertility indicators: the number of children ever born (CEB), the percent childless (CL), and parity 4 or higher (P4+). As a result, the analysis focuses mainly on women aged 40 to 49 years, whose birth histories can be assumed to be essentially complete.
For industry and occupation, both original, unharmonized, national census measures and variables were harmonized by IPUMS International. This means the national cate-gories have been mapped to common catecate-gories as carefully as possible to achieve com-parability.
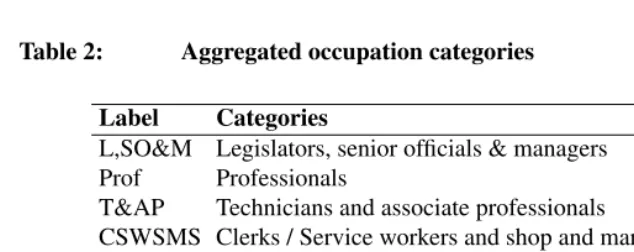
The harmonized codes for occupational status conform to the International Standard Classification of Occupations (ISCO) scheme for 1988. There are ten main harmonized categories, in addition to four kinds of non-response or inapplicability. For increased clarity in our presentation, these are grouped into seven categories for purposes of the present analysis. Our aggregated occupation groups are shown in Table 2.
Table 2: Aggregated occupation categories
Label Categories
L,SO&M Legislators, senior officials & managers
Prof Professionals
T&AP Technicians and associate professionals
CSWSMS Clerks / Service workers and shop and market sales C&RTW Crafts and related trades workers
PMOAE Plant & machine operators and assemblers / Elementary occ. SA&FW Skilled agricultural and fishery workers
Table 3: Aggregated industry categories
Label Categories
A,F&F Agriculture, fishing and forestry H&R Hotels and restaurants
CM Construction/Mining
Manuf Manufacturing
UTC Utilities/Transportation & communications EHSW Education / Health and social work W&RT Wholesale and retail trade
PA&D Public administration and defense
Service Financial services & insurance/Real estate & business services
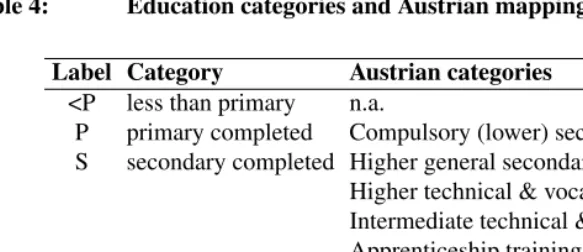
The harmonized education variable does not necessarily reflect any particular coun-try’s definition of the various levels of schooling in terms of terminology or the number of years of schooling. “[It] is an attempt to merge [. . . ] samples that provide degrees, ones that provide actual years of schooling, and those that have some of both” (Minnesota Population Center 2011). The resulting measure is “largely comparable across countries”. The four resulting education levels are:less than primary completed, primary completed, secondary completed, university completed, in addition tounknownandnot in universe responses.
Table 4: Education categories and Austrian mapping
Label Category Austrian categories
<P less than primary n.a.
P primary completed Compulsory (lower) secondary
S secondary completed Higher general secondary
Higher technical & vocational secondary Intermediate technical & vocational Apprenticeship training
T tertiary completed Technical or vocational course (Academic) Intermediate degrees University, college
recorded as having failed to complete compulsory primary schooling in the Austrian sam-ple.
most one category up or down. Only in Greece is this share substantially lower, but still a large majority at over 60%. However, the fact that the results in our main analysis for Greece do not differ systematically compared to the other countries suggests that even such a relatively high level of occupational mobility is inconsequential for our analysis. Moreover, since these figures capture occupational mobility between the first job upon entry into the labour market and the current status in 2005, they overestimate the amount of mobility that affects our analysis. In part simply because some of it will have occurred over the period 2000-2005, i.e. after these cohorts were observed in the census sample we analyse, and partly because some births will have occurred after the first entry into the labour market. At the other end, some of the mobility will have occurred between occupa-tion categories that do not differ in average fertility outcomes. Finally, Bukodi and Robert (2007) found higher education to be associated with greater upward and less downward mobility; in the context of our findings, the bias this creates would tend to decrease the apparent education differential, because the highly educated would be more likely to have been in a lower occupational category with higher fertility at the time of childbearing. In other words, occupational mobility could not explain an apparent educational fertility differential as an artefact. In sum, the empirical patterns of occupational mobility – or rather, of immobility – do not mark this as a cause for concern with respect to our main analysis.
The rationale for the present study is that the sizes of different education-occupation or education-industry cells differ by several orders of magnitude, because of high corre-lation between these characteristics. The Spearman rank order correcorre-lation between the education and occupation classes is approximately 0.65.
3.2 Model specifications
Across all model alternatives below, the mean completed fertilityλis assumed to be a log-linear function of the predictors:
logλi =µ+ M X
m=1
βj(mm) i
Here,jimis the appropriate index for individuali, andβ(m)is the vector of coefficients of “batch”m, andMis the total number of batches. Each batch collects the dummy coef-ficients for one effect, which could either be a main effect or an interaction. For example, if the dummies for the different education categories represent the first batch of coeffi-cients, then theβ1
j would be the coefficients corresponding to the education categories,j1i
would be the index of the education category of individuali, andβ1
j1
i
counts is a Poisson3count model:
yi∼P oisson(λi)
The models for the share childless and the share with parity 4 or greater are structured analogously, but with binomial outcomes and logits as the linear predictor, as is standard for binary outcomes.
4.
Analysis and results
Following a descriptive overview of the main apparent patterns in the data (subsection 4.1), a sequence of inferential models is fitted to investigate different aspects and refine the final specification. Because we wish to fit a model containing all two-, three-, and four-way interactions between education, occupation, industry, and country, it is crucial to maximise the sample size. Two ways of doing this are tested. The first is to expand the age range of women considered. The second is to pool two different census rounds. The first approach is followed in subsection 4.2, which fits a fully saturated interaction model to observations from the year 2000 census round only, but includes the age range 35–54.4
The model in subsection 4.3 retains only the predictors identified as most important. This simplification along one dimension allows increased complexity in another, however. In particular, this model interacts the main predicors with time and is fitted to data from both census rounds, in order to examine the presence of changes over time (respectively between cohorts, which cannot be distinguished here). Here, the age range is restricted to 40–49, so there is no overlap between observed cohorts at the two points in time, which are ten years apart. Because the changes over time are found to be minor, the final analysis (subsection 4.4) is based on the sample that pools the two census rounds, with ages 40–49, and returns to the full interaction model.
4.1 Univariate relationships
Figures 1, 3, and 2 display the level of our fertility outcomes by level of education, in-dustry, and occupation group respectively, in each case for women aged 40–49 during the 2000–02 census round. With regard to education, the expected pattern of a negative univariate association of education with fertility is on the whole confirmed, with some important caveats. Firstly, there are large differences in the size of the education differ-ential between countries, ranging from less than 1 child in Greece to almost 2 children
3An alternative specification in terms of a Gamma count model (Winkelmann 2008) to account for
underdis-persion was also implemented. The results do not change the substantive conclusions and are not shown here.
in Romania. For the latter, this greater differential is actually achieved at both ends: the highest education group has a lower average CEB than the other countries, and the lowest group has a higher average CEB. In Austria the education differential between the top and bottom education level is smallest among the countries.
Similar observations can be made with respect to childlessness. For education levels of primary and up, more education is consistently associated with a higher proportion of childless women in all countries. There is strikingly less variation in the gradient between countries than for CEB. Together with the fact that the differences in childlessness (of less than 10 percentage points) fall short of explaining the differences in CEB, this suggests that the effect of education is stronger at higher birth parities.
The seemingly anomalous pattern of the “less than primary” group being associated with particularly high childlessness, counter to the education effect at higher levels, may be a result of negative selection bias. In all six countries the completion of primary school is expected universally. Among those who did not complete the primary level we would expect to find a disproportionate number of those with health or other challenging issues that at the same time would impact the likelihood of experiencing a childbearing event. Another possible explanation is that women with especially low levels of education may be unreliable reporters of their fertility, perhaps for the same underlying reasons. Fur-ther information regarding health status or cognitive ability would be necessary to furFur-ther investigate this pattern, but in its absence we can only speculate.
Figure 1: Fertility outcomes by education (women aged 40–49, 2000–02 census round)
1.5 2.0 2.5 3.0
<P P S T
children e
v
er bor
n (CEB)
0.0 0.1 0.2 0.3 0.4 0.5
<P P S T
share childless (CL)
0.0 0.1 0.2 0.3 0.4 0.5
<P P S T
schooling
high par
ity share (P4+)
country
Austria
Greece
Hungary
Romania
Slovenia
Figure 2: Fertility outcomes by occupation (women aged 40–49, 2000–02 census round)
1.5 2.0 2.5 3.0
T&AP
CSWSMS Prof
PMOAE
L,SO&M C&RTW
SA&FW
children e
v
er bor
n (CEB)
0.0 0.1 0.2 0.3 0.4
T&AP
CSWSMS Prof
PMOAE
L,SO&M C&RTW
SA&FW
share childless (CL)
0.0 0.1 0.2 0.3 0.4
T&AP
CSWSMS Prof
PMOAE
L,SO&M C&RTW
SA&FW
occupational status
high par
ity share (P4+)
country
Austria
Greece
Hungary
Romania
Slovenia
Figure 3: Fertility outcomes by industry (women aged 40–49, 2000–02 census round)
1.5 2.0 2.5
A,F&F H&R CM Manuf UTC EHSW W&RT PA&D Service
children e
v
er bor
n (CEB)
0.0 0.1 0.2 0.3 0.4
A,F&F H&R CM Manuf UTC EHSW W&RT PA&D Service
share childless (CL)
0.0 0.1 0.2 0.3 0.4
A,F&F H&R CM Manuf UTC EHSW W&RT PA&D Service
Industry
high par
ity share (P4+)
country
Austria
Greece
Hungary
Romania
Slovenia
4.2 Interactions
A key objective of the present study is to analyse education differentialswithinoccupation groups and industries.
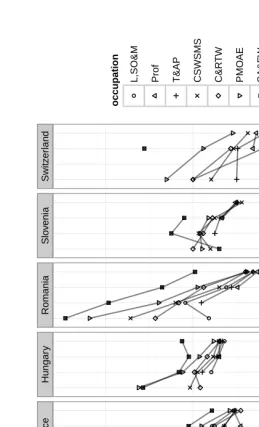
There is a fairly consistent pattern, evident in Figure 4, that in all countries, within the majority of occupation groups, there is an educational fertility differential in the expected direction. This suggests that education has a depressing effect on number of children inde-pendent of social status, income, and other factors normally associated with occupational status. In these and the following graphs, education-occupation dyads with fewer than 20 individuals have not been plotted. For many country-occupation combinations, every step up the education scale is associated with fewer children. In quite a few cases however, the difference between completed secondary and completed tertiary is marginal, non-existent or negative, especially in Austria. Nevertheless, even in these cases fertility is higher for the lowest than the highest education category in virtually all country-occupation combi-nations. The same patterns were confirmed when we examined the extremes of the parity distribution — childlessness and those with four or more children (results not shown). There was, on the whole, a consistent education differential in the expected direction in all countries.
The above analysis was repeated with education level by industry (see Figure 5). Compared to occupation, the industry of work appears to have relatively little effect on education differentials. In particular, education differentials universally persist even in industries intuitively associated with a selection bias towards “child-friendly” women, namely education and health and social work (EHSW). Considering CL did not change these conclusions (results not shown). The results for the industry variable suggest that, perhaps unsurprisingly, industry of work at time of survey is a poor proxy for field of study, since the latter has been shown to matter to fertility more than attainment (Lappegård and Rønsen 2005).
these coefficients means that they differ considerably, and accordingly, the values of the underlying characteristic differ considerably in their effect on the outcome. In the exam-ple, it means that the effect of one education category on predicted fertility will be very different than the effect of another education category. Conversely, if a coefficient batch had a very small standard deviation, this would imply that the coefficients belonging to different levels of the corresponding variable are almost equal. In other words, chang-ing the level of said variable would have little effect on the outcome. Since we consider only (ordered) categorical predictors, questions of scaling do not arise. For our data, the estimated standard deviations are displayed in Figure 6.
While the uncertainty surrounding the estimates is substantial, as evidenced by the width of the estimation intervals, there is a clear indication that education and occupation are the most important sources of variation in CEB independent of country. This is not to say, however, that their effects are not mediated by the country setting. In fact, the interac-tions of country with education and occupation respectively are the next most influential sets of predictors. Next is the main industry effect, followed by its country interaction. The other interactions are minor compared to the main effects above. Overall, the pattern is broadly similar with respect to childlessness and high parities. The notable exception is the variation in the country coefficients. For CEB country-specific education, occupation, industry effects and interactions were key. By contrast, for CL the overall country means differ substantially, as evidenced by the fact that the estimated country effects exhibit a large variation. For high parities, the same pattern can be observed with respect to the country effect. This is unsurprising: if the overall conditional country means are almost equal, but the amount of childlessness differs, then the above-average range of the parity distribution should also differ. Regarding childlessness, again, the association with occu-pational status is even more dependent on context than that of mean completed fertility: the variation in the main occupation coefficients is likely less than that among the coun-try×occupation coefficients, and of a similar magnitude to the occupation×industry interaction.
The next models will focus on the six most influential variance components seen here: education, occupation, industry, and their country interactions.
4.3 Changes over time
Figure 4: Children ever born (CEB) by education and occupation (women aged 40–49, 2000–02 census round)
A ustr ia Greece Hungar y Romania Slo v enia Switz er land ● ● ● ● ● ● ● ● ● ● ● ● ● ● ● ● ● ● ● <P P S T <P P S T <P P S T <P P S T <P P S T <P P S T schooling occupation ●
L,SO&M Prof T&AP CSWSMS C&R
TW
PMO
AE
Figure 5: Children ever born (CEB) by education and industry (women aged 40–49, 2000–02 census round)
A ustr ia Greece Hungar y Romania Slo v enia Switz er land ● ● ● ● ● ● ● ● ● ● ● ● ● ● ● ● ● ● ● ● <P P S T <P P S T <P P S T <P P S T <P P S T <P P S T schooling industr y ●
A,F&F H&R CM Man
uf
UTC EHSW W&R
T
P
A&D Ser
Figure 6: ANOVA display for model regressing CEB, CL, and P4+ on all interactions of education, occupation, industry, and country
CEB CL P4+
● ● ● ● ● ● ● ● ● ● ● ● ● ● ● ● ● ● ● ● ● ● ● ● ● ● ● ● ● ● ● ● ● ● ● ● ● ● ● ● ● ● ● ● ● residual (c*e*o*i) education * occupation * industry country * occupation * industry country * education * industry country * education * occupation occupation * industry education * industry education * occupation country * industry country * occupation country * education industry occupation education country
0.0 0.1 0.2 0.0 0.2 0.4 0.6 0.0 0.5 1.0
est. sd of coefficients
Note: Point: posterior median, Bar: posterior 90 percent interval (.05–.95 interpercentile range).
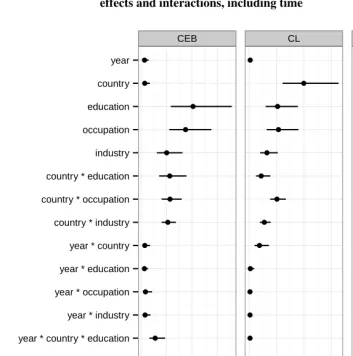
between the earlier and later census rounds is entirely due to changes in the composition of the education, occupation, and industry of employment of women.
There is virtually no change over time in the direct association of the fertility out-comes with country, education, occupation, or industry. The higher-order interactions involving time are also negligible, with the exception of the time change in the country
×education interaction. Even this, however, remains smaller than the six dominant com-ponents selected earlier. In particular, all time interactions exhibit less variation than the residuals.
4.4 Main parameter estimates
Based on the absence of significant changes over time, observations from both census rounds are pooled in the final analysis. Figure 8 displays the estimated parameters for the education and occupation categories. There remains a clear and consistent educa-tion differential after controlling for occupaeduca-tion and industry, as well as country context. The magnitude of the largest negative and positive effects of education and occupation respectively are broadly similar. The smaller magnitude of occupation as a variance com-ponent is mainly due to the fact that the fertility differences between the three highest occupation categories are minimal. For studies in which occupation serves purely as a control variable rather than a factor of intrinsic interest, it might therefore be appropriate to collapse these groups. We also see that the difference in average fertility between the two lowest education groups is mostly due to a reduction in high parity. Conversely, the difference between the two highest education groups results mostly from an increase in childlessness.
Figure 7: ANOVA display for model regressing CEB, CL, and P4+ on main effects and interactions, including time
CEB CL P4+
● ● ● ● ● ● ● ● ● ● ● ● ● ● ● ● ● ● ● ● ● ● ● ● ● ● ● ● ● ● ● ● ● ● ● ● ● ● ● ● ● ● ● ● ● ● ● ● residual (y*e*o*i) year * country * industry year * country * occupation year * country * education year * industry year * occupation year * education year * country country * industry country * occupation country * education industry occupation education country year
0.00 0.05 0.10 0.15 0.0 0.2 0.4 0.6 0.0 0.5 1.0
est. sd of coefficients
Figure 8: Education and occupation effects on predicted fertility outcomes in full interaction model, pooled census rounds
● ● ● ● ● ● ● ● ● ● ● ● ● ● ● ● ● ● ● ● ● ● ● ● ● ● ● ● ● ● ● ● ● ● ● ● ● ● ● ● ● ● ● ● ● ● ● ● ● ● ● ● ● ● ● ● ● ● ● ● ● ● ● ● ● ● 0.8 0.9 1.0 1.1 1.2 1.3 0.6 0.9 1.2 1.5 1.8 1 2 3 4 CEB CL P4+
<P P S T L,SO&M
Prof T&AP CSWSMS C&R TW PMO AE SA&FW
schooling occupational status
m
ultiplicativ
e eff
ect
Figure 9: Predicted outcomes (CEB, CL, P4+) for edge combinations: “e+oi-” for high education, low occupational and industry status (i.e., education: tertiary, occupation: SA&FW, industry: A,F&F); and “e-oi+” for low education and high occupational and indus-try status (i.e., education: less than complete primary, occupation: L,SO&M, industry: PA&D)
Austria Greece Hungary Romania Slovenia Switzerland
●
●
● ●
●
● ●
●
●
●
●
●
● ●
● ●
● ●
●
●
● ●
●
● ●
● ●
0 2 4 6 8
0.00 0.25 0.50 0.75
0.00 0.25 0.50 0.75
CEB
CL
P4+
e+oi− e−oi+ e+oi− e−oi+ e+oi− e−oi+ e+oi− e−oi+ e+oi− e−oi+ e+oi− e−oi+
group
predicted outcome
● observed saturated (all interactions) simple (main effects only)
In discussing these results, it is helpful to think of the data in a way in which each com-bination of education×occupation×industry×country is a cell in a multi-dimensional table. The first thing to note is that even in these large samples, the above combinations are absent or extremely rare in some countries. This means that attempting to estimate or predict the outcomes in these cells based only on the observations they themselves contain is, in most cases, not very informative. This is reflected in the large confidence intervals for the true means underlying the observed values.
Even the simple model with only main effects generates prediction intervals that over-lap with the standard confidence intervals for the observed means. The prediction intervals for the simple model are based almost entirely on information from outside the cells in question, while the confidence intervals for the observed means are based exclusively on observations inside them. Since the simple model captures the conclusion of a consis-tently negative association between education and completed fertility among the women in the study population, this means that the rare combinations provide no strong evidence that would contradict this general pattern. Regardless of whether we consider the effect of all interactions (the difference between the simple and saturated model predictions) or only of the individual residuals in the rare cells (the difference between the observed out-comes and the simple model predictions), there is a balance between overestimates and underestimates, i.e. between cases where the main effect is reinforced or mediated.
It may seem a counterintuitive observation that the saturated model does not necessar-ily shift closer to the observed values than does the simple model. This is explained by the fact that the 2 to 3-way interactions are codetermined by observations for combinations of predictor values that are outside the table in Figure 9. The 4-way interaction, which the fully saturated model includes as one among many, of course always contributes a shift towards the observed value. Examining all education-occupation interaction coefficients jointly, not just the “corner cases” shown here, does not indicate any systematic pattern. In particular, there are no consistent signs along the off-diagonals that could be interpreted as tentative evidence of systematic associations of education-occupation “mismatch” on fertility outcomes.
In terms of the width of the prediction intervals, the model-based estimates represent a large information gain compared to the naive estimation based on the observations in individual cells. This reflects the result noted earlier, in Figures 6 and 7, that the standard deviation of the 4-way interactions is relatively small. This means that, in order to change the outcomes significantly, the coefficients corresponding to the rare country, education, occupation, and industry combinations shown in Figure 9 would not only need to run counter to the overall education differential, but would have to be extremely and atypically large compared to other 4-way interactions.
has a correlation coefficient> .99with the cell means weighted by population. Treating all cell means as equally important targets to fit, in other words calculating the unweighted correlation coefficient between predicted and mean CEB, gives a correlation coefficient of
.65. Of course, taking the latter as the measure would ignore the fact that we are not fitting exactly-known cell means, but that the cells with large and small counts differ in terms of the precision with which their mean to be fitted is actually known. The correlation based on weighting cells by√N to reflect the approximate variance of their corresponding means gives a correlation coefficient of.92.
It is important to note the difference here between weighting that occurs because the estimates from sparse cells have greater uncertainty, and weighting that occurs because the resulting estimate is intended to reflect the population composition. The full model es-timated here fits the cells with large populations better than the rare combinations only for the former reason. If the means for each combination of country, education, occupation, and industry were known exactly, then the estimate of the education level coefficients, for example, would not depend on the distribution of the population among these cells. This is a direct consequence of the sum-to-zero constraints on the different coefficient batches in the variance decomposition performed here. To see this, note that in the fully saturated model with all interactions, improving the fit in a sparse cell does not involve a trade-off with the fit or predicted mean of a more populated cell. However, without changing the actual predicted values in other cells, changing one of the four-way interaction coeffi-cients changes lower-degree interactions and potentially main effect coefficoeffi-cients within which it is nested, purely in accounting terms, because at each level of interaction, the coefficients should sum to zero. The main effect education coefficients, for example, are therefore a function of how the values of the estimated cell means can be attributed to different levels of interaction.
5.
Discussion
5.1 Key implications
The contribution of the present study consists in systematically disentangling the inde-pendent and joint associations between education, occupation, and industry with fertility outcomes, in a cross-country comparison. The conditional associations uncovered point to a number of key conclusions.
The educational gradient in completed fertility, within homogeneous occupational cat-egories, is steeper than the corresponding occupational fertility gradient within homoge-neous education groups. One interpretation of this result is that it would be inconsistent with attempts to explain educational fertility differentials as being largely driven by in-come effects. After all, we would expect inin-come to be determined by occupation rather than by educational attainmentper se. Since both education and occupation affect social status directly as well as indirectly, the results imply that using one or the other as a proxy for social status in the analysis of fertility will be incomplete at best, or worse misleading. Another warning that can be extracted from the analysis is the need to carefully dis-tinguish between industry and occupation. As is evident from many of the results above, the conclusions along these two dimensions differ substantially. This issue needs to be carefully considered when disaggregating education by “subject of study”, since some disciplines (such as law) tend to predetermine an occupational category, while others, especially vocational training, may instead guide towards particular industries (tourism).
While national panel or register data sets are indispensable for sophisticated causal estimation, sources as rich as those used by Kravdal (2007), for example, are not avail-able for a large number of countries, much less in a harmonised form. Studies extracting the maximum of information from such national sources are therefore unable to estimate country effects in a cross-country model. Also, comparative international data sets re-sulting from coordinated surveys never reach a sufficient sample size to reliably estimate the three- and four-way interactions in the above model, because most of the rare cells would remain unobserved. The country×education×occupation×industry interaction component, for example, consists of over 1000 indicator variables. Our result concerning negligible interactions is reassuring, therefore, because it confirms that little information is lost when using simpler data, and indicates which effects and interactions are important to include in simpler models.
can, for these cohorts, be attributed almost entirely to differences in composition. While the countries in question do form an almost contiguous block in central and south-eastern Europe, their diversity along dimensions not covered in the present analysis is enormous, if we compare Switzerland with Greece, for instance. This suggests the result may well hold more generally.
On the one hand, this insight complicates future cross-country analysis. Specifically, it means that, even once data have been harmonised, adding only independent country effects represents a misspecification. On the other hand, it suggests that searching for additional country characteristics omitted here may not be necessary in order to capture between-country heterogeneity in completed fertility. Even at the individual level, the implication is that additional strong predictors of completed fertility need only be sought among those personal characteristics whose average level does not differ between the countries investigated here.
5.2 Limitations and directions for further research
The fact that the analysis provides useful information by itself and for future research does not mean it lacks in limitations. The data exploited in the present study are deep in some dimensions, but limited in others.
husband no doubt also plays a major role in determining social status. In principle, the IPUMS data allows this information to be linked in, paving the way for further analysis in this direction. The absence of data on urban/rural residence means that the coefficients of occupations with a strong rural (or urban) bias is not well identified, especially for the category of “Skilled agricultural and fishery workers”. Not least, despite standardisation, nominally equivalent levels of education may represent quite different experiences in dif-ferent countries, in terms of content, selectivity, prestige, and simply duration. An open question that cannot be conclusively answered based on the data at hand is to what extent the association between higher education and lower fertility is caused by selection, re-flecting the fact that early and high fertility may represent an obstacle to attaining further education.
5.3 Causal aspects
Conditional associational analysis is complementary to “all-cause” analysis and bene-fits from careful consideration of counterfactuals in its own right (Morgan and Winship 2007). Though the cross-sectional nature of our data prohibits conclusive causal conclu-sions, a consideration of causal structures is necessary, because under certain conditions, conditioning on occupation couldintroducebias.
Consider the generic causal graph in Figure 10. In general, it would be possible to identify the direct causal effect between education and fertility E→F, say, if all other paths connecting E and F either contain a variable that is being conditioned on, or contain a segment with the pattern . . .→Y←Z . . . . The key insight is that conditioning on Y in the above case “unblocks” the path and creates a spurious association between X and Z (Pearl 2000; Morgan and Winship 2007). In the present situation, if occupation acts causally on the number of children (O→F), then conditioning on occupation removes a source of bias in estimating the causal association (in whichever direction) between education and fertility; if, conversely, fertility has a negative causal impact on occupation (O←F), then conditioning on occupation willintroducea new bias in estimating the education effect. In particular, given the prevailing directions of association, it would lead to anunderestimate of the negative association between education and fertility.
between education and fertility that is consistent at different levels of occupation. Since we do, however, observe such consistency, we would have to assume that the effect of fertility on occupation takes some rather specific functional form to be consistent with the data. The assumption O→F can therefore not be deduced from our results, but it is consistent with them with fewer assumptions than O←F is.
The implications of this for causally ambitious research on the education-fertility link are problematic. Note that in the case of O←F, there would be no need to condition on realised occupation in causal studies attempting to capture some of the latent variables, or exploiting an instrument for education. If however, as we argue above, we have to assume the possibility of O→F, then conditioning on occupation is necessary, but insufficient, to estimate the relative importance of the paths E→F and F→lF→lE→E.
Figure 10: Stylised causal structures connecting education, occupation, and fertility
education E
occupation O
fertility F ?
? latent education
lE
latent fertility lF latent occupation
lO
instrument I
Moreover, on succeeding in conditioning on realised occupation, the formerly blocked path E→O←lO becomes unblocked, and with it, the entire path (I→)E→O←lO. . .lF→F. This means that even with access to a valid instrument for educationand to latent edu-cation propensities, estimates of E→F would remain biased through occupation. Condi-tioning on the latent fertility dispositions, by contrast, blocks the link between education and fertility through occupation and the latents.
6.
Conclusions
An understanding of the interplay of education and occupation in influencing fertility is vital to assessing the likely impact of long-term labour market trends on demographic change. One of the obstacles to research in this area is the fact that education and occu-pational status tend to be highly correlated. The present study is based on samples large enough to contain sizeable counts of rare combinations, such as university graduates in elementary jobs or primary school drop-outs in high-status occupations. As a result, we are able to examine fertility gradients across virtually the entire range of education levels withinoccupation groups, and to perform statistical inference on these effects. Moreover, this is done in a way that is comparable across several different countries.
Based on the analysis presented here, it can be asserted that among the populations investigated, fertility varies by education level, even conditional on occupation level and industry. Moreover, the association between completed fertility and education is stronger in general than the association with completed fertility of the other two factors. This association is broadly consistent across a number of countries. Moreover, differences be-tween the study-countries in terms of completed fertility can be explained almost entirely through composition effects and contextual interactions with education, occupation, and industry.
The existence of a consistent conditional association between education and com-pleted fertility appears to be incompatible with explanations that attribute educational fertility differentials to differences in average income or social status, which we expect to be related more to occupation than educational attainmentper se. The observed pattern of associations suggests that observed conditional differences in completed fertility are connected with the personal properties of highly educated women. This leaves open the important, but separate, question of whether these properties result from or resulted in their higher education.
7.
Acknowledgements
References
Adsera, A. (2011). The interplay of employment uncertainty and education in
explaining second births in Europe. Demographic Research 25(16): 513–544.
doi:10.4054/DemRes.2011.25.16.
Applebaum, E. and Golden, L. (2003). Who gets to ride high road? the distribution of flexible schedules in the U.S. Paper presented at the Academic Conference on Work and Family, Orlando, FL, 2003.
Axinn, W.G. (1993). The effects of children’ s schooling on fertility limitation.Population Studies47(3): 481–493. doi:10.1080/0032472031000147256.
Bagavos, C. (2010). Education and childlessness: The relationship between ed-ucational field, eded-ucational level, employment and childlessness among Greek
women born in 1955-1959. Vienna Yearbook of Population Research 8: 51–75.
doi:10.1553/populationyearbook2010s51.
Basu, A.M. (2002). Why does education lead to lower fertility? A critical review of some of the possibilities.World Development30(10): 1779–1790. doi:10.1016/S0305-750X(02)00072-4.
Becker, G. (1981).A treatise on the family. Cambridge, MA: Harvard University Press. Billari, F.C. and Philipov, D. (2004). Women’ s education and entry into a first union:
A simultaneous-hazard comparative analysis of Central and Eastern Europe. Vienna Yearbook of Population Research2: 91–110.doi:10.1553/populationyearbook2004s91. Billingsley, S. (2011). Economic crisis and recovery: Changes in second birth rates within occupational classes and educational groups.Demographic Research24(16): 375–406.
doi:10.4054/DemRes.2011.24.16.
Blossfeld, H.P. and Huinink, J. (1991). Human capital investments or norms of role transition? How women’ s schooling and career affect the process of family formation. American Journal of Sociology97(1): 143–168.doi:10.1086/229743.
Bollen, K.A., Glanville, J.L., and Stecklov, G. (2001). Socioeconomic status and class in studies of fertility and health in developing countries. Annual Review of Sociology27: 153–185.doi:10.1146/annurev.soc.27.1.153.
Bollen, K.A., Glanville, J.L., and Stecklov, G. (2007). Socio-economic status, permanent income, and fertility: A latent-variable approach. Population studies61(1): 15–34.
doi:10.1080/00324720601103866.
employees. New York: Families and Work Institute. (mimeo).
Brand, J.E. and Davis, D. (2011). The impact of college education on fertility: Evidence for heterogeneous effects. Demography48(3): 863–887. doi:10.1007/s13524-011-0034-3.
Brewster, K.L. and Rindfuss, R.R. (2000). Fertility and women’s
employ-ment in industrialized nations. Annual Review of Sociology 26: 271–96.
doi:10.1146/annurev.soc.26.1.271.
Bukodi, E. and Robert, P. (2007). Occupational mobility in Europe. Dublin: European Foundation for the Improvement of Living and Working Conditions.
Caldwell, J.C. (1980). Mass education as a determinant of the timing of fertility decline. Population and Development Review6(2): 225–255. doi:10.2307/1972729.
Cochrane, S.H. (1979). Fertility and education: What do we really know? Baltimore, MD: Johns Hopkins University Press.
Cochrane, S.H. (1983). Effects of education and urbanization on fertility. In: Bulatao, R. and Lee, R. (eds.).Determinants of fertility in developing countries. New York: Academic Press.
Cooney, T.M. and Uhlenberg, P. (1989). Family-building patterns of professional women : A comparison of lawyers , physicians, and postsecondary teachers.Journal of Marriage and Family51(3): 749–758.doi:10.2307/352173.
Edwards, M.E. (2002). Education and occupations: Reexamining the conventional wis-dom about later first births among american mothers.Sociological Forum17(3): 423– 443.
European Commission (2005). Eurobarometer 64.1. TNS OPINION & SOCIAL,
Brussels [Producer]; GESIS, Cologne [Publisher]: ZA4413, data set version 1.1.0.
doi:10.4232/1.10969.
Ganzeboom, H.B.G., DeGraaf, P.M., and Treiman, D.J. (1992). A standard international socio-economic index of occupational status. Social Science Research21(1): 1–56.
doi:10.1016/0049-089X(92)90017-B.
Gelman, A. (2005). Analysis of variance: Why it is more important than ever. Annals of Statistics33(1): 1–53.doi:10.1214/009053604000001048.
Hantrais, L. (1997). Exploring relationships between social policy and changing family forms within the European Union.European Journal of Population (Revue européenne de démographie)13(4): 339–379. http://www.ncbi.nlm.nih.gov/pubmed/12348440.
Hoem, B. and Hoem, J.M. (1989). The impact of women’ s employment on
second and third births in modern Sweden. Population Studies 43(1): 47–67.
doi:10.1080/0032472031000143846.
Hoem, J.M. (1986). The impact of education on modern family-union initiation. Euro-pean Journal of Population2(2): 113–133.doi:10.1007/BF01796886.
Hoem, J.M., Neyer, G., and Andersson, G. (2006). Education and childlessness: The relationship between educational field, educational level, and childlessness
among Swedish women born in 1955-59. Demographic Research 14(15): 331–80.
doi:10.4054/DemRes.2006.14.15.
Hopcroft, R.L. and Whitmeyer, J.M. (2010). A choice model of occupational
status and fertility. The Journal of Mathematical Sociology 34(4): 283–300.
doi:10.1080/0022250X.2010.485710.
Jejeebjoy, S.J. (1995). Women’s education, autonomy and reproductive behavior: Expe-rience from developing countries. Oxford: Clarendon Press.
Kasarda, J.D. (1979). How female education reduces fertility: Models and needed re-search.Mid-American Review of Sociology4(1): 1–22.
Kasarda, J.D., Bill, J., and West, K. (1986). Status enhancement and fertility: Reproduc-tive responses to social mobility and educational opportunity. New York: Academic Press.
Kocourkova, J. (2002). Leave arrangements and childcare services in Central Europe: policies and practices before and after the transition.Community, Work & Family5(3): 301–318.doi:10.1080/1366880022000041793.
Kravdal, Ø. (1994). The importance of economic activity , economic potential and eco-nomic resources for the timing of first births in Norway. Population Studies48(2): 249–267.doi:10.1080/0032472031000147786.
Kravdal, Ø. (2007). Effects of current education on second- and third-birth rates among Norwegian women and men born in 1964: Substantive interpretations and methodolog-ical issues.Demographic Research17(9): 211–246. doi:10.4054/DemRes.2007.17.9. Kravdal, Ø. and Rindfuss, R.R. (2008). Changing relationships between education and
Lappegård, T. (2002). Education attainment and fertility pattern among fertility pattern among Norwegian women. Statistics Norway, Department of Social Statistics. (Docu-ments 2002/18).
Lappegård, T. and Rønsen, M. (2005). The multifaceted impact of education on entry into motherhood.European Journal of Population21(1): 31–49. doi:10.1007/s10680-004-6756-9.
Lesthaeghe, R. (1995). The second demographic transition in western countries: An interpretation. In: Mason, K. and Jensen, A. (eds.). Gender and family change in industrialized countries. Oxford: Clarendon Press: 17–62.
Lesthaeghe, R. and Meekers, D. (1987). Value changes and the dimensions of famil-ism in the european community. European Journal of Population12(3-4): 225–268.
doi:10.1007/BF01796593.
Liefbroer, A.C. and Corijn, M. (1999). Who, what, where, and when? Specifying the impact of educational attainment and labour force participation on family forma-tion.European Journal of Population (Revue européenne de démographie)15: 45–75.
http://www.ncbi.nlm.nih.gov/pubmed/12159001.
Martin, T.C. (1995). Women’s education and fertility: Results from 26 demographic and health surveys.Studies in Family Planning26(4): 187–202.doi:10.2307/2137845. Martín-García, T. (2009). The effect of education on women’s propensity to be childless
in Spain: Does the field of education matter? Carlo Alberto Notebooks114.
Matysiak, A. (2011). Interdependencies Between Fertility and Women’s Labour Supply. No. 17 in European Studies of Population. Dordrecht: Springer.
Minnesota Population Center (2011). Integrated Public Use Microdata Series, Interna-tional: Version 6.1. [electronic resource]. Minneapolis.
Morgan, S. and Winship, C. (2007). Counterfactuals and causal inference: Methods and principles for social research. Cambridge University Press.
Muresan, C., Haragus, P.T., Haragus, M., and Schröder, C. (2008). Romania: Child-bearing metamorphosis within a changing context. Demographic Research 19(23): 855–906.doi:10.4054/DemRes.2008.19.23.
Muresan, C. and Hoem, J.M. (2010). The negative educational gradients in Romanian fertility.Demographic Research22(4): 95–114.doi:10.4054/DemRes.2010.22.4. Neyer, G. and Hoem, J.M. (2008). Education and permanent childlessness: Austria vs
Paper; WP-2008-007).
Ní Bhrolcháin, M. and Beaujouan, E. (2012). Fertility postponement is largely due to rising educational enrolment. Population studies (September): 37–41.
doi:10.1080/00324728.2012.697569.
Pearl, J. (2000). Causality: Models, reasoning and inference, vol. 29. Cambridge: Cam-bridge University Press.
Quinn, M.A. and Rubb, S. (2005). The importance of education-occupation matching in migration decisions. Demography42(1): 153–167. doi:10.1353/dem.2005.0008. Rendall, M., Aracil, E., Bagavos, C., Couet, C., Derose, A., Digiulio, P., Lappegard,
T., Robert-Bobée, I., Rø nsen, M., Smallwood, S., and Verropoulou, G. (2010). In-creasingly heterogeneous ages at first birth by education in Southern European and Anglo-American family-policy regimes: A seven-country comparison by birth cohort. Population studies64(3): 209–227. doi:10.1080/00324728.2010.512392.
Robst, J. (2007). Education and job match: The relatedness of
col-lege major and work. Economics of Education Review 26(4): 397–407.
doi:10.1016/j.econedurev.2006.08.003.
Santow, G. and Bracher, M. (2001). Deferment of the first birth and fluctuating fertility in Sweden. European Journal of Population17: 343–363.
Sobotka, T. (2009). Sub-replacement fertility intentions in Austria. European Journal of Population (Revue européenne de démographie)25(4): 387–412. doi:10.1007/s10680-009-9183-0.
Spielauer, M. (2005). Concentration of reproduction in Austria: General trends and dif-ferentials by educational attainment and urban-rural setting.Vienna Yearbook of Popu-lation Research3: 171–195. doi:10.1553/populationyearbook2005s171.
Swanberg, J.E., Pitt-Catsouphes, M., and Drescher-Burke, K. (2005). A question of jus-tice: Disparities in employees’ access to flexible schedule arrangements. Journal of Family Issues26(6): 866–895. doi:10.1177/0192513X05277554.
United Nations Population Division (2012).World population prospects. United Nations.
http://data.worldbank.org/indicator/SP.DYN.TFRT.IN.
Van Bavel, J. (2010). Choice of study discipline and the postponement of motherhood in Europe: the impact of expected earnings, gender composition, and family attitudes. Demography47(2): 439–458. doi:10.1353/dem.0.0108.
Appendix: Tabulations
Table 5: Mean fertility outcomes by country and schooling (cf. Fig. 1)
outcome schooling Austria Greece Hungary Romania Slovenia Switzerland
CEB <P . 2.13 3.05 3.36 1.77 2.20
CEB P 2.04 2.13 2.13 2.60 1.97 .
CEB S 1.72 1.77 1.81 1.82 1.74 1.74
CEB T 1.54 1.56 1.69 1.28 1.49 1.36
CL <P . 0.26 0.16 0.12 0.17 0.11
CL P 0.12 0.08 0.06 0.07 0.06 .
CL S 0.15 0.12 0.07 0.10 0.08 0.20
CL T 0.24 0.18 0.12 0.18 0.15 0.33
P4+ <P . 0.18 0.37 0.45 0.02 0.14
P4+ P 0.11 0.08 0.08 0.24 0.04 .
P4+ S 0.06 0.03 0.03 0.06 0.01 0.06
Table 6: Mean fertility outcomes by country and occupational status (cf. Fig. 2)
outcome occupation Austria Greece Hungary Romania Slovenia Switzerland
CEB L,SO&M 1.51 1.84 1.68 1.51 1.59 1.19
CEB Prof 1.49 1.53 1.70 1.28 1.58 1.29
CEB T&AP 1.48 1.61 1.74 1.55 1.68 1.46
CEB CSWSMS 1.58 1.75 1.81 1.82 1.76 1.54
CEB C&RTW 1.65 1.84 1.91 1.98 1.84 1.59
CEB PMOAE 1.93 2.04 2.07 2.23 1.89 1.92
CEB SA&FW 2.78 2.29 2.13 2.93 2.15 2.54
CL L,SO&M 0.20 0.11 0.09 0.13 0.11 0.37
CL Prof 0.25 0.20 0.11 0.18 0.12 0.36
CL T&AP 0.21 0.17 0.08 0.12 0.08 0.31
CL CSWSMS 0.18 0.14 0.06 0.10 0.06 0.24
CL C&RTW 0.17 0.12 0.06 0.08 0.07 0.23
CL PMOAE 0.12 0.10 0.05 0.08 0.06 0.11
CL SA&FW 0.04 0.05 0.04 0.07 0.05 0.14
P4+ L,SO&M 0.04 0.04 0.01 0.02 0.00 0.01
P4+ Prof 0.04 0.02 0.02 0.01 0.01 0.04
P4+ T&AP 0.03 0.02 0.01 0.02 0.00 0.03
P4+ CSWSMS 0.04 0.03 0.02 0.06 0.01 0.03
P4+ C&RTW 0.06 0.03 0.03 0.08 0.03 0.04
P4+ PMOAE 0.08 0.07 0.06 0.15 0.02 0.06