0 INTRODUCTION
There are many publications on adopting good practices that were introduced during the 90s and have been used since and which refer to directing the focus on consumer demand, material savings and expense elimination (Lean concept) [1] to [4], improvement of quality (Six Sigma, TQM) [5] to [8], product and process development [9],[10] and many others, which are all in accordance with regulations on ecological consciousness, large leading organisations have solidified their positions on a very competitive market [11]. Lean concept, although it originated after World War II in Japan, has undergone a significant worldwide application at the beginning of the fifties after a book “the Machine that Changed the World“ [1] by an MIT professor was published. Authors have presented a model that helped the Japanese car industry (Toyota) achieve incredible rebirth and take leadership position in production compared to the American car industry.
The Japanese model was called Lean, explaining that lean concept provides a way to define factors that affect the creation of new values, control the activities (with tools and methods, for a more detailed description of lean tools and methods see [12] and [13]) that bring values in the best way possible without disrupting the process and enables for the process to be as efficient as possible. Lean means working more with less human effort, equipment, time and space and at the same time provide the product that will satisfy the needs of consumers [2]. Implementation of lean philosophy to production or service systems that do business in more and more
dynamic surroundings of today, require a detailed analysis of time characteristics of the system such as: production takt-time, lead time, delivery time and others. It is known today that one of the more significant problems facing the production industry is timely product or services delivery as a response to an increasing consumer demand, which represents one of the points leading the lean philosophy. In order to better respond to the abovementioned problem Arsovski et al. suggests integration of strategic and tactical decisions and enabling synchronisation and modification of production plans on the production level as soon as possible [14]. In order to introduce synchronisation of the process it is necessary to have a detailed insight into process flows and their overlap. Description and a detailed representation of flows within the production system can be presented by flow maps, i.e. VSM. The book “Learning to See” represents the first publication where Value Stream Mapping is described in detail. Authors have defined VSM with the following sentence: “Wherever there is a product for a customer, there is a value stream” [15]. Authors have also described the benefit gained by using VSM true case study [16].
It is well known that there are companies whose production or service systems are still designed according to the traditional approach and where changes are very difficult to introduce, primarily referring to the management and initiating the awareness about the needs to upgrade the system by using new approaches such as lean. In order to ease the access to new ideas it is not enough to draw up flows of the existing system, it also requires additional
Integration of Simulation and Lean Tools
in Effective Production Systems – Case Study
Božičković, R. – Radošević, M. – Ćosić, I. – Soković, M. – Rikalović, A.
Ranko Božičković1 – Milan Radošević2,*– Ilija Ćosić2 – Mirko Soković3 – Aleksandar Rikalović2
1 University of East Sarajevo, Faculty of Transport and Traffic Engineering, Bosnia and Herzegovina 2 University of Novi Sad, Faculty of Technical Sciences, Serbia
3 University of Ljubljana, Faculty of Mechanical Engineering, Slovenia
Production systems that are by their structure designed according to principles of group technology must, despite their perfection, rapidly adapt to changes in surroundings and engage in a battle with their market rivals. First of all, they must get closer to customers and suppliers, representing one of first principles of lean philosophy. It is one of the ways to successfully valorise comparative values with competition, despite its internal restructuring. This paper presents the influence of certain lean tools as well as application of statistical analyses, simulation and graphics tools for achieving greater effectiveness and efficiency of production systems. Application or integration of these tools enables shortening of the production cycle, reduces the degree of complexity of material flows, reduces the supplies and expenditure of energy resources while it creates an increased degree of functionality of the organisation, utilization of workspace etc. Combination of different tools presented in this paper can valorise new technological, organisational and informational achievements in production that will secure an even better position on the market for industrial systems.
tools that, when combined with VSM, could provide the data in earlier decision and planning phases. Therefore, a tool is needed that would enable the generation of necessary production resources and statistical performances in real time, i.e. a simulation [17]. There is no singular definition of simulation [18] and [19] but it can be observed as a virtual environment [20] or model where the current state of the system is possible due to factors defined as significant for improvement of the observed system to virtually display and predict the behaviour of the future state of the system. As output a real time simulation of the system with relevant data is obtained, tables and it presents a significant support for the management
in making new decisions. According to Raigipol,
simulation models represent a very good tool that can be applied in very complex systems without the need for any detail simplification in order to carry out the simulation [21], on significance and benefits gained by using simulations see [17], [19] and [22] to [25]. The information that the management can gather by applying the simulations enables a comparative analysis of the current and future state of the system, with all performances significant for making decisions concerning whether the system satisfies the initiation of changes; and database as such, represents a significant foundation before lean philosophy is implemented.
1 METHODOLOGY
Application of the graphical (Sigma Flow VSM),
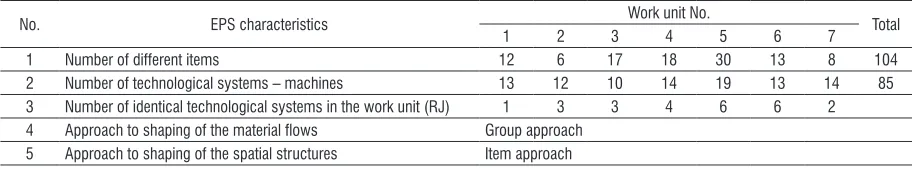
simulation software (Simul8) and the statistical program (Minitab) was done in the industrial system for the production of flexible pipes. The system was, in an earlier period, set on the basis of group technology. Products of this industrial system were sorted into groups based on KS-IIS-08 classification system [26] and are produced in seven work units functioning as production units, depending on which group they belong to. Effective production system structure referring to a total number of work units,
technological systems and other characteristics is given in Table 1.
After a global analysis: of the complexity of the material flows, the section of the load of technological systems and the importance to raise the effectiveness
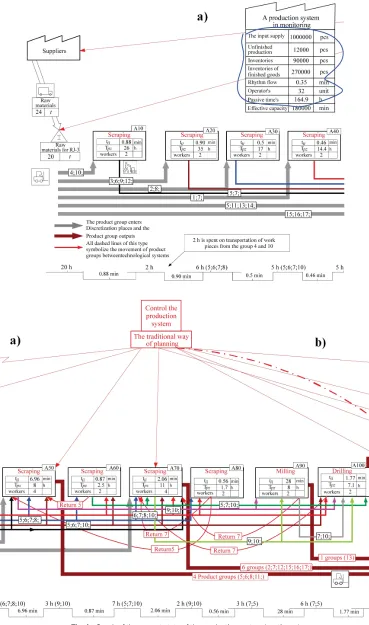
and efficiency in work processes work unit 3 (RJ-3) was chosen for analysis. Visualization of particulars of the current state of the RJ-3 and in the production
system related to the process of supply, flows, supplies, unfinished production, the number of employees working in the work process, technological
cycles, preparatory-finalizing time and work process
rhythm are analysed in the graph of the state done
with Sigma Flow VSM (Fig. 1) [27].
With the analysis of the graph, the main storages for raw materials, semi-products and finished products can be seen. Interpretational storages, which
are used as queue points for work subjects for the
next operation, control and dispatch of parts are also visible.
The timeline at the bottom of the depicted graph has two components:
a) Duration of the operational cycles (value – added
time) is 43 minutes for operations conducted in the work unit, 1.5 minutes for surface protection and 2.5 minutes for the production of finished products;
b) Non-productive time (non value added time) which is in total 240 hours: 109 for transport and waiting and 131 hours for preparation and finishing.
The state of the work unit RJ-3, production system is based on the traditional MRP planning (material
requirements planning), based on the employment of the capacity of machines and people. This includes the state of push production (material purchasing from suppliers), storing at the company, lathe processing, milling machine processing, drilling, surface protection and installation. In front of every work station there is an auxiliary storage for unfinished production (Storage WC1 to storage WC10) and a check point. The graph demonstrates the return and
Table 1. Structure of the effective production system
No. EPS characteristics Work unit No. Total
1 2 3 4 5 6 7
1 Number of different items 12 6 17 18 30 13 8 104
2 Number of technological systems – machines 13 12 10 14 19 13 14 85
3 Number of identical technological systems in the work unit (RJ) 1 3 3 4 6 6 2 4 Approach to shaping of the material flows Group approach
canceled material flows, large waiting lines in front of work centers, forbidden unfinished production and a longer waiting period for the delivery of products to the buyer.
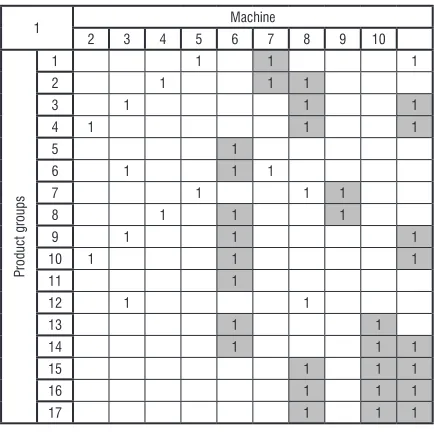
17 different parts of products (P1, P2, …, P17), being produced on 10 different machines
(WC1, WC2, …, WC10) are produced in RJ-3. The graphic depiction of the flow of material in RJ-3 is demonstrated in (Fig. 2). Based on these depictions
Fig. 1. Graph of the current state of production system (extension)
it can be concluded that the flow path for 6 to 8 and 14 to 17 does not comprise of progressive movement between neighboring machine pairs and that there are reverse and cross flows.
1 Machine
2 3 4 5 6 7 8 9 10
Product groups
1 1 1 1
2 1 1 1
3 1 1 1
4 1 1 1
5 1
6 1 1 1
7 1 1 1
8 1 1 1
9 1 1 1
10 1 1 1
11 1
12 1 1
13 1 1
14 1 1 1
15 1 1 1
16 1 1 1
17 1 1 1
Fig. 3. Preview of the initial matrix for RJ-3
By creating material flows we have accessed the transferal of paths to the initial matrix “machine-part” that demonstrates the presence “1” or absence “0” of
parts on the specific machine (Fig. 3).
By using the data 0-1 two matrixes of Jaccard‘s
similarity coefficient SC are generated – one for parts and one for machines (Fig. 4).
S a
a a a
D ij
i j ij
=
+ − ,
where number of parts present at i and j machine, number of parts present at i machine, and number of parts present at j machine.
1 2 3 4 5 6 7 8 9 10
1 1 0 0 0 0.111 0 0.111 0 0 0.200 2 0 1 0 0 0.200 1.166 0.200 0 0 0.182 3 0 0 1 0 0.111 0.250 0.111 0.333 0 0 4 0 0 0 1 0 0.250 0.111 0.333 0 0.100 5 0.111 0.200 0.111 0 1 0.100 0 0.111 0.192 0.214 6 0 0.165 0.250 0.250 0.100 1 0.100 0 0 0.091 7 0.111 0.200 .0111 0.111 0 0.100 1 0.111 0.300 0.417 8 0 0 0.333 0.333 .0111 0 0.111 1 0 0 9 0 0 0 0 0.182 0 0.300 0 1 0.400 10 0.200 0.182 0 0.100 0.214 0.091 0.417 0 0.400 1
Fig. 4. Jaccard’s matrix of the machine similarity coefficient
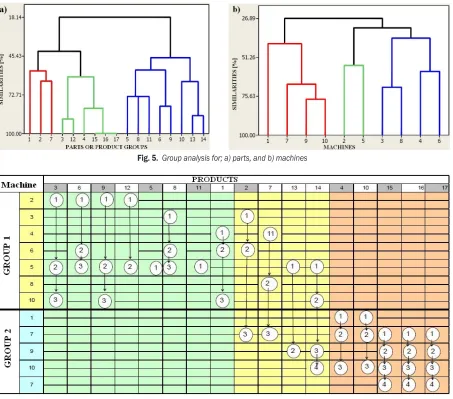
By using the similarity matrixes in the statistical program MiniTab an analysis has been performed of the hierarchical grouping of the machines and products. Based on the results 5 departments have been formed in the raw material storage (queue P1,
P10 WC1, etc.), (Figs. 5a and b), four groups of
machines with auxiliary product storages, establishing product kanban cards. The final group of machines at the installation work unit supplies the time for the tact, meaning the necessary rhythm for the product delivery to a specific buyer. On the researched basis it is possible to perform a reconfiguration of the space structure of a work unit (layout).
With the performed grouping the final appearance of the reconfigured layout of technological systems
and flows in RJ-3 is achieved which is shown in Fig.
6 and it represents all parts as a single operating group and two groups of machines between which there are only four inter-group progressive flows.
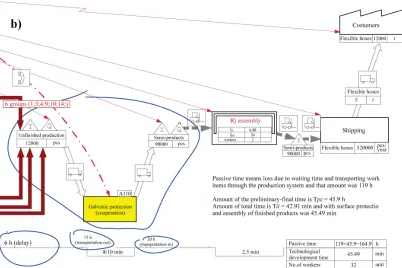
Based on the given graph and observed deficiencies we have approached the production of the graph of the future state (VSM) of the production system with progressive material flows, eliminated reverse and interrupted flows, kanban system, on buyer demand production- pull system, known as “lean production system”, (Fig. 7) [27].
2 SIMULATION AND STATISTICAL ANALYSIS
After applying the graphic software we move on to the simulation of the production system by using simulation software (Simul8). The simulation is used for predicting the future state of the system based on
Figs. 1 and 7 where the graphic depictions of current
and future state of the system are shown. The main elements of the model, measurement parameters in the simulation and the simulation of the given system case can be seen in paper [28]. After the simulation with the Simul8 software package, a factor 23 analysis was
performed of the lean principle and tools (production system, TPM and SMED). The influence of the aforementioned factors was observed in relation to: 1. duration of the production cycles Tcp and
2. size of stock in the processes.
Data on duration of the production cycle on every level is provided in Table 2. The data from the first measurement in both EPS (current and future)
was compared to the measured sizes in the realistic
Fig. 5. Group analysis for; a) parts, and b) machines
Fig. 6. Reconfigured layout of the technological systems and flows RJ-3
the demonstration of dependence between observed factors.
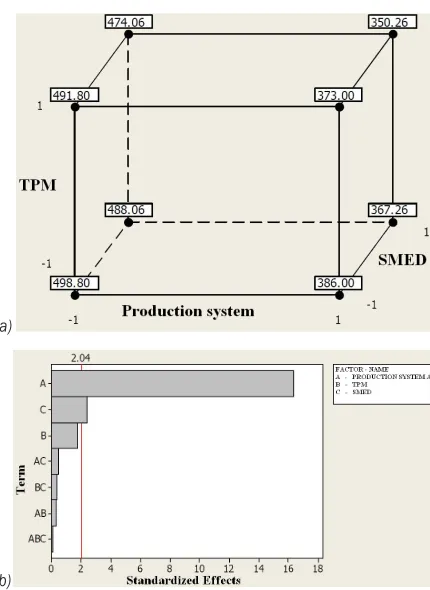
The spatial layout of the plan of the experiment
is presented in Fig. 8a. The numbers next to the tops
of the squares represent the mean duration of the production cycle for the given factor level. While the graphic depiction of the influence of the observed factors on the production cycle (Pareto diagram) is
given in Fig. 8b.
From Fig. 8b it is visible that factor “a”
(production system) has the biggest influence. It is followed by factors “c” (SMED), “b” (TPM) and a combination of factors “ac”, “bc”, “ab” and “abc”. It can be determined that a triple interaction is not significant. ANOVA output from Minitab sums up the main effects for three factors into one measure, which can be visible in Table 3. The value of ’’P’’ in the table
is from 0 to 0.919. The factors that have a value closer
to zero have higher influence significance on the
production cycle. It is visible that the biggest effect is produced by factor “A”, i.e. production system, its layout and pull principle. The interaction between factors “production system × SMED” is the strongest and amounts to -1.62 i.e. it produces the effect of 3.25. Model results of T estimate the value of each factor and an interaction between them. T-test in the table reveals and ranks the importance of certain factors: production system, SMED and finally TPM. However,
Fig. 7. Graphic depiction of the future state of the production system
Tcp. The “F” value in the tables represents the Fisher
criteria for significance evaluation. Residual value in relation to the order of data is shown in Fig. 9. The
behavior of the main effects of factors (production system, SMED and TPM) in production cycle Tcp is
presented in Fig. 10, and their interaction in Fig. 11.
From the figure it is clearly visible that by going
a)
b)
Fig. 8. a) Spatial layout of the plan of the experiment; b) Pareto diagram of the influence of factors on production cycle
Table 2. A tabular presentation of Tcp in an effective production system
Effective Production System - EPS
TPM
Measure-ments without SMED with SMED
without with without with
PUSH + existing layout
519 500.3 499 480.3 1
550 510 480 490 2
450 460 500 480 3
470 450 470 430 4
500 520 510 490 5
-a, -b,
-c (1) +c (c)-a, -b, -a, +b, -c (b) +c (abc)-a, +b, Code
Reconfigured EPS with PULL principle
390 371.3 370 351.3 1
400 380 380 360 2
410 360 370 355 3
360 350 365 345 4
370 375 380 340 5
+a, -b,
-c (a) +c (ac)+a, -b, +a, +b, -c (ab) +c (abc)+a, +b, Code
Tcp = 429 – 59.5 Production system –
– 6.38 TPM – 8.75 SMED . (1)
The regression analysis of the influence of factors is given in Table 4 from where the behavior of Tcp
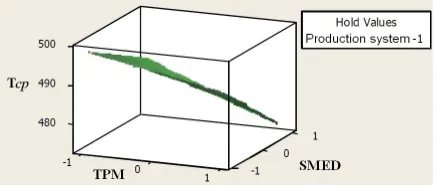
depending on the observed factors can be determined. The spatial layout of the plot comprised of Tcp with
two factors is presented in Figs. 12 to 14.
Table 3. Determined effects and coefficients for Tcp (Table from MiniTab)
Estimated Effects and Coefficients for Tcp (code units)
Term Effect Coef SE Coef T P
Constant 428.66 3.664 117.64 0.000 Production
system -119.05 -59.53 3.664 -16.34 0.000
TPM -12.75 -6.37 3.664 -1.75 0.090
SMED -17.49 -8.75 3.664 -2.40 0.022 Production
system A×TPM -2.25 -1.13 3.664 -0.31 0.760
Production system
A×SMED -3.25 -1.62 3.664 -0.45 0.659
TPM×SMED -2.75 -1.38 3.664 -0.38 0.708
Production system
A×TPM×SMED 0.75 0.37 3.664 0.10 0.919
Fig. 9. Residual times Tcp
Fig. 10. The effects of main factors in the observation of the duration of Tcp production cycle
Identical 23 factor analysis has been performed
STOCK = 294190 – 157840Production System –
– 9255 TPM – 10140 SMED . (2)
Fig. 11. Interaction of observed factors
Table 4. Regression analaysis of the influence Tcp (Table from MiniTab)
Regression Analaysis: Tcp versus Production system; TPM; SMED
The regression equation is
Tcp = 429 – 59.5 Production system – 6.38 TPM – 8.75 SMED
Predictor Coef SE Coef T P
Constant 428.655 3.459 123.91 0.000 Production system -59.525 3.459 -17.21 0.000
TPM -6.375 3.459 -1.84 0.074
SMED -8.745 3.459 -2.53 0.016
S = 21.8788; R–Sq = 89.5%; R–Sq (adj) = 88.6% Analaysis of Variance
Source DF SS MS F P
Regression 3 146414 48805 101.96 0.000 Residual Error 36 17233 479
Total 39 163646
3 DISCUSSION
The statistical part of the experiment has mainly been conducted on two primary performances: the duration of a production cycle Tcp and total production stock.
The first analysis proved the effect of the following factors: EPS, SMED and TPM on the duration of the production cycle Tcp and it was discovered that the use of reconfigured EPS, can potentially diminish the production cycle up to 20% (from 519 to approximately 390 hours). The production cycle will continue to diminish if we were to continue using the listed methods, principles and tools of the lean concept. The focus must be turned to TPM being that the technological equipment in the mentioned case is obsolete.
The second experiment analyzed the influence
of the same factors on total stock and had shown the insignificant influence of factor “production tract’’ with pull principle. Inter-operational stock is lowered with this as well as other observed factors by about 3 times (from the average 472,000 to 156,648 pieces).
Fig. 12. Position of the plot Tcp - production system - SMED
Fig. 13. Position of the plot Tcp - TPM - SMED
Fig. 14. Position of the plot Tcp - TPM – SMED
It can be concluded that with the result analysis it has been determined that the reconfigured EPS that has taken into consideration lean tools regarding the shaping of the material flows and spatial structure and the “pull” principle, has produced a more significant effect in relation to the other two factors. In the observed EPS it has been demonstrated that the influence of TPM is lower in relation to SMED.
However, further improvements need to be directed
are definitely important in future work, especially concerning TPM.
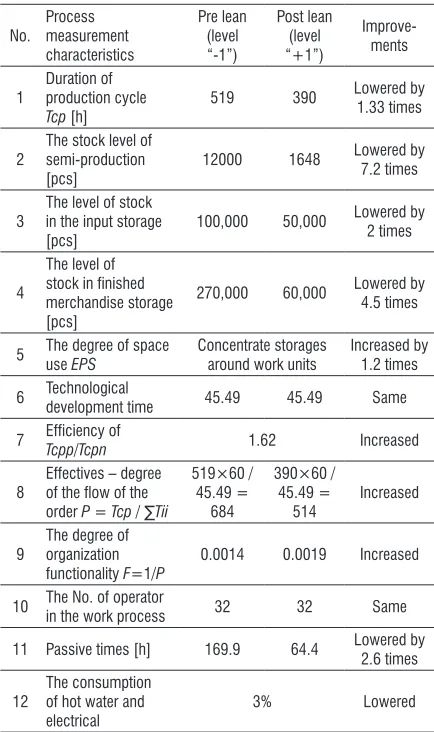
Table 5. Display of achieved results with the use of lean concept
No. Process measurement characteristics Pre lean (level “-1”) Post lean (level “+1”) Improve-ments 1 Duration of production cycle
Tcp [h] 519 390
Lowered by 1.33 times
2 The stock level of semi-production
[pcs] 12000 1648
Lowered by 7.2 times
3 The level of stock in the input storage [pcs]
100,000 50,000 Lowered by 2 times
4
The level of stock in finished merchandise storage [pcs]
270,000 60,000 Lowered by 4.5 times
5 The degree of space use EPS
Concentrate storages around work units
Increased by 1.2 times
6 Technological
development time 45.49 45.49 Same
7 Efficiency of
Tcpp/Tcpn 1.62 Increased
8
Effectives – degree of the flow of the order P = Tcp / ∑Tii
519×60 / 45.49 = 684 390×60 / 45.49 = 514 Increased
9 The degree of organization functionality F=1/P
0.0014 0.0019 Increased
10 The No. of operator
in the work process 32 32 Same
11 Passive times [h] 169.9 64.4 Lowered by 2.6 times
12
The consumption of hot water and
electrical 3% Lowered
This is not considered to be the end of perfection in such a shaped spatial structure of the work unit and an effective production system. The focus can be directed towards rising of the automated transport to the machines.
In the end, it is important to stress that by using
graphic tool Sigma Flow VSM, simulation tool
Simul8 where the simulation has been performed in 10 replications and was based on an eight hour work day, five days a week and statistical 23 analysis with this experiment possible improvements to the system are presented, and total improvement results are shown in Table 5.
4 CONCLUSION
This paper describes the development of the systematic methodology for the implementation of the lean concept in the industrial systems. An effective production system is one of the representatives of the concept of production systems where such material flows have been established that they can be compared to the production in the process industry. The main idea in this paper was conducted in two directions; the first was meant to help the critics to in such or similar situations, use new initiations for upgrading the efficiency by using lean concepts and to become competitors in the global market, and the second to show the increase of efficiency and effectiveness of EPS and to lower the stock and production cycle in relation to the time, up to the moment of observation. It is important to mention the limitations that showed
themselves during the research and were characterized
through non-accepting of changes by the employees,
mostly due to fear of loosing their jobs. Although,
the work itself showed that the efficiency was increased without the change in number of employees.
Realization of the research through time period made
employees and other critics to change their opinion in great measure as well as to accept the changes in a positive way. By developing procedures, steps and phases of implementation of the lean concepts in the mentioned area there are realistic chances for further research that will include the lean concept and the concept of an effective system into one integrated concept for molding the production system.
5 REFERENCES
[1] Womack, J., Jones, D. (1990). Machine that change the world. Macmillan Publishing, New York.
[2] Womack, J., Jones, D. (1996). Lean Thinking: Banish
Waste and Create wealth in Your Corporation.
Simon&Schuster, New York.
[3] Taiichi, O. (1988). Toyota Production System: Beyond Large-Scale Production. Productivity Inc., Portland. [4] Shigeo, S., Dillon, A. (1989). A study of the Toyota
production system from an industrial engineering viewpoint. Productivity Press, Portland.
[5] Tennant, G. (2001). Six Sigma: SPC and TQM in
Manufacturing and Services. Gower Publishing,
Hampshire.
[6] Pyzdek, T., Keller, P. (2009). The Six Sigma Handbook.
McGraw-Hill Companies, Inc., New York.
[8] Vujovic, A., Krivokapic, Z., Sokovic, M. (2011).
Improvement of business processes performances trough establishment of the analogy: Quality
management system – Human organism. Strojniški vestnik - Journal of Mechanical Engineering, vol. 57,
no. 2, p. 151-161, DOI:10.5545/sv-jme.2009.177.
[9] Kušar, J., Rihar, L., Duhovnik, J., Starbek, M. (2008). Project management of product development. Strojniški vestnik – Journal of Mechanical Engineering, vol. 54, no. 9, p. 588-606.
[10] Žargi, U., Kušar, J., Berlec, T., Starbek, M., (2009).
A company‘s readiness for concurrent product and process development. Strojniški vestnik – Journal of Mechanical Engineering, vol. 55, no. 7/8, p. 427-437. [11] Preiss, K., Patterson, R., Field, M. (2004). The future
directions of industrial enterprises. Zandin, K.
Maynard’s Industrial Engineering handbook.
McGraw-Hill Companies, Inc., New York, p. 135-163.
[12] Page, J. (2004). Implementing Lean Manufacturing Techniques, Hanser Gardner, Cinncinati.
[13] Feld, W. (2000). Lean Manufacturing: Tools, Techniques, and How to Use Them, St. Lucie Press,
Florida, DOI:10.1201/9781420025538.
[14] Arsovski, S., Arsovski, Z., Mirovic, Z. (2009). The
integration role of simulation in modern manufacturing planning and scheduling. Strojniški vestnik - Journal of Mechanical Engineering, vol. 55, no. 1, p. 33-44. [15] Rother, M., Shook, M. (1997). Learning to See – value
stream mapping to create value and eliminate muda.
Lean Enterprise Institute, Cambridge.
[16] Radošević, M., Ćosić, I., Soković, M., Božičković, R. (2011). Visual stream mapping – Visualise before
acting. XV International Scientific Conference on Industrial Systems, p.44-47.
[17] Abdulmalek, F., Rajgopal, J. (2007). Analyzing the
benefits of lean manufacturing and value stream mapping via simulation: A process sector case study.
International Journal of Production Economics, vol.
107, no. 1, p. 223-236, DOI:10.1016/j.ijpe.2006.09.009.
[18] Law, A. (2006). Simulation Modeling and Analysis, 4th ed. McGraw-Hill, New York.
[19] Chung, C. (2003). Simulation Modeling Handbook: A Practical Approach. CRC Press LLC, Florida,
DOI:10.1201/9780203496466.
[20] Rihar, L., Kušar, J., Duhovnik, J., Starbek, M. (2010).
Teamwork as a precondition for simultaneous product
realization. Concurrent engineering – research and applications, vol. 18, no. 4, p. 261-273.
[21] Raigopal, J. (2004). Principles and applications of
operationa research. Zandin, K. Maynard’s Industrial Engineering handbook. McGraw-Hill, New York.
1677-1694
[22] Detty, B., Yingling, C. (2000). Quantifying benefits of conversion to lean manufacturing with discrete event simulation: a case study. International Journal of Production Research, vol. 38, no. 2, p. 429-445, DOI:10.1080/002075400189509.
[23] Fetvaci, C. (2010). Genereation simulation of involute
spur Gear machined by pinion-type shaper Cutters.
Strojniški vestnik - Journal of Mechanical Engineering, vol. 56, no. 10, p. 644-652.
[24] Tan, Y., Takakuwa, S. (2011). Use of simulation in a factory for business continuity planning. International Journal of Simulation Modelling, vol. 10, no. 1, p. 1-48, DOI:10.2507/IJSIMM10(1)2.172.
[25] Fandino Pita, N., Wang, Q. (2010). A simulation
approach to facilitate manufacturing system design.
International Journal of Simulation Modelling, vol. 9, no. 3, p. 113-168, DOI:10.2507/IJSIMM09(3)4.162. [26] Zelenović, D., Ćosić, I., Maksimović, R. (1998). IISE
– approach in development of effective manufacturing systems – companies, group technology and cellular management. A state of the art synthesis of research & practice, Cluwer pres, New York.
[27] Božičković, R. (2005). Lean concept in efective
manufacturing systems. PhD Thesis, University of
Novi Sad, Novi Sad.
[28] Božičković, R., Ćosić, I., Božičković, Z., Radošević,