1. INTRODUCTION
The detail analysis of fluid flow within a centrifugal compressor is very complicated and generally is not an easy task. The CFD method needs a solid model of the interested domain along with discredited governing equations and boundary conditions. This method is costly and time- consuming and highly depends on the accuracy of the method and the experience of the user. Despite the CFD, the Mean Line Method is based on the basic principle physics equations along with some empirical correlations to incorporate the flow losses. The accuracy of the selected method directly depends on the validity of the empirical models. As a result, using one-dimensional analysis that has a good accuracy for estimating the performance characteristics of a centrifugal compressor is privileged.
There have been variety approaches to one-dimensional performance prediction methods. For example, one can be categorized as scaling methods,
where the fundamental physical laws are largely ignored [1, 2]. This technique mostly depends on the available data. Other methods have tried to define as many different sections as possible through the compressor stage and to be able to incorporate a great variety of geometrical features. Probably, the most recent application of this approach was introduced by Herbert [3]. Moreover, a great deal of effort has been expended increasing the physical definition of the flow. An example of this approach is the jet and wake definition of the fluid flow at the impeller outlet region [4].
During the past several decades, the empirical loss correlation method has been persistently developed, which is well documented in open literatures such as those by Whitfield and Baines [5] ,Yahya [6], Aungier [7], and Denton [8] ,among many others. The accuracy of this approach depends on the empirical correlations that are used. H.W. Oh et al [9] studied the accuracy of loss correlation that presented in open literatures. According to their results, loss correlation of Aungier
Performance Analysis of a Variable Geometry
Turbocharger Using Mean Line Method
J. Mahdavinia1,*, A. Keshavarz2and M. H. Moshrefi3
1,* Msc Student, Faculty. Of Mechanical Engineering, K.N.Toosi University of Technology, Iran, E-mail: [email protected] 2 Associate Professor, Faculty. Of Mechanical Engineering, K.N.Toosi University of Technology, Iran
3 Msc Student, Faculty. Of Mechanical Engineering, K.N.Toosi University of Technology, Iran
Abstract
Turbocharging an engine boosts its power by increasing the amount of input air. This task is accomplished by using the exhaust gas to power a turbine which is engaged with a compressor. The Variable Geometry Turbocharger, VGT is a unique turbocharger that the diffuser vane angle can be changed over a wide range of positions. The mathematics of turbomachinery flow analysis is intensive and uses iterative methods. Most of the flow analyses in the area of turbochargers are either experimental or numerical. Three-dimensional Computational Fluid Dynamics (CFD), two-dimensional multiple streamline and one two-dimensional mean line is the three primary numerically available methods. In this paper a mean line method has been used for predicting the performance of a centrifugal compressor with variable diffuser vane angle position at subcritical Mach numbers. The calculation is based on common thermodynamic and aerodynamic principles, and empirical correlations for losses in a mean line analyses. The model calculates the velocities, pressures, temperatures, pressure losses, work consumption, and efficiencies for a specified set of turbocharger geometry, atmospheric conditions, rotational speed, and fluid mass flow rate. The obtained numerical results are validated with the in house measured experimental data and good agreement observed. The purpose for compressor model analysis is to generate overall characteristic map and identify the impact of the diffuser vane angles on the performance. The overall characteristic map is generated by this method demonstrate very good agreement and the effect of variable vane angle in pressure ratio and operating range observed.
Keywords:mean line method, turbocharger, centrifugal compressor, performance
[7] has a better accuracy compared to other methods. In this paper a mean line method has been used for predicting the performance of a centrifugal compressor at subcritical Mach numbers. The calculation is based on common thermodynamic and aerodynamic principles, and empirical correlations for losses in a mean line analyses.
2. PERFORMANCE EVALUATION OF A CENTRIFUGAL COMPRESSOR
Analysis is performed at only one radial station at the root mean square radius (r.m.s) is performed. Values of quantities at these radii are taken to characterize the whole stage annulus and such methods are commonly known as one-dimensional or mean line analysis. The r.m.s radius divides the annulus into two equal annular areas and is the mass averaged mean radius for a uniform flow. This radius is also quite independent of the axial velocity profile for stages with gradients of axial velocity with radius. It is defined as [7]
(1)
3. LOSS PARAMETER
The dimensionless loss parameters ù of the components are computed as functions of the geometry, velocity, temperature, and pressure. The calculation of loss parameters for each component such as impeller, vaneless diffuser, vaned diffuser and volute are described in the following sections individually.
3.1. Impeller
The dimensionless losses of the impeller are developed in the rotating frame of reference and are converted into a total relative pressure loss described by Aungier [7]
3.2. Incidence Loss
Incidence is an important parameter in design of impeller, thus, numerous experiments have been conducted to ascertain an optimum incidence. The incidence loss equation is according to Aungier [7]
(2)
3.3. Diffusion loss
The diffusion loss has the constraint of being a non-negative value. This can be expressed as [7]
(3)
3.4. Choke Loss
The choke loss requires the calculation of a contraction ratio (Cr) and a constraint condition. The constraint condition must be greater than zero; otherwise the choke loss is zero. The choke loss, contraction ratio, and constraint condition are given as [7]
(4)
(5)
(6)
3.4. Skin Friction Loss
The skin friction loss incorporates the losses created by the resistance of air over the surface area, thus skin friction depends on a Reynolds number, hydraulic diameter DH, and friction coefficient cf. The friction coefficient developed by Aungier [7] has constraint conditions that
Determines if the flow is laminar or turbulent and for each of them the friction coefficient is calculated separately:
(7)
(8)
3.5. Clearance gap loss
The clearance gap loss is a function of the clearance gap leakage flow rate . Moreover the clearance gap leakage flow rate is a function of the velocity of
ሶ
ୡ୪ഥଶൌሺଵ ଶ
ଵଶሻ
ʹ
Ȧୗൌ Ͷ ሺ
ഥ ଵ
ሻଶ
ୌ
୰ൌ ඨ ଵȕଵ
୦
ൌ ͳͳ െͳͲ୰୦ כ
Ȧେୌൌ ͲǤͷ כ ሺͲǤͲͷ ሻ
Ȧୈ୧ൌ ͲǤͺ ቂͳ െ భ
భ ቃ
ଶ
െȦ୧୬ୡǢ ሺȦୈ୧ Ͳሻ
߱ൌ ͲǤͺ ͳ െ ܥଵ ܹଵሺߚଵሻ
൨ ଶ
ݐଵܼ ʹߨݎሺߚଵሻ
൨ ଶ
r
r.m.s2=
ݎ
௧ ଶ ݎ
ଶ
ʹ
the leakage flow . The velocity of the leakage flow is a function of the pressure difference across the gap . The clearance gap loss and its conditions are described mathematically as [7].
(9)
(10)
(11)
(12)
3.6. Blade Loading Loss
The blade work coefficient IBis a function of the impeller exit flow coefficient , the slip factor , and tip distortion factor . The blade work coefficient and exit flow coefficient are given as [7]
(13)
(14)
Blade loading loss is expressed as
(15)
(16)
3.7. Expansion Loss
The tip distortion factor is a function of the tip blockage equation. The tip block equation uses velocity pressure pvand a passage area ratio AR. The tip distortion, blockage equation, velocity pressure and passage area ratio are given as [7]
(17)
(18)
(19)
(20)
The expansion loss, also known as the blockage loss equation, is described mathematically as
(21)
3.8. Hub-to-Shroud Loss
The hub-to-shroud loss is a function of the passage curvature kmand an average of the relative velocities and is described mathematically as [7]
(22)
(23)
(24)
3.9. Wake-Mixing Loss
The wake-mixing loss requires that a constraint condition be applied to the relative separation velocity that is calculated using the equivalent diffusion ratio Deq. The equivalent diffusion factor equation is [7]
(25)
(26)
The constraint condition applied to the relative separation velocity requirement is described mathematically as [7]
(27)
(28)
The wake-mixing loss is defined as [7]
ୗൌమୈ౧
ଶ ሺୣ୯ ʹሻ
ୗൌ ଶ ሺୣ୯ ʹሻ
୫ୟ୶ൌ
ଵଶାο ʹ ୣ୯ൌ
୫ୟ୶ ଶ
ഥ ൌଵ ଶ ʹ ത୫ൌ
ĮେଶെĮେଵ
Ȧୌୗൌ൫ത୫തഥ Τ ଵ൯
ଶ
ȦȖൌ ቈሺȖെ ͳሻ୫ଶ
ଵ
ଶ
ୖൌ
ଶ൫ȕଶ൯
ଵ൫ȕଵ୦൯
୴ൌ ୲െ ୱ
ଶൌȦୗ ୴ଵ ୴ଶ
ඨଵୌ ଶଶ
ቈͲǤ͵ ଶ ଶ
ଶ ୖ
ଶȡ ଶଶ
ȡଵ
ʹଶ
Ȗൌ ͳ ͳ െ ଶ
O
ο ൌʹʌଶଶ
Ȧൌ
ሺο Τ ଵሻଶ
ʹͶ ଶൌ
ሶ
ȡଶଶଶ
ൌı൫ͳ െȖଶ ൫ȕଶ൯൯ െ
ଵଵ
ଶଶ
O
ଶ ıοେൌ
ሶሺଶ୳ଶ̴ଵ୳ଵሻ ҧത
େൌ ͲǤͺͳඨ ʹοେ
ȡଶ ሶୡ୪ൌȡଶେ
Ȧୡ୪ൌ
ʹሶୡ୪οୡ୪
ሶȡଵଵଶ
οେ
େ
(29)
(30)
(31)
4. VANELESS DIFFUSER
The governing equations for one dimensional flow in vaneless passage, including wall friction loss, flow diffusion and passage curvature flow diffusion losses, that be presented[7]
(32)
(33)
(34)
(35)
And the analogy used for the vaneless annular passage is
(36)
(37)
Based on comparison, an empirical diffusion efficiency model was formulated as follows
E=1 ; D
(38)
(39)
(40)
Where the diffusion term is given by
(41)
The passage curvature loss is given by
(42)
The vaneless annular passage analysis consists of integrating equations (32) through (35) along the passage length, subject to the auxiliary relations presented above. The equations are cast into finite difference form and solved in a direct marching technique from inlet to discharge.
5. VANED DIFFUSER
The loss parameter which has the greatest effect on the compressor efficiency/discharge pressure is the skin friction loss and it is a function of the boundary layer approximation ( ). The vaned diffuser skin friction is also a function of the friction coefficient. The vaned diffuser skin friction loss parameter and boundary layer approximation are mathematically described as [7]
(43)
(44)
5.1. Incidence Loss
The incidence loss in the vaned diffuser also plays an important role in the pressure loss. The incidence loss for the vaned diffuser has a boundary condition which is dependent on the absolute stall velocity described as [7]
(45)
The incidence loss parameter is mathematically described as [7]
(46)
Ȧ୧୬ୡൌ ͲǤͺ ቀ େయିେయכ
େయ ቁ
ଶ
Ǣ ଷ ଷୗ
ଷୱൌ ୫ଷ Įଷୱ
ʹį
ୌൌ
ͷǤͳͶʹ
ୌ ͳ
Ȧୗൌ Ͷ ൬
ୟ୴ୣ
ଷ
൰
ଶ
ୌ
ൗ
ቀʹį
ୌ
ൗ ቁǤଶହ
ʹį ୌ େൌ ୫ሺ୲െ ሻ୫Ȁሺͳ͵ɏሻ
ୈ
୫
ൌ െʹሺ୲െ ሻሺͳ െ ሻ
ͳ ɏ
ൌ ͲǤͺඥ୫Τ ; ୫
ൌ ͳ െ ͲǤʹሺ Τ ୫ሻଶ ; Ͳ ൏ ൏ ୫
E=1 ; D Ͳ
୫ൌ ͲǤͶሺଵΤሻǤଷହሺȽሻ ൌ െ
୲ൌ
ͳ ʹ
ଶ
୫
ሺ୳ሻ
ൌ െ
ͳ ɏ
ൌ
ଶ Ƚେ
െ ୫
୫
െ ୫
െ
ୈ
െ େ
ʹɎɏ୫ሺͳ െ ሻ ൌ ሶ
୫ǡ୫୧୶ൌ
୫ଶଶ
ʌଶଶ
୫ǡ୵ୟ୩ୣൌ ටୗଶ െ ଶଶ
Ȧ୍ଡ଼ൌ
୫ǡ୵ୟ୩ୣെ ୫ǡ୫୧୶
ଵ
൨
ଶ
(47)
The vaned diffuser incidence loss parameters are functions of the velocity at the optimum incidence angle that is mathematically described as [7]
(48)
5.2. Choke Loss
The loss due to choking for the vaned diffuser requires the calculation of a contraction ratio ( ) and a constraint condition X. Similar to the impeller the constraint condition must be greater than zero, otherwise the choke loss is zero. The choke loss and constraint conditions are mathematically described as [7]
(49)
(50)
(51)
5.3. Deviation Angle
The actual exit flow angle of the vaned diffuser is calculated using a correlation of the deviation angle and incidence angle developed by Johnsen and Bullock [10] and are mathematically described as [7]
(52)
(53)
(54)
(55)
(56)
(57)
6. VOLUTE
The volute is the final component of the centrifugal compressor. The non-dimensional loss parameter for the vaned diffuser is converted into a total pressure loss. The volute has four non-dimensional losses described below
6.1. Meridional Velocity Loss
For volute there is very little possibility of ever recovering the meridional velocity head. This velocity became swirl components within the volute passage. The loss considered this loss is [7]
(58)
Tangential velocity loss
The tangential velocity loss has a volute Sizing Parameter (SP) boundary condition applied to it and
it is mathematically given as[7]
(59)
(60)
(61)
The skin friction loss is a function of the mean stream line path length (L) through the volute, the hydraulic diameter ( ), and the friction coefficient ( ) that was previously described in the impeller section. The skin friction coefficient is mathematically described as [7]
(62)
(63)
(64)
ୌൌ ඨͶହ
ʌ
ൌʌሺସ ହሻ ʹ
Ȧୗൌ Ͷ ൬
ହ
ସ
൰
ଶ
ሺୌሻ
ୌ
ൌସସ ହହ
Ȧ
ഥ
ൌ
ଵ ଶ
୰రେరమ
୰ఱେరమ
ቂͳ െ
ଵ
ୗ
ቃ
;
ሺ ൏ ͳሻ
Ȧ
ഥൌ ଵ ଶ
୰రେరమ
୰ఱେరమ ቂͳ െ
ଵ
ୗమቃ ;ሺ ͳሻ Ȧ୫ൌ ൬୫ସ
ସ൰
ଶ
߆ ൌ ߚସെ ߚଷ
߰ ൌ ݖሺݎସെ ݎଷሻ ʹߨݎଷ൫ߚҧ൯
Τ ൌൣʹ െ ൫ȕത െȕଷ൯ȀሺĬሻ൧
͵
įכൌ
ĬͲǤͻʹ ቀ ቁଶ ͲǤͲͲʹ൫ͻͲ°െȕସ൯൨
ඥȥെ ͲǤͲͲʹĬ ߲ߜ
߲݅ ൌ ቈ߰ ቆ൬ͳǤͷ െ ߚଷ Ͳ°൰
ଶ െ ͵Ǥ͵ቇ Įସൌȕସെįכെ
μį
μ൫ȕଷെĮଷ൯
୰ൌ ඨ
ଷ Ⱦଷ
୦
ൌ ͳͳ െͳͲ୰୦ כ
Ȧେୌൌ ͲǤͷሺͲǤͲͷ ሻ
୰
୫ଷ
ଷכ
ൌ ට൫ȕଷ൯ ሺĮ୦ሻ
ଷכ
Ȧ୧୬ୡൌ ͲǤͺ ൬ቀେେయ
యቁ
ଶ െ ͳ൰େమ
େయమ
ሺେయିେయכሻమ
େయమ ൨ ;ଷ ଷ
The exit cone loss is mathematically described as [7]
(65)
6.2. Total Loss
Summarizing the losses of any part of compressor will give the total loss in the component. For example vane diffuser total loss is [7]
(66)
For the impeller the relation is
(67)
For the other components, the it can be expressed as
(68)
The input data for the program consists of the value of independent geometry parameters, inlet total pressure, inlet total temperature and design of speed operation impeller. Since deviation angle and losses coefficient are related to the velocity at the exit procedure is solved iteratively starting from predicting value for axial velocity at the exit of each component. All of the components of the absolute and relative velocities and flow angles are determined, and then total loss coefficient, total and static pressure; total and static temperature and density are calculated at inlet and outlet of each component. With correction of the absolute velocity with density, this procedure to be continued until absolute velocity at the exit of each component is converged [11]. The output of the program is presented at the next section.
7. EXPERIMENTAL VALIDATION AND DISCUSSIONS
The VGT is designed based on a turbocharger
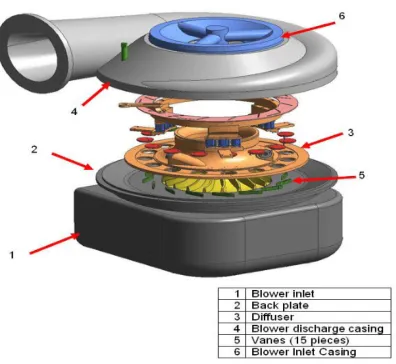
model ET18md2v and modify to create VGT. Testing turbocharger used for heavy duty engine. Table 1 represents the operating conditions for the test cell. The schematic of the tested compressor is shown in figure1. Test cell is worked close loop. Table 2 presents the geometric parameters of the impeller and vane diffuser.
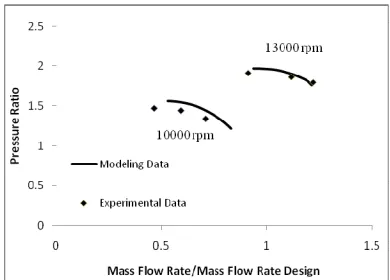
The VGT was experimentally tested at different vane angle positions and rotational speeds. The turbo was first experimentally tested at a vane position labeled “neutral” which is a vane angle of 66° from the radial axis at two rotational speeds, 10,000 rpm and 13,000 rpm. Then, the same test was repeated for a vane position labeled “10° counter clockwise (CCW) which is a vane angle of 76° from the radial axis. Three points are collected along each rotational speed lines and the results are plotted in Figures 2 and 3 along with their corresponding calculated points for comparison. All the collected data are corrected to the standard conditions. The surge point for the compressor was achieved (approximately) during the
ο௧௨௧ൌ ൫௧ǡെ ௦ǡ൯
߱
തതത݅
ο௧ ൌ ݂ሺ௧ଵെ ௦ଵሻ ߱ഥ
߱௧௧ൌȦେୌ+Ȧୗ+Ȧ୧୬ୡ
Ȧେൌ
ହെ ସ
൨
ଶ
Fig. 1.Complete extrusion of the VGT compressor
Inlet Static Temperature(K) 283.844
Inlet Static pressure(pa) 96526.5980
Design Mass Flow Rate(kg/s) 5.1619
Table 1.Operating Conditions for VGT compressor
Parameters Impeller Vaned diffuser
Inlet Area(m2) 0.0489 0.0411 Outlet Area(m2) 0.0313 0.0483 Inlet Root Mean Radius(m) 0.1088 0.2705
Outlet Root Mean Radius(m) 0.2286 0.3166 Inlet Root Mean Blade Angle(˚) 44.99001 19.079 Outlet Root Mean Blade Angle(˚) 26.2377 46.272
Table 2. Geometric parameters of impeller and vaned diffuser
test. This phenomenal was noticed when the compressor starts to vibrate and the mass flow rate fluctuates. In the model the surge is assumed to occur at the highest pressure ratio or when the slope of the speed line changes from positive to negative. Due to the mass flow rate limitation in the test cell the exact location of the stone wall was not able to achieve. Figure 2 shows good agreement between the numerical and experimental performance maps. As the rotational speed is increased, the compressor’s operating range decreases in both the experimental and numerical data. At design point the method predicted pressure ratio within 4.6% error, in addition operating mass flow rate is over estimated within 5.15% error. The reason of the VGT compressor did not fit the experimental data exactly by:
• The loss models presented are general models and have difference accuracy relative to input geometry, flow geometry and other parameters. • The compressor geometry is very important to
the analysis. The compressor geometry was measured from the actual compressor using hand tools (ruler, calipers, and protractor) instead of computer aided drafting tools that can be used to get the highest precision measurements.
In Figure 3 the experimental data and modeling data for the 10° counter clockwise (CCW) vane position and different rotational speeds are compared. As the vane position changes from neutral to 10° CCW, the experimental and modeled speed lines shift to decreased mass flow rates for the different rotational speeds. Pressure ratio increases with 7.7% in design point and mass flow rate decrease by about 1 kg/s for 13000 rpm rotational speeds.
Figures 4 and 5 show the numerical calculated values for a constant rotational speeds of 13,000 and 10,000 rpm at three different diffuser vane angle positions for comparison. They show that the pressure ratio and operating range depends on vane position. As Fig. 2.Performance map neutral vane position Fig. 3. Performance map – 10° CCW vane position
Fig. 4. Vane position comparison for constant rotational speed of 13,000 rpm
.
Fig. 5. Vane position comparison for constant rotational speed of 10,000 rpm
the diffuser vane angle is rotated 10 degree counter clock wise the performance line shifted to the left with higher pressure ratio and shorter mass flow rate in comparison to the neutral case. However, almost opposite to these results are observed for the clock wise. That is the performance line moved to the right with wider mass flow rate and lower pressure ratio.
8. CONCLUSIONS
This paper presents a mean line method to predict a performance map of the major components of a Variable Geometry Turbocharger. The impact of diffuser vane positions on the performance is investigated. Based on the numerical and experimental work the following conclusions can be stated as: • This model can be used to predict performance
map of VGT compressor.
• The compressor performance line moves to the right with the vane rotates clock wise with wider mass flow rate and lower pressure ratio with respect to its original position.
• The compressor performance line moves to the left with the vane rotates counter clock wise with shorter mass flow rate and higher pressure ratio with respect to its original position. • Engaging this type of turbocharger to an engine
gives more flexibility to the engine to operate in wider range of mass flow rate and pressure ratio.
REFRENCES
[1] Kurzke, J. and Riegler, C. “A New Compressor Map Scaling Procedure For Preliminary Conceptual Design Of Gas Turbines”. ASME paper 200-GT-0006, 2000.
[2] Kong, C., Ki, J., and Kang, M. “A New Scaling Method For Component Maps of Gas Turbine Using System Identification”. ASME paper GT-2002–30150, 2002.
[3] Herbert, M. V. “A Method of Performance Prediction for Centrifugal Compressors”. ARC R&M 3843, 1980.
[4] Japikse, D., “Centrifugal Compressor Design and Performance,” Course Notes, Concepts ETI Inc., 8th ed, 1986.
[5] Whitfield, A. and Baines, N. C. “Design of Radial Turbomachines”, 1990.
[6] Yahya, S. M. “Turbines, Compressors and Fans”, 1983.
[7] Aungier, R.H., “Centrifugal Compressors a Strategy for Aerodynamic Design and Analysis”, ASME Press, 2000.
[8] Denton, J. D. “Loss Mechanisms in Turbomachines”. Trans.ASME, J. Turbomachinery, 1993.
[9] Oh, H. W., Yoon, E. S., and Chung, M. K. “Systematic Two-Zone Modelling For Performance Prediction Of Centrifugal Compressors”. Proc. Instn Mech. Engrs, Part A: J. Power and Energy, 2002.
[10] Johnsen, I.A. and Bullock, R.O. “Aerodynamic Design of Axial Flow Compressors,” NASA SP-36, 1965.
[11] M. H. Moshrefi.A, A. Keshavarz, J. Mahdavinia. “Axial Compressor Flow Analysis, Using Mean Line”.ASME,IMECE,2010-38541
NOMENCLATURE
A Area
Number of blades
a Velocity of sound
á Flow angle – absolute
B Fractional area blockage
Flow angle – relative
C Absolute velocity
Deviation angle
c Blade chord
Flow coefficient
h Enthalpy
Ratio of specific heats
I Work input coefficient
Streamline curvature
IB Impeller blade work input coefficient
ë Distortion factor
L Mean streamline meridional length
Gas viscosity
LB Blade mean camber line length
density
M Mach number
solidity Mass flow rate
Pressure loss coefficient
N Rotational speed of turbocharger
p Pressure
Rg Gas constant for air
Red Reynolds number based on pipe diameter
Ree Reynolds number based on surface
roughness s Clearance gap width
T Temperature parameter
tb Blade thickness coordinate direction
U Blade speed V Velocity
W Relative velocity
w Passage width
Subscript
1 inlet
2 Discharge or outlet of system
id ideal
r Relative
s Static
th Throat
U Tangential
rms Root mean square