http://www.sciencepublishinggroup.com/j/ajdmkd doi: 10.11648/j.ajdmkd.20200502.11
ISSN: 2578-7810 (Print); ISSN: 2578-7837 (Online)
Distinguishing True and Fake News by Using Text Mining
and Machine Learning Algorithm
Hyunseo Lee
1, *, Ian Paik Choe
2, *, Jioh In
3, *, Han Sol Kim
4, *1
Seoul International School, Gyeonggi-do, South Korea
2
Seoul Foreign School, Seoul, South Korea
3
Princeton International School of Mathematics and Science, New Jersey, the United States
4
Fayston Preparatory School, Gyeonggi-do, South Korea
Email address:
*Corresponding author
To cite this article:
Hyunseo Lee, Ian Paik Choe, Jioh In, Han Sol Kim. Distinguishing True and Fake News by Using Text Mining and Machine Learning Algorithm. American Journal of Data Mining and Knowledge Discovery. Vol. 5, No. 2, 2020, pp. 20-26.
doi: 10.11648/j.ajdmkd.20200502.11
Received: July 6, 2020; Accepted: July 21, 2020; Published: September 19, 2020
Abstract:
With recent advancements in social media and technology as a whole, online news sources have increased. Therefore there has been a higher demand of people wanting a convenient way to find recent, relevant and updated online news articles and posts from social media platforms. In the current status quo, many people feel comfortable with their main source of news being social media articles. Unfortunately, receiving news via social media platforms and unverified online sites has aroused many problems, one of which being fake news (news which contain incorrect or biased facts and statements). Many individuals all around the world are vulnerable and subject to fake news and becoming victims of propaganda and/or being misinformed. To solve this world-wide complication, we used word preprocessing skills to digest the content of articles, and used several mathematical vectors to pinpoint the legitimacy of a news article. To establish an accurate system, words used in examples of fake news and real news were collected using Python. Verifying fake and real news is an important process that all news should go through as it can result in immense consequences. Data on real news and fake news were collected from Kaggle. We had the conclusion that the trained machine learning algorithms showed high accuracy of distinguishing which indicates our research was successful.Keywords:
Fake News, Preprocessing Data, Data Analysis, Text Mining, Machine Learning1. Introduction
News circulates through more than half of the human population every day [1]. As the number of news articles increases rapidly, the amount of news platforms has become numerous [2] as well. Throughout our lives, many types of media have arisen, such as radios, televisions, online newspapers, and blogs [3]. Unlike traditional news which is printed on physical paper, online news is presented through the internet. The convenience of online media and news has captured the attention of numerous internet users [4].
The number of online news readers is gradually increasing.
People prefer news in forms of online articles, posts and videos because of the economic efficiency, various news choices, recent updates and comment functions [5, 6].
and/or biased news [7].
Fake news imitates the contents and style of true news, but the actual information delivered is fabricated [8]. Ridicule and parody news, written purely to satirize the media with humorous content, have the potential to be treated as real news and be taken seriously [9]. Even if the news contains partially true information, it can be considered as fake news if it uses inappropriate and exaggerated context to gain headlines [9] (also known as clickbait). News with unreliable sources of information such as conspiracy theories and hoaxes is classified as fake news as well [9]. Another example is a misleading website that delivers biased or prejudiced information because it uses skewed and exaggerated headlines as well as unreliable contexts [10].
Even though many types of information platforms are developed, 59% of the world population is still checking their daily information via online news articles [11]. As online news articles are created, the volume of fake news increases proportionally as well. In 2013, approximately 25% of people in the U. S. used social media as their main news source, and in 2017, almost 50% of people in the U. S used social media as a source of news [13]. This data showed that people increasingly used social media to find updated news. However, “social media ha [s] led to the proliferation of fake news and to a greater impact of fake news on public opinion” [13]. Because online news is accessible to upload and spread information, many biased editors started to write fake news through online news. This phenomenon severely ruined journalism as the public isn’t able to validate whether the article contains accurate information or not. In addition, people share fake news on social media, and many people believe it as the truth. “The trouble of the fact news” stated that “Misinformation being spread to young impressionable children has also become far easier due to their instant access to the internet. Only 2% of children under 16 in the UK were able to correctly identify false news stories according to the “National Literacy Trust” [12]. Due to the spread of unvalidated information, victims are suffering. Many kinds of people are incurring from fake news which spread biased and invalid information. Many politicians suffered from biased editors who wrote fake news and ruined their reputation. Many other kinds of bad uses of fake news exist. For example, spreading rumors or using a biased perspective. Not to mention, many celebrities are suffering from fake news that display fake information or biased points of view. It is apparent that fake news has numerous negative effects. We developed a method and program which verifies the plausibility of the news because people have the right to hear and know about real news and to reduce the suffering brought by fake news.
Verifying fake and real news is an important process that all news should go through as it can result in immense consequences. Data on real news and fake news were collected from Kaggle. To establish an accurate system, words used in examples of fake news and real news were collected using Python. Irrelevant words were removed to
reduce processing time and improve accuracy. Then, a list of recurring words in fake news was generated based on the frequency, thus identifying certain patterns found in fake news. From this database, the system would be able to verify if the news was real or fake by scanning for certain criteria and words that were found previously.
2. Related Materials
2.1. TF-iDF
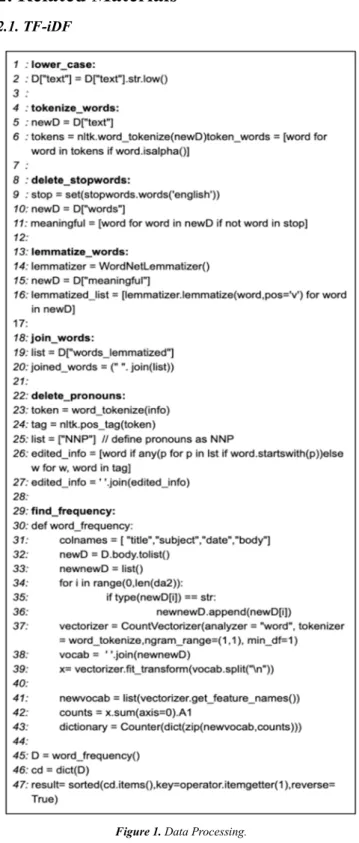
Figure 1. Data Processing.
Document Frequency, is a method for comparing and contrasting the importance of a certain set of words. We used TF-iDF to find the top 10 most valuable and important words for true and false instead of using frequency to make the results more accurate and find which words would define the document or post’s validity.
2.2. Machine Learning Algorithm
2.2.1. Logistic Regression
Logistic regression has a dependent variable with no number (e.g yes or no), and it is used for predicting the output (the output is binary). It performs as a classification based on regression. Logistic regression is performed on the relationship between variables to get the model. At the end of the process, it verifies the variable based on the higher probability of either class [14].
2.2.2. K-nearest Neighbor
K-nearest neighbor (K-NN) algorithm is a simple classification that doesn’t really learn. Instead, K, the odd number, is a number of close data to consider depending on distances between data observed and neighbors. The largest number of data types becomes the type of data observed. Closer data votes more to the type of data observed. K-NN works well on a small scale, but not on a large scale [15].
2.2.3. SVM (Support Vector Machine)
SVM (Support Vector Machine or Support Vector Network) is an algorithm that is used for both classifications as well as regression. SVM finds the decision plane by finding a linear hyperplane that is the farthest from supporting vectors with different class memberships. Kernel SVM uses a Kernel function to create a higher dimensional feature space, and then deriving a linear hyperplane from there, then bringing it back down. RBF Kernel SVM is an algorithm that uses nonlinear features to move the data samples into a higher dimension, then finding the linear hyperplanes from there then projecting it back down to find a hyperplane that works [16].
2.2.4. Decision Tree
Decision trees are a classification method. It continuously divides the data set into smaller subsets according to certain standards. This allows the decision tree to gradually increase its size. It uses a boolean type of standard to divide the data set. The final decision tree contains decision nodes and leaves nodes. Entropy (degree of randomness) and information gain (degree of change in entropy regarding independent attributes) are used to establish a decision tree [17].
2.2.5. Naive Bayes
Naive Bayes is an algorithm that uses Bayes theorem based on the independence between predictors. Independence means that the presence of one feature is independent of the
presence of other features. Bayes theorem is shown in Equation 1. P () represents a probability. Naive Bayes is easy to build and effective for large data sets [18].
( / ) = ( / )∗ ( )
( ) (1)
3. Methodology
To figure out the content of fake news, we must know which words are mainly used in the article. First we preprocessed the data and eliminated useless words. Then, by checking out the frequent words for each type of news and using TF-iDF, we can infer what the content is about, and verify the presence of fake news. Then with that data, we made visual representations of the data, graphs and word cloud, to enhance the understanding. The data was put into different sets of machine learning algorithms.
3.1. Preprocessing Data
3.1.1. Changing the Text into Lowercase
We first changed all texts into the lower case so that later on when we categorize the words, they won’t be recognized as distinct words. We had to make a function with the output of input changed into lowercase. The “Text” column contains the contents of news in a CSV file, so we replaced dataf [“text”] into lowered dataf [“text”] as line 2 from figure 1 shown in the code above.
3.1.2. Separating Words Using Tokenizer
After changing the text into lowercase, we separated the data in string form into words to preprocess. We imported a RegexpTokenizer library to make a function that tokenizes words. The line 5 and 6 from figure 1 was written using Library import. Series of texts were separated into words based on spaces.
3.1.3. Removing Stopwords from the Text
Stopwords, words that contain no specific meanings (such as, pronouns, common verbs, common adjectives and etc.), occur frequently in the text. The stopwords that we removed are shown in Figure 2. Not only does the abundance of these words skew the final results, but they also slow down the program by taking up unnecessary space and memory. To prevent this, we removed these stopwords as shown below. The codes used are line 9 to 11. It returns “meaningful” which is a list that set of stopwords is eliminated.
3.1.4. Word Stemming
Figure 2. Stopwords.
In the process of word stemming, we found the problem that there were words “wa, hi, thi, and ha” after word-stemming, and we could not understand the meaning. To reduce the problem, we changed the plan to have a process of word lemmatization.
3.1.5. Word Lemmatization
We needed to change words into basic form because it is hard to categorize the words as one section if they are in different forms. For example, the word “says” becomes “say”, so we can count them as the same word. There are two ways to do this in python 3: stemming and lemmatization. They both can change words into basic forms, but lemmatization uses a more detailed and slower algorithm than stemming. WordNetLemmatizer () imported from the nltk library was used to solve this problem which occurs when stemming was used. As shown in lines 14 to 16 of figure 1, D [“meaningful”], which contains a string of preprocessed data is lemmatized by using lemmatize (word, pos=’v’) and stored in lemmatized_list as shown below.
3.1.6. Joining Words Together as Text
Since words were separated with Tokenizer, the words are saved as individual strings. Merging those words to make it as a paragraph form of text, this process used function join () as shown in line 19 and 20 of figure 1. After this process, strings of preprocessed data are stored in the new column “body”.
3.1.7. Removing Proper Nouns
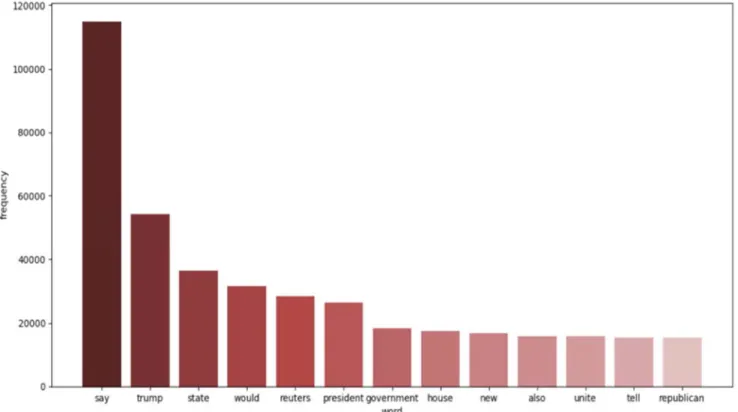
Figure 3. Histogram of word frequence (up: true news, down: fake news).
3.2. Finding the Word Frequency
As we mentioned, word frequency of data was calculated in both fake and true news. CountVectorizer () from a scikit-learn library was used to count each number of words in the sentence and create vectors of them. Since we generated preprocessed data in “body” in string form, the column “body” was used in CountVectorizer () to split words as shown below.
3.3. Graphs
We made a visual form of the data to display the information in a more digestible form. Histograms and word clouds were made using the import from the python library.
3.3.1. Creating the Histogram Function
The data, which was in ‘string’ form, was converted into a dictionary using the function ‘eval.’ Then from that dictionary, we used the function ‘take’ to create another list. To make a histogram, we had to extract certain data from the data pool. Compared to the original dictionary, the new list contained a specific amount of data. The list was then converted to a dictionary again. Then the data was input into the histogram generator function created previously. The histogram generator was defined using the function ‘plt. bar.’ We modified the figure size, x and y labels, title, and bar colors. Then the figure was saved and named accordingly as input.
3.3.2. Generating Word Cloud
Importing the processed data, first, the data was changed into a ‘dictionary’ form as it was originally saved as ‘string’. We used the function WordCloud to make a visual
representation of the data. In the function defined as followed, one can input the text source, output file name, background color, and the number of words. After creating a word cloud using the WordCloud function, the plot generated was outputted to a separate image file.
4. Result & Evaluation
4.1. Histogram & Word Cloud
Figure 3 is a histogram that shows the word frequency in each true and fake news. In true news, some words were used many times. For example: say, trump, state, would, president, reuters. However, the word reuters was disregarded because it is the name of a published website which only appears in true news data. The word say was used 114973 times, Trump-54299 times, state-36493, would-31526, and president-26397. On the other hand, in fake news, trump, say, people, president, go, and state were used many times in order. The word trump was used 74423, say-51789, people-26098, president-25772, go-23908, and
state-23822. Both types of news used the word Trump
people can be used with some to indicate nonspecific groups. Meanwhile, true news uses more professional and specific words of experts instead of general people to deliver fact-based information. Figure 4 visualizes word frequency of true and fake news in word cloud
Figure 4. Word cloud (up: fake news, down: true news).
4.2. TF-iDF
Using TF-iDF (previously mentioned under methodology), we came to the conclusion that the top 10 words that are frequently used as well as hold a certain importance in fake news is: also, go, house, make, new, one, people, state, take, tell. Articles and posts containing and frequently using these words have a higher chance of being fake news.
4.3. Machine Learning Algorithms Test
We generated classification reports in 4 different supervised machine learning algorithms: Logistic regression, Naive Bayes, SVM, and Decision Tree. We splitted data randomly into training and testing data in a ratio of 7:3. Training data was trained for machine learning algorithms and the accuracy was calculated with testing data. In logistic regression, the result shows the accuracy of 94%. The classification report of Naive Bayes algorithm indicates the accuracy of 94%.
Another method that we used was the decision tree. The decision tree had an accuracy of 99.57%. This is significantly more accurate than that of Logistic Regression and Naive Bayes, however it also took a slightly longer time to process.
The last method that we attempted was SVM (Support Vector Machine). This had an accuracy of 99.53% which is lower than Decision tree, but higher than Logistic Regression and Naive Bayes. Although this is slightly less accurate than
Decision Tree, it took a longer time to compile, therefore it is inferior to Decision Tree.
5. Conclusion
Fake news is a critical social issue that should be distinguished by new-readers as we discussed. As such, in this research project, we used Python, text mining, and machine learning algorithms to determine which news article is delivering fake news. Trained machine learning algorithms showed high accuracy of distinguishing which indicates our research was successful.
6. Discussion
However, in this paper, we used the limited number of datasets. Furthermore, we only used the political content of news to progress the project. For the next step, we will try to collect a broader range of news to distinguish two articles whether it is fake or true news.
References
[1] Newspapers Statistics-Worldometer. (n.d.). Retrieved June 20, 2020, from https://www.worldometers.info/newspapers/.
[2] How News Has Changed-News-Macalester College. (n.d.).
Retrieved June 20, 2020, from
https://www.macalester.edu/news/2017/04/how-news-has-changed/.
[3] What Is Digital Media? All You Need to Know About New Media. (n.d.). Retrieved June 20, 2020, from https://online.maryville.edu/blog/what-is-digital-media/.
[4] Pew Research: People prefer social media over print newspapers for news consumption-TechSpot. (n.d.). Retrieved June 20, 2020, from https://www.techspot.com/news/77816-pew-research-people-prefer-social-media-over-print.html.
[5] Nguyen, A. (2010). Harnessing the potential of online news: Suggestions from a study on the relationship between online news advantages and its post-adoption consequences.
Journalism: Theory, Practice & Criticism, 11 (2), 223-241. https://doi.org/10.1177/1464884909355910.
[6] Why do people read online news? (Research summary) | Online Journalism Blog. (n.d.). Retrieved June 20, 2020, from https://onlinejournalismblog.com/2010/04/27/why-do-people-read-online-news-research-summary/.
[7] How Social Media Has Changed How We Consume News. (n.d.). Retrieved June 20, 2020, from https://www.forbes.com/sites/nicolemartin1/2018/11/30/how-
social-media-has-changed-how-we-consume-news/#3eea114f3c3c.
[8] Hopkins, J. (n.d.). Research Guides: Fake News: Develop Your Fact-Checking Skills: What Kinds of Fake News Exist?
[9] Types of ’Fake News’ and Why They Matter | Ogilvy. (n.d.).
Retrieved June 20, 2020, from
[10] Engle, M. (n.d.). LibGuides: Fake News, Propaganda, and Bad information: Learning to Critically Evaluate Media Sources.: What Is Fake News?
[11] Types of online news content accessed worldwide 2016 | Statista. (n.d.). Retrieved June 20, 2020, from https://www.statista.com/statistics/262510/types-of-online-news-content-accessed-worldwide/.
[12] Fake news and critical literacy resources | National Literacy Trust. (n.d.). Retrieved June 20, 2020, from https://literacytrust.org.uk/resources/fake-news-and-critical-literacy-resources/.
[13] Fake News & Social Media EuropCom 2017-Media Literacy Workshop. Retrieved November, 2017, from https://cor.europa.eu/en/events/Documents/Europcom/I.%20H eijnen_Session%2014.pdf.
[14] Logistic Regression-Detailed Overview-Towards Data Science. (n.d.). Retrieved July 4, 2020, from https://towardsdatascience.com/logistic-regression-detailed-overview-46c4da4303bc.
[15] KNN Classification. (n.d.). Retrieved July 4, 2020, from https://www.saedsayad.com/k_nearest_neighbors.htm.
[16] Support Vector Machine-Introduction to Machine Learning Algorithms. (n.d.). Retrieved July 4, 2020, from https://towardsdatascience.com/support-vector-machine-introduction-to-machine-learning-algorithms-934a444fca47.
[17] Decision Tree Algorithm-Explained-Towards Data Science. (n.d.). Retrieved July 4, 2020, from https://towardsdatascience.com/decision-tree-algorithm-explained-83beb6e78ef4.