Structural Performance of 3-D Sandwich
Panels Under Shear and Flexural Loading
M.Z. Kabir 1
3-D wall panels are used in the construction of exterior and interior bearing and non-load bearing walls and oors in all types of construction. The present paper investigates the mechanical characteristics of 3D wall panels under static shear and bending loads, in order to better understand their structural components. The numerical model is loaded in increments to simulate the tests and to allow detection of failure in exural tests for vertical and horizontal bearing panels and also for direct shear. The load-displacement curves, resulting from nite element analysis, are very similar to those tested specimens. Maximum loads in exural tests, both for wall and oor panels, are equal to the experimental ultimate loads. The failure mechanism is started, after moving from the elastic zone at the load stage of 700 kg, by tension failure in the lower wythe of the concrete. Then, the crack propagates to the upper layer, at the level of 1200 kg load. The bottom mesh is yielded and, nally, the crushing of concrete causes the instability of the system. The maximum load is reported as 2200 kg. In direct shear analysis, the panel behaves as a cantilever deep beam.
INTRODUCTION
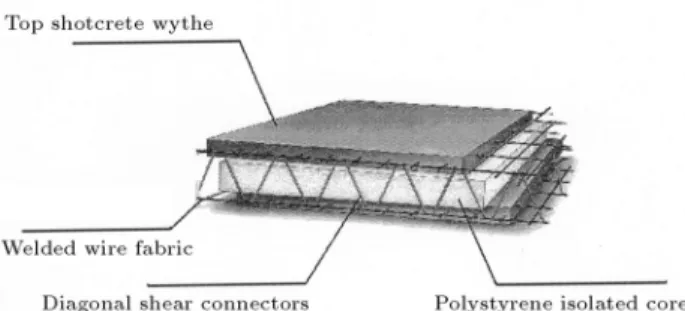
3-D wall panels are used in the construction of exterior and interior bearing and non-load bearing walls and oors in all types of construction. This system con-sists of a welded wire space frame integrated with a polystyrene insulation core. The wall panel is placed in position and wythes of concrete are applied to both sides. The wall panel receives its strength and rigidity from the diagonal cross wires welded to the welded-wire fabric on each side. This combination creates a truss behavior, which provides rigidity and shear terms for full composite behavior. Figure 1 shows, schematically, the 3-D panel.
Salmon et al. 1] presents the results of a full scale test of prototype sandwich panels under transverse loading in a vertical position. Nighawan 2] measured, experimentally, the interface shear force and designed the shear connectors. Eiena et al. 3] used plastic composite diagonal elements in sandwich panels as shear connectors for increasing the thermal insulation of this system. The current work studies, numerically and experimentally, the mechanical behavior of 3-D sandwich panels in order to observe the transfer-ring load throughout sandwich elements, the fracture
1. Department of Civil Engineering, Amir Kabir University of Technology, Tehran, I.R. Iran.
Figure1. 3-D sandwich panel.
mechanism of concrete wythes and the adequacy of steel bar design, based on ACI 318-95 4] and the procedures in the PCI design handbook 5]. Bush and Wu 6], in a recent work, studied a closed form elastic continuum approach for discrete truss connectors to estimate service load, deection and bending stresses of semi-composite sandwich panels.
FINITE ELEMENT ANALYSIS
The numerical model consists of two types of element: Non-linear, 8-node solid elements for the concrete portion and a beam element for the welded wire space frame, including bent bar connectors and wythe steel reinforcement. The appropriate concrete element for this purpose, in ANSYS software, is solid 65. This element is used for the three-dimensional modeling of
solids with or without reinforcing bars. The solid is capable of cracking under tension and crushing under compression. The element is dened by eight nodes having three degrees of freedom at each node translation in the nodal x, y and z directions. The
most important aspect of this element is the treatment of non-linear material properties, e.g., cracking in the three orthogonal directions, crushing, plastic deforma-tion and creep. The rebar are capable of tension and compression, but not shear (Figure 2).
Beam 23 is a uni-axial element with tension-compression and bending capabilities. The element has three degrees of freedom at each node: translational in the nodal x and y directions and rotation about
the nodal z-axis. The element has plastic creep and
swelling capabilities (Figure 3).
Horizontal Bending Load
Figure 4a is of the oor sandwich panels for a bending load. The length of the panels, according to ASTM, is chosen as 3000 mm. The horizontal view of the panel is depicted in Figure 4b.
The diagonal connectors are 2.5 mm in diameter and are placed 160 mm apart in a transverse direction
Figure2. Nodes, coordinates and geometry of solid elements.
Figure3. Nodes, coordinates and geometry of link element.
Figure 4. Geometry of 3-D panel under bending.
to the panel. The thickness of the upper shotcreted wythe is 60 mm for oor slabs and 40 mm for walls. The lower concrete thickness is 40 mm and the slab width is 1000 mm. Due to time saving in analysis, only 100 mm is taken for numerical modeling.
Based on compression tests of concrete cores, the mean value for compressive strength is taken as 12 MPa and the tensile strength is 1.2 MPa. The minimum diameter of provided cores from shotcrete should not be less than 60 mm with aspect ratio being at least one.
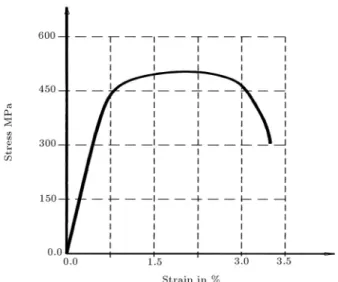
It was mentioned earlier that each panel consists of a two-wire mesh at each side and diagonal elements, in order to make a full composite section. Applying a cold rolling technique and annealing process to the 6 mm original wire, the nal product is 3.5 mm of steel wire. The stress-strain curve of the nal product is depicted in Figure 5.
In this study, the boundary condition is assumed as simply supported and the applied constraint is shown in Figure 6. Also, based on ASTM E72 as test methodology, the same geometry and applied loads are used.
NUMERICAL RESULTS
Figure 7 represents the non-linear behavior of the load versus the deection of mid-span for a horizontal panel
Figure 5. Stress and strain curve of upper and lower mesh.
Figure6. Geometry and applied boundary condition assumed for panel.
Figure7. Load deection curves for horizontal slab bending test.
(slab) with the total thickness being about 16 mm under bending. It is seen that up to 700 kg the load is proportional with vertical displacement. At this stage of the load, primary tensile cracks appear at the lowest bre of the bottom concrete. This phenomenon makes a considerable reduction in structural rigidity and the tensile stress is redistributed to the bottom steel rebar. This may cause longitudinal sliding of two wythes of concrete, with respect to each other.
In numerical analysis, using the arc-length method, as can be activated in ANSYS, one can overcome the trace load-deection path at the instant of this point. By increasing the applied loads, the developed cracks propagate in a vertical direction and, at the stage of 1200 kg of load, the lower concrete portion is subjected to tensile stresses. This greatly aects the load-deection path slope. Finally, at the load stage of 2200 kg, the tensile steel yields completely, the section becomes unstable and the total slab will collapse. The load deection curve calculated by numerical analysis is sketched in Figure 7 with those results found from experimental horizontal exural loading, which are explained in the following section.
EXPERIMENTAL VERIFICATION
To verify the numerical evaluation, a series of labo-ratory tests for exural and direct shear loading are
carried out based on ASTM E-72 and ASTM 564, respectively. There are six 3-D specimens for horizontal and vertical slabs under exural load and 3 specimens for direct shear test are provided. The thickness of each concrete wythe is about 5 cm.
In exural tests, each sandwich panel is 300 cm long and 100 cm wide. For a horizontal bending test (slab), the upper and lower concrete wythes are 6 and 4 cm thick, respectively, while, in a vertical position (wall), each concrete wythe is 5 cm. The reinforcement of each wythe consists of 3.5 mm by 2.5 mm welded wire mesh, which is created in a pre-tensioned and annealing process of 6 mm plain reinforcement made by Isfahan steel production. The shear connector plain wires of 2.5 mm diameter are placed 8 cm apart in a longitudinal direction and 16 cm in a transverse direction.
Bending Tests
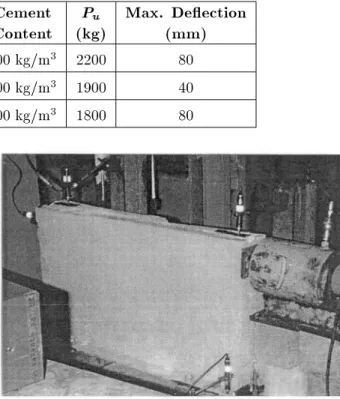
Testing of the panel specimens is performed in a hor-izontal position using a test frame shown in Figure 8. Load is applied to the specimens by an oil jack with 300 kN capacities in a vertical position, according to ASTM: E72 test methodology. The displacement of the specimen is monitored using an LVDT (Linear Variant Dierential Transformer) located at mid-height of the specimen. The applied load is monitored using a pressure cell mounted on the lateral load side of the panel surface. The test procedure is as follows: 1. Lift the specimen using four lifting points and move
it to the test site
2. Place the specimen in the testing frame. Shim the specimen to provide snug contact with reaction points
3. Apply the load to the next increment by hydraulic oil pressure and displacement at the appropriate stage
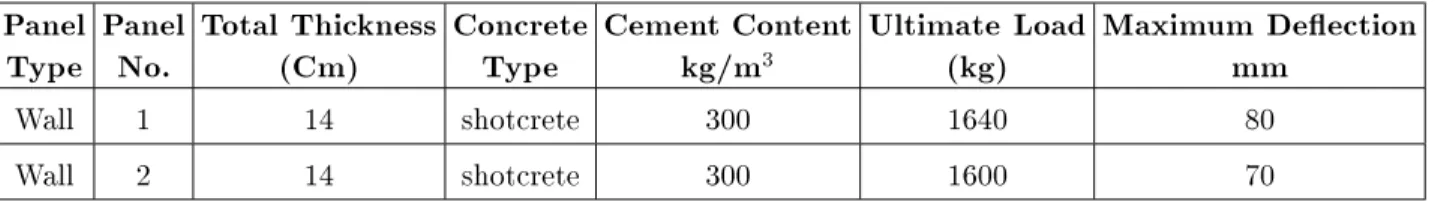
Table1. Experimental results of lateral bending tests.
Panel
Type
Panel
No.
Total Thickness
(Cm)
Concrete
Type
Cement Content
kg/m
3Ultimate Load
(kg)
Maximum Deection
mm
Wall 1 14 shotcrete 300 1640 80
Wall 2 14 shotcrete 300 1600 70
4. After reaching a maximum mid span deection and its corresponding load for each specimen, the load is slowly dropped until development of a complete fracture occurs, in order to inspect the connectors inside the specimen. The results for the lateral bending tests of 3 specimens are listed in Table 1. The third specimen failed at the early stages of loading due to an unbalancing of applied vertical load, so the results are not shown.
Figure 9 shows the load deection curves for wall 1 and 2. In this gure, the theoretical extremes of fully composite and non-composite are shown, as well as the numerical prediction of the load-deection relationship. It can be seen that due to experimental factors, e.g., shotcrete porosity, initial deection of connectors and wire mesh, the initial stiness of wall 1 and 2 are lower than that predicted by FEM analysis. To explain the behavior of panel components during exural loading, a gradual loss of stiness is shown by increasing the load after an early stage of the linear path. This loss of stiness has three primary causes:
1. Cracking of the concrete in the tension wythe results in a redistribution of the panel forces and an increase in the axial stresses in each wythe This stage happens at 700 kg of applied load
2. Cracking of the polystyrene, in the connector em-bedded region, decreases the connector stiness and results in a loss of shear stiness in the connecting layer. The insulation has only a low
Figure9. Comparison of numerical results with experiment.
shear stiness but the contact area is initially large enough to cause a remarkable contribution to the shear stiness of the panel
3. Failure of shear connectors, which are in com-pression, may occur as buckling mode. This phenomenon dramatically decreases the exural stiness of the panel. The upper concrete wythe provides the bending strength and, nally, by increasing the load, at the ultimate stage of 1400 kg, the panel collapses by the crushing of the upper layer. Figure 9 shows good correlation between FEM analysis and experimental laboratory results. The same procedure is applied for the horizon-tal exural test (SLAB test), based on ASTM E72 (Figure 10). The upper concrete is 6 cm thick in slabs, thus, the total thickness of slabs becomes 16 cm. Three specimens are provided for horizontal bending tests. The rest of the procedure is as mentioned in the previous section. The loading points on the specimens are placed at L/4 and 3L/4 of the slab span.
Three deect meters with an accuracy of 0.025 mm are used in order to measure the dis-placement at the center, L/4 and 3L/4, of the span. Table 2 shows the ultimate loads and their correspond-ing displacement of slabs for the horizontal exural test.
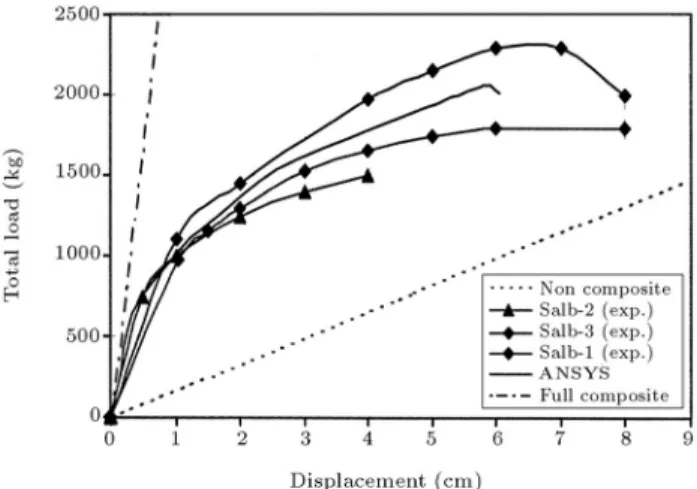
Figure 7 also represents the comparison of the numerical prediction of the load-deection relationship with those found in the test results (slab 1, 2 and 3) and two extremes of fully and non-composites curves,
Table 2. Experimental results for horizontal bending test.
Specimen Thickness
(Cm)
Shotcrete
Type of
Content
Cement
P u(kg)
Max. Deection
(mm)
Slab-1 16 Manual 300 kg/m3 2200 80
Slab-2 16 Manual 300 kg/m3 1900 40
Slab-3 16 Manual 300 kg/m3 1800 80
as the upper and lower limits of bending strength. It is clear that some deciency parameters, such as quality of concrete, which is sprayed by a manual shotcrete system and the quality of welded wire mesh, makes the loss of the initial stiness. However, it can be observed that, overall, the load-deection path is inclined to act fully composite at the stage of the service load.
Direct Shear Loading
To examine the shear strength of wall panels, nu-merical and experimental studies of 550 mm height and 1000 mm length of wall panel under direct shear are carried out. The thickness of the concrete and polystyrene are the same as the wall panel. Figure 11 shows the numerical model and Figure 12 represents the laboratory setting of the specimen. In direct shear analysis, four regions are feasible. In the elastic zone, the load is proportional to displacement of up to 6000 kg. The panel behaves as a cantilever deep beam. By increasing the load at the tension side, the rst cracks appear. When the load approaches 7000 kg, the crack patterns are clearly visible and the slope of the load-displacement curve reduces it to half of the original value. The hardening mechanism arrives at this stage by activating the reinforcement strength to up to 11000 kg of load stage. By increasing the crack size, the whole panel is failed, where the ultimate load is 12000 kg. The produced pattern cracks are perpendicular to the normal principal stresses at the
Figure11. Numerical model for direct shear loading.
Figure12. Shear test setup in structural lab.
nal stage of failure, which are shown in Figure 13. It is seen that the crack length reaches even to the size of the element and the panel becomes unstable. Due to the sliding of the top portion onto the bottom side, the collapse will occur.
INTERLAMINAR SHEAR LOADING
The space truss system needs to be evaluated, in terms of inter-laminar required members. Shear connectors behave mostly as truss members. The stress-strain curve is modeled for tension and compression in two dierent manners. In tension, Figure 5 is used and, for compression, the buckling stress limits the lower
bound level. In numerical modeling for diagonal members, the elements are dened by tension and compression, the only characteristics for this purpose. Figure 14 shows the double panels test sample un-der vertical loading. The dimension of the panel is 100*100 cm and the load is applied on a central concrete wythe.
Figure 15 shows applied vertical load versus nor-mal tensile stress in three truss elements. The number of shear connectors in square meter units is about 78. It can be seen that, due to the surrounding support of diagonal members by a polystyrene environment, the curve is somehow non-linear.
The load-deection curve is plotted in Figure 16. The large displacement of inter-laminar shear deforma-tion is related to the yielding of tensile elements and buckling of those connectors in compression.
Figure 17 represents the deformation in shear connectors after ultimate load. The polystyrene is dissolved by gasoline in order to show the failure mechanism. The buckled shape of some truss members is clearly visualized.
Figure14. Inter-laminar shear test set up.
Figure15. Axial load versus tensile stress in diagonal truss elements.
Figure 16. The applied load deection curve in inter-laminar shear loading.
Figure 17. Buckling of diagonal members in inter-laminar shear test.
PARAMETRIC STUDIES
In shotcrete lightweight panels, the strength and rigid-ity are owing to the diagonal cross wires of shear connectors. The diameter geometry of such members would show remarkable integrity in structural behav-iors. Three sizes of shear connector diameter are chosen to compare their inuences on the rigidity of the section. Figure 18 compares 2.5, 3.5 and 4 mm of diagonal members in the exural behavior of horizontal slabs.
CONCLUSIONS
The current paper demonstrates the structural prop-erties of precast concrete sandwich panels under shear and bending loads. The load deection behavior shows that these panels carry the load as partially composite panels under service loads.
In the linear elastic zone, the stresses and strength of each panel can be computed by linear elastic struc-tural analysis and the ACI code could be applied. For
Figure18. Inuence of shear connectors diameter on exural loading capacity of panels.
the non-linear portion, the section behaves as a precise, partially composite section and the analysis should be performed based on strain distribution. In shear analysis, the panel behaves as a deep beam and the failure mechanism is based on shear sliding.
ACKNOWLEDGMENT
The Prefabricated Sandwich Panel Company (SAP) in
Tehran has funded the work presented in this paper. The author appreciates the nancial support provided by the sponsor.
REFERENCES
1. Salmon, D.C., Eiena, A., Tadros. M.K. and Culp, T.D. \Full scale testing of precast concrete sandwich panels",ACI Journal,94, pp 354-362 (1997)
2. Nijhawan, J.C. \Insulated wall panels interface shear transfer",PCI Journal, pp 98-101 (1998).
3. Eiena, A., Tadros, M.K., Salmon, D.C. and Culp, T.D. \A new structurally and thermally ecient sandwich panel system",PCI Journal,39(4), pp 90-101 (1994). 4. American Concrete Institute \Building code require-ments for reinforced concrete", ACI Journal, pp 318-95, Detroit (1995).
5. Precast/Prestressed Concrete Institute, PCI Design Handbook-Precast and Prestressed Concrete, 3rd Ed., Chicago, USA (1985).
6. Bush, T.D. and Wu, Z. \Flexural analysis of pre-stressed concrete sandwich panels with truss con-nectors",PCI Journal, September-October, pp 76-86 (1998).