R E S E A R C H
Open Access
Imaging-based clusters in current smokers
of the COPD cohort associate with clinical
characteristics: the SubPopulations and
Intermediate Outcome Measures in COPD
Study (SPIROMICS)
Babak Haghighi
1,2, Sanghun Choi
3, Jiwoong Choi
1,2, Eric A. Hoffman
4, Alejandro P. Comellas
4, John D. Newell Jr
4,
R. Graham Barr
5, Eugene Bleecker
6, Christopher B. Cooper
7, David Couper
8, Mei Lan Han
9, Nadia N. Hansel
10,
Richard E. Kanner
11, Ella A. Kazerooni
12, Eric A. C. Kleerup
13, Fernando J. Martinez
14, Wanda O
’
Neal
15,
Stephen I. Rennard
16, Prescott G. Woodruff
17and Ching-Long Lin
1,2*Abstract
Background:Classification of COPD is usually based on the severity of airflow, which may not sensitively differentiate subpopulations. Using a multiscale imaging-based cluster analysis (MICA), we aim to identify subpopulations for current smokers with COPD.
Methods:Among the SPIROMICS subjects, we analyzed computed tomography images at total lung capacity (TLC)
and residual volume (RV) of 284 current smokers. Functional variables were derived from registration of TLC and RV images, e.g. functional small airways disease (fSAD%). Structural variables were assessed at TLC images, e.g. emphysema and airway wall thickness and diameter. We employed an unsupervised method for clustering.
Results:Four clusters were identified. Cluster 1 had relatively normal airway structures; Cluster 2 had an increase of fSAD% and wall thickness; Cluster 3 exhibited a further increase of fSAD% but a decrease of wall thickness and airway diameter; Cluster 4 had a significant increase of fSAD% and emphysema. Clinically, Cluster 1 showed normal FEV1/FVC and low exacerbations. Cluster 4 showed relatively low FEV1/FVC and high exacerbations. While Cluster 2 and Cluster 3 showed similar exacerbations, Cluster 2 had the highest BMI among all clusters.
Conclusions:Association of imaging-based clusters with existing clinical metrics suggests the sensitivity of MICA in differentiating subpopulations.
Keywords:COPD, Current smokers, Emphysema, Functional small airway disease, Imaging-based cluster analysis
* Correspondence:[email protected]
1Department of Mechanical and Industrial Engineering, University of Iowa,
2406 Seamans Center for the Engineering Art and Science, Iowa City, Iowa 52242, USA
2IIHR-Hydroscience & Engineering, University of Iowa, 2406 Seamans Center
for the Engineering Art and Science, Iowa City, Iowa 52242, USA Full list of author information is available at the end of the article
Background
Chronic obstructive pulmonary disease (COPD) is cur-rently the third leading cause of death in the United States [1]. COPD is characterized by airflow limitation that is incompletely reversible [2], and thus it is identi-fied by the ratio of forced expiratory volume in 1 s over forced vital capacity (FEV1/FVC) at post bronchodilator. The severity is further distinguished by FEV1% predicted values by COPD guidelines [3]. The ratio of FEV1/FVC is used as an indicator to identify COPD patients in diagnosis of the disease [3], but it may not be sensitive enough to differentiate heterogeneous alterations charac-terized by multiple pathologies [4]. In contrast, quantita-tive computed tomography (QCT) can distinguish emphysema-predominant and airway-predominant dis-eases [5] and help link structural and functional vari-ables [6,7]. Individual imaging-based metrics have been derived from both CT and MRI studies of the lungs in both COPD and asthma [8]. With recent advances in unsupervised clustering of subject populations [9–11], there is an increased effort to employ these methods for grouping sub-populations of subjects within both the asthma [12] and COPD communities [13–17].
With the introduction of novel structural and functional imaging-based metrics [6] and corrections for inter-site and inter-subject variabilities [18], Choi et al. [7] recently inte-grated all of the imaging-based metrics measured at multi-scales to derive imaging-based clusters of subjects from an asthma population. These clusters were signifi-cantly associated with clinical characteristics. In the present work, we utilize the same approach, but with an expanded
set of variables that include an image matching-based quantification of emphysema and functional small airways disease to derive imaging-based clusters in a COPD popula-tion with meaningful associapopula-tions to clinical characteristics. For this purpose we investigated a subject population from within the Subpopulations and Intermediate Outcome Measures in COPD Study (SPIROMICS) [19] which was initiated to provide robust criteria for sub-classifying COPD participants and further identify biomarkers and pheno-types for efficient conduct of treatment trials.
Methods
Human data and QCT imaging
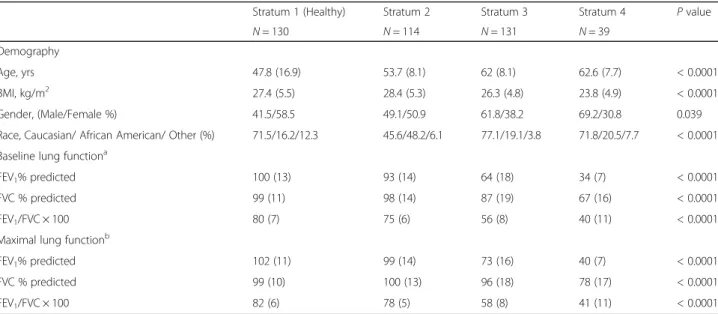
From the first 1000 subjects recruited into SPIROMICS [19] we performed image matching and identified 700 subjects in whom total lung capacity (TLC) to residual volume (RV) matches were successful. From these sub-jects with matching data we chose to study current smokers falling within strata 2–4 [19] (N= 284) as well as healthy non-smokers (N= 130). SPIROMICS categorized subjects into four strata 1–4. The healthy non-smokers (stratum 1) were defined as FEV1/FVC > 0.7 with smoking status (pack-year) < 1. Smokers with (pack-year) > 20 and FEV1/FVC > 0.7 were grouped in stratum 2. Also smokers in strata 3 and 4 had FEV1/FVC < 0.7; those with FEV1 > 50% were grouped in stratum 3 whereas those with FEV1 < 50% were in stratum 4 [19]. The demographics of these populations are summarized in Table 1. The current smokers were employed to derive imaging-based COPD clusters and individual metrics were compared with the non-smoking healthy controls. We initially performed
Table 1Demography, baseline (Pre-bronchodilator) and maximal (Post-bronchodilator) pulmonary function tests for 130 Stratum 1 (healthy), 114 Stratum 2, 131 Stratum 3 and 39 Stratum 4 subjects
Stratum 1 (Healthy) Stratum 2 Stratum 3 Stratum 4 Pvalue
N= 130 N= 114 N= 131 N= 39
Demography
Age, yrs 47.8 (16.9) 53.7 (8.1) 62 (8.1) 62.6 (7.7) < 0.0001
BMI, kg/m2 27.4 (5.5) 28.4 (5.3) 26.3 (4.8) 23.8 (4.9) < 0.0001
Gender, (Male/Female %) 41.5/58.5 49.1/50.9 61.8/38.2 69.2/30.8 0.039
Race, Caucasian/ African American/ Other (%) 71.5/16.2/12.3 45.6/48.2/6.1 77.1/19.1/3.8 71.8/20.5/7.7 < 0.0001
Baseline lung functiona
FEV1% predicted 100 (13) 93 (14) 64 (18) 34 (7) < 0.0001
FVC % predicted 99 (11) 98 (14) 87 (19) 67 (16) < 0.0001
FEV1/FVC × 100 80 (7) 75 (6) 56 (8) 40 (11) < 0.0001
Maximal lung functionb
FEV1% predicted 102 (11) 99 (14) 73 (16) 40 (7) < 0.0001
FVC % predicted 99 (10) 100 (13) 96 (18) 78 (17) < 0.0001
FEV1/FVC × 100 82 (6) 78 (5) 58 (8) 41 (11) < 0.0001
Values expressed as mean (SD) or number (%). Kruskal-Wallis and chi-square tests were performed for continuous and categorical variables.a Baseline (Prebronchodilator) values with greater than six hours withhold of bronchodilators.b
cluster analysis [20] including both former and current smokers, which resulted in less statistically stable clusters based on the Jaccard index [21] (90% and 70% for current and both former and current smokers, respectively). This suggested that smoking status introduced confounding variables, interfering with many metrics such as the em-physema index which is shifted by the effect of inflamma-tion (associated with smoking status) on regional lung density [22].
Multiscale imaging-based variables
Volumetric CT imaging was carried out during coached breath holds at TLC and RV [23], and image analysis was carried out with use of the Apollo software (VIDA Diagnostics, Coralville, Iowa).
Sixty nine post-processed imaging-based variables were employed at both segmental and lobar levels, which is an expanded set of existing 57 variables used for asthma clus-ter analysis [7] utilizing our multiscale imaging-based clustering approach (MICA). The four structural variables at the pre-segmental and segmental levels were extracted from ten local regions to reflect the regional characteris-tics [6]. These structural variables included bifurcation angle (θ), airway circularity (Cr), wall thickness (WT) and hydraulic diameter (Dh), where each variable indicated
alteration of airway geometry, alteration of luminal shape, wall thickening and luminal narrowing, respectively. The dimensions of WT andDh were normalized by predicted
trachea WT and Dh from healthy controls denoted by
WT*andDh*[6]. The normalization was used for
elimin-ating inter-subject variability due to sex age and height. Employing a mass-preserving image registration tech-nique [24,25], lobar/global functional variables were further derived to describe the alterations of lung deformation between inspiration and expiration. The variables at lobar levels included fractional air volume change (ΔVairF), the
determinant of Jacobian matrix (Jacobian) [26] and aniso-tropic deformation index (ADI) [26,27], indicating regional contribution of ventilation (lobar fraction of air volume change between TLC and RV), regional volume change, and the degree of preferential deformation, respect-ively. In this study, we also employed three new vari-ables; fraction-based small airways disease (fSAD%) to characterize small airway, fraction-based emphysema (Emph%) for emphysematous diseases as well as tissue frac-tion at TLC (βtissue). Emph % and fSAD% were defined
based upon a variation of the image-matching-based para-metric response map used by Galban et al. [28]. In our im-plementation, Emph% (98.5% air-fraction as the threshold) and fSAD% (90% air-fraction as the threshold) were used instead of using the density threshold identifying voxels <
−950 HU, to account for scanner variability [18]. βtissue
Fig. 1A scree plot for determining the optimal number of principal components
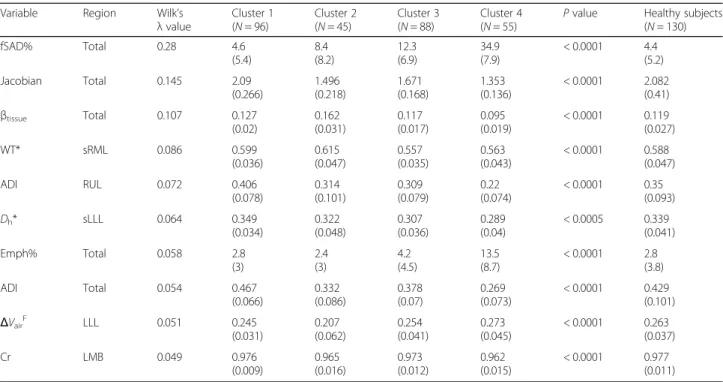
Table 2Major structural and functional imaging-based variables in four imaging-based clusters and heathy subjects
Variable Region Wilk’s
λvalue
Cluster 1 (N= 96)
Cluster 2 (N= 45)
Cluster 3 (N= 88)
Cluster 4
(N= 55) P
value Healthy subjects (N= 130)
fSAD% Total 0.28 4.6
(5.4)
8.4 (8.2)
12.3 (6.9)
34.9 (7.9)
< 0.0001 4.4 (5.2)
Jacobian Total 0.145 2.09
(0.266)
1.496 (0.218)
1.671 (0.168)
1.353 (0.136)
< 0.0001 2.082 (0.41)
βtissue Total 0.107 0.127
(0.02)
0.162 (0.031)
0.117 (0.017)
0.095 (0.019)
< 0.0001 0.119 (0.027)
WT* sRML 0.086 0.599
(0.036)
0.615 (0.047)
0.557 (0.035)
0.563 (0.043)
< 0.0001 0.588 (0.047)
ADI RUL 0.072 0.406
(0.078)
0.314 (0.101)
0.309 (0.079)
0.22 (0.074)
< 0.0001 0.35 (0.093)
Dh* sLLL 0.064 0.349
(0.034)
0.322 (0.048)
0.307 (0.036)
0.289 (0.04)
< 0.0005 0.339 (0.041)
Emph% Total 0.058 2.8
(3)
2.4 (3)
4.2 (4.5)
13.5 (8.7)
< 0.0001 2.8 (3.8)
ADI Total 0.054 0.467
(0.066)
0.332 (0.086)
0.378 (0.07)
0.269 (0.073)
< 0.0001 0.429 (0.101)
ΔVairF LLL 0.051 0.245
(0.031)
0.207 (0.062)
0.254 (0.041)
0.273 (0.045)
< 0.0001 0.263 (0.037)
Cr LMB 0.049 0.976
(0.009)
0.965 (0.016)
0.973 (0.012)
0.962 (0.015)
< 0.0001 0.977 (0.011)
Values expressed as mean (SD). The major imaging-based variables were selected by Wilk’sλvalue of a stepwise forward variable selection method. Analysis of variance (ANOVA) tests were performed to attainPvalues. WT and Dhwere normalized with their predicted trachea values from healthy controls denoted by WT* and Dh*. Full names of each variable or region were described inAbbreviations used
indicates the portion of tissue volume in each voxel to as-sess a possible alteration of local tissue. Also, related global (whole lung) variables were included; fSAD% (Total) and Emph% (Total), apical-basal distance over ventral-dorsal distance at TLC (lung shape), the ratio of air-volume changes in upper lobes to those in middle and lower lobes between TLC and RV (U/(M + L)|v), Jacobian (Total) and ADI (Total) [26]. Therefore, we obtained 32 local structural as well as 30 lobar and 7 global variables, giving 69 imaging-based variables. These comprehen-sive imaging variables were then used for a cluster analysis. Full names of each variable are described in
Abbreviations used section.
Clustering and statistical analysis
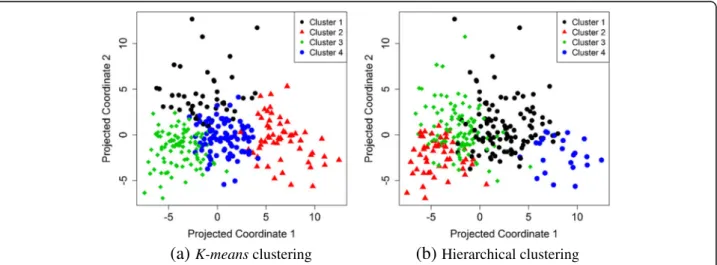
We compared three general clustering methods including
K-means, Hierarchical [29] and Gaussian finite mixture
model-based [30] fed by principal components [31, 32]. Three methods (Kaiser/Harris, Cattel Scree Test and Paral-lel Analysis [33]) were performed to retain an optimal num-ber of principal components (Fig.1). Internal properties of clusters (Connectivity, Dunn index and Silhouette indices) were used in order to find the best clustering method. The
K-means clustering method showed more stability and an
optimal number of clusters fitted for the structure of the imaging data (Additional file 1). The results of clustering
for K-means and hierarchical are shown in Fig.2. K-means clustering with could achieve more clear separation of the cluster membership compared to hierarchical clustering.
Next, we performed association tests of imaging-based clusters with demographic and clinical variables to investi-gate the clinical relevance of current clusters. The data analysis was performed by R software (version 3.1.1). Kruskal-Wallis and chi-square tests were performed to compare differences of continuous and categorical vari-ables, respectively. P= 0.05 was taken as the significant level in all tests. The validation of the cluster analysis was assessed by dividing the data set into training and valid-ation sets (see the Additional file1).
Results
Four clusters and imaging-based characteristics
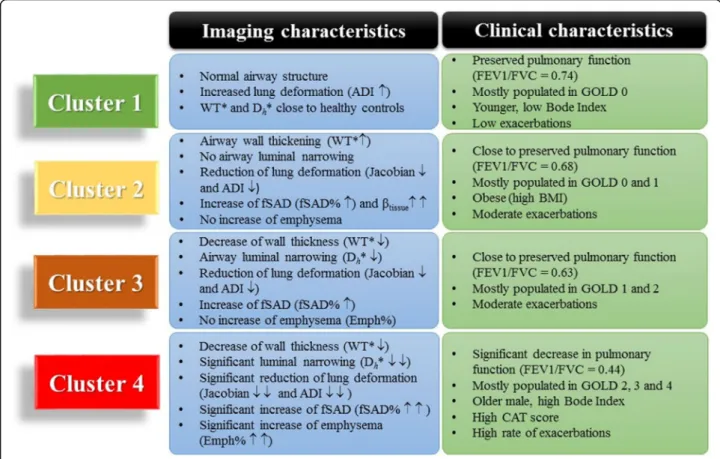
The K-means clustering method produced four unique clusters, containing 96, 45, 88 and 55 subjects respectively (Table 2). Figure 3 shows the percentages of emphysema and small airway disease (Emph% and fSAD%) for the dif-ferent clusters and the healthy group. Figure4summarizes the imaging-based characteristics of the four clusters. The major variables which best describe the four clusters were selected with a stepwise forward variable selection tech-nique using Wilk’s λ criterion [34]. Ten major variables with higher Wilk’s λ values are presented to explain
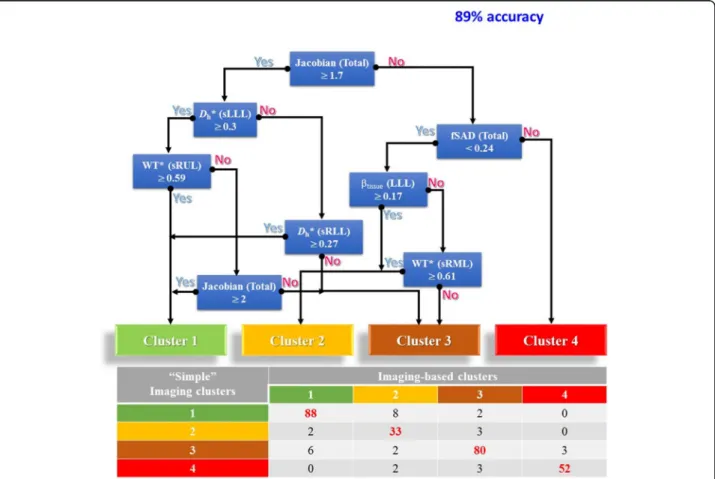
structural and functional alterations associated with each cluster (Table2). We then performed a decision tree ana-lysis to construct a simple predictive model (Fig.5). The model comprising 7 discriminant variables achieved 89% accuracy in classification. These variables were Jacobian (Total), Dh* (sLLL), Dh* (sRLL), WT* (sRUL), WT*
(sRML),βtissue(LLL) and fSAD% (Total).
Associations with demography and PFT
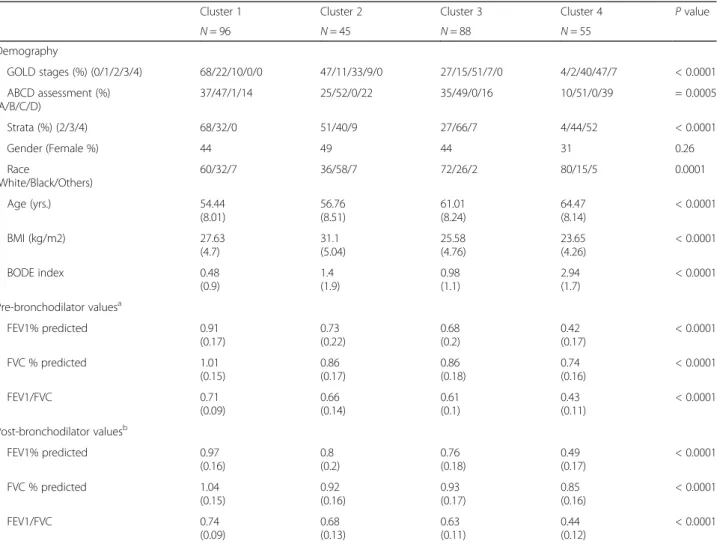
Association of clusters with demography and PFTs are tabulated in Table3. Cluster 1 with normal airway struc-tures was mostly populated by GOLD 0 and stratum 2 subjects who were relatively younger and presented with a lower BODE index compared to other clusters (P< 0.05). Unlike Cluster 1, Cluster 4 was mostly populated by GOLD 2, 3, 4 and strata 3, 4, respectively with relatively older subjects. Cluster 1 included most subjects from group A and B from ABCD assessment while subjects in Cluster 4 shifted towards group D. Cluster 2 was associ-ated with relatively higher BMI subjects. Also Cluster 3 was associated with subjects who exhibited a relatively low BODE index. Cluster 4 subjects showed higher BODE index and were relatively older males.
Both pre-bronchodilator and post-bronchodilation PFT-derived lung function values are tabulated in Table3. FEV1/FVC showed a consistent, decreasing pattern from Cluster 1 to Cluster 4. Subjects in Cluster 4 demonstrated significant decreases in FEV1/FVC both pre-and post-bronchodilation, while Cluster 1 showed a mean FEV1/ FVC of 0.74 that is above the normal cut off value of 0.7. A similar decreasing pattern from Cluster 1 to Cluster 4 was found for FEV1 and FVC % predicted values, with the highest and lowest values associated with Cluster 1 and Cluster 4, respectively.
Associations with symptoms and disease histories
Symptoms and disease histories were collected from the SPIROMICS [19, 23] data set and are summarized in Table 4. Cluster 4 showed a higher history of chronic bronchitis, emphysema, wheezing and whistling compared to Clusters 1, 2, and 3. The prevalence of symptoms in Clusters 1, 2 and 3 was less likely than Cluster 4. Cluster 2 showed an increased history of sleep apnea diagnosed at baseline compared to other clusters. Cluster 4 had higher smoking pack-years at baseline (P< 0.05) compared to the other clusters.
Fig. 5Predicting imaged-based cluster using only 7 important variables with a classification tree (“simple”imaging-based clustering). Variables are Jacobian (Total),Dh* (sLLL),Dh* (sRLL), WT* (sRUL), WT* (sRML),βtissue(LLL) and fSAD% (Total) with 89% accuracy compared with“original”
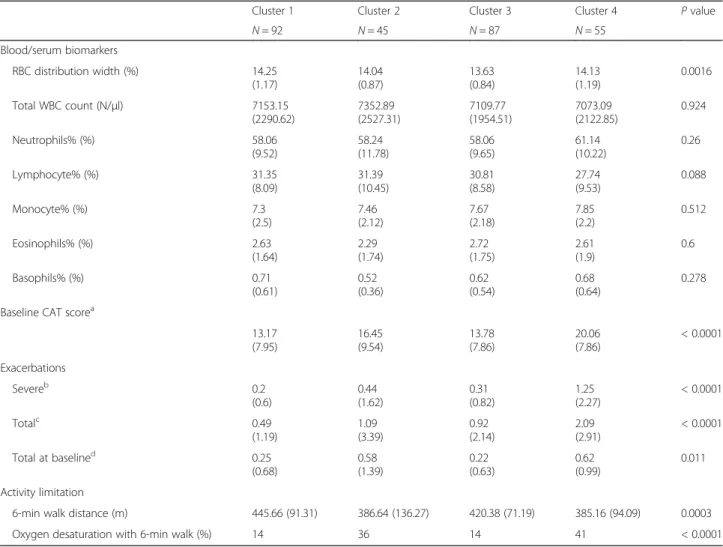
CAT score, activity limitation and exacerbation histories Blood biomarkers, baseline CAT score, exacerbation histor-ies as well as activity limitation (6-min walk) are tabulated in Table 5. While clusters did not show significant differ-ence in blood biomarkers, there was a significant differdiffer-ence for CAT score between clusters (P< 0.05). The CAT score for all clusters were more than 10, suggesting respiratory symptoms (symptomatic) in even the cluster 1 subjects, in agreement with the findings of Woodruff et al. [35]. While Clusters 1, 2 and 3 showed relatively similar CAT scores, Cluster 4 showed a higher CAT score than other clusters. Severe (since entering the study), total (since entering the study), and total (at baseline) exacerbations showed signifi-cant differences between clusters with Cluster 4 having the most severe exacerbations. There was no significant differ-ence in the number of exacerbations between Clusters 1, 2 and 3. Also subjects in Clusters 2 and 4 were more likely to have activity limitations, as their 6-min walk distance and oxygen desaturation were lower than other Clusters.
Cluster characteristics
Cluster 1: Relatively resistant smokers with preserved pulmonary function
Cluster 1 had increased smoking pack-years (41.79 ± 22.05) with no or minimal airway obstruction (FEV1/FVC = 0.74). Cluster 1 was mostly populated by GOLD stage 1 (66%) with low emphysema and low fSAD%. Cluster 1 showed that structural variables including WT*,Dh* and
Cr are very close to those of healthy controls. The CAT score, BODE index and severe exacerbation history of this cluster were relatively low compared to other clusters. Cluster 1 can be considered to be relatively resistant smokers with preserved pulmonary function.
Cluster 2: Airway-wall-thickening fSAD-dominant subjects with obesity and activity limitation
Cluster 2 had increased smoking pack-years (42.89 ± 18.7) and a FEV1/FVC relatively close to the lower limit of normal, 0.7. This cluster had the highest BMI among Table 3Demography, baseline (Pre-bronchodilator) and maximal (Post-bronchodilator) PFTs, in four imaging-based clusters
Cluster 1 Cluster 2 Cluster 3 Cluster 4 Pvalue
N= 96 N= 45 N= 88 N= 55
Demography
GOLD stages (%) (0/1/2/3/4) 68/22/10/0/0 47/11/33/9/0 27/15/51/7/0 4/2/40/47/7 < 0.0001
ABCD assessment (%) (A/B/C/D)
37/47/1/14 25/52/0/22 35/49/0/16 10/51/0/39 = 0.0005
Strata (%) (2/3/4) 68/32/0 51/40/9 27/66/7 4/44/52 < 0.0001
Gender (Female %) 44 49 44 31 0.26
Race
(White/Black/Others)
60/32/7 36/58/7 72/26/2 80/15/5 0.0001
Age (yrs.) 54.44
(8.01) 56.76 (8.51) 61.01 (8.24) 64.47 (8.14) < 0.0001
BMI (kg/m2) 27.63
(4.7) 31.1 (5.04) 25.58 (4.76) 23.65 (4.26) < 0.0001
BODE index 0.48
(0.9) 1.4 (1.9) 0.98 (1.1) 2.94 (1.7) < 0.0001
Pre-bronchodilator valuesa
FEV1% predicted 0.91
(0.17) 0.73 (0.22) 0.68 (0.2) 0.42 (0.17) < 0.0001
FVC % predicted 1.01
(0.15) 0.86 (0.17) 0.86 (0.18) 0.74 (0.16) < 0.0001 FEV1/FVC 0.71 (0.09) 0.66 (0.14) 0.61 (0.1) 0.43 (0.11) < 0.0001
Post-bronchodilator valuesb
FEV1% predicted 0.97
(0.16) 0.8 (0.2) 0.76 (0.18) 0.49 (0.17) < 0.0001
FVC % predicted 1.04
(0.15) 0.92 (0.16) 0.93 (0.17) 0.85 (0.16) < 0.0001 FEV1/FVC 0.74 (0.09) 0.68 (0.13) 0.63 (0.11) 0.44 (0.12) < 0.0001
Data presented as number (%) or mean (SD). ANOVA and chi-square tests were performed for continuous and categorical variables, respectively.a Pre-bronchodilator values.b
all clusters and a higher BODE index than Clusters 1 and 3. Cluster 2 exhibited a decrease of Dh* andCr
com-pared to Cluster 1 and had the highest WT* and βtissue
and the lowest Jacobian among all clusters. Cluster 2 also showed an increase of fSAD%, but with Emph% close to that of Cluster 1. Cluster 2 showed no signifi-cant difference in the number of exacerbations or CAT score. Cluster 2 had decreased 6-min walk distance and oxygen desaturation, similar to Cluster 4 but decreased compared to Cluster 1, (P< 0.05). Thus, Cluster 2 can be classified as thickened airway wall, narrowed airway lumen and fSAD-dominant subjects with associated obesity and activity limitations.
Cluster 3: Airway-wall-thinning fSAD-dominant subjects
Compared to Clusters 1 and 2, Cluster 3 with smoking pack-years (47.06 ± 19.39, P> 0.05) showed a continued increase of fSAD% (P< 0.05) with similar Emph% (P >0.05). Dh* showed significant decrease as compared
with Cluster 1, but not significant difference from that of Cluster 2. Also WT* decreased compared to Clusters 1 and 2 (P< 0.05). FEV1/FVC (=0.63) for Cluster 3 remained close to the normal range with no significant difference for the three categories of exacerbation (se-vere, total and total at baseline) between Clusters 1, 2 and 3. Cluster 3 had 58% of subjects in GOLD stages
2–4 and had a CAT score close to Clusters 1 and 2. While Cluster 3 did not show significant differences in 6-min walk distance or oxygen desaturation com-pared to Cluster 2, its oxygen desaturation decreased comparable to that of Cluster 2 (P< 0.05). Cluster 3 can be categorized as fSAD-dominant subjects with luminal narrowing and decreased wall thickness.
Cluster 4: Severe emphysema-fSAD-mixed subjects with severe airway luminal narrowing and wall thinning
Cluster 4 had significantly greater smoking pack-years (54.95 ± 21.03) compared to other clusters. It had a higher CAT score along with more exacerbations and greater activity limitations compared to the other clus-ters. Cluster 4 also showed significant elevation of em-physema and small airways disease (fSAD%↑↑ and Emph%↑↑), significant decreases in lung deformation (Jacobian↓↓ and ADI↓↓) and significant airway luminal narrowing (Dh*↓↓, P< 0.05) compared to Clusters 1, 2,
and 3. Cluster 4 had significant decreases in airway wall thickness (WT*↓↓,P< 0.05) compared to Clusters 1 and 2. Cluster 4 also had a much lower FEV1/FVC for both baseline function and maximal post-bronchodilator lung function compared to the other Clusters. Cluster 4 had a higher BODE index compared to the other clusters. Lymphocyte% decreased in Cluster 4 and reached near Table 4Associations with Symptoms and Disease Histories
Cluster 1 Cluster 2 Cluster 3 Cluster 4 Pvalue
N= 96 N= 45 N= 88 N= 55
Symptoms and disease History
History of pulmonary/vascular condition (%) 19 13 24 23 0.53
Smoking pack-years at baseline 41.79 (22.05) 42.89 (18.7) 47.06 (19.36) 54.95 (21.03) 0.0016
Chronic Bronchitis (%) 16 20 20 39 0.016
Emphysema (%) 17 20 25 55 < 0.0001
COPD diagnosed at baseline (%) 29 51 58 83 < 0.0001
Chronic bronchitis diagnosed at baseline (%) 21 33 28 41 0.079
Asthma (%) 20 36 22 21 0.19
Wheezing and whistling in chest (%) 60 62 66 89 0.002
Wheezing age (yrs.) (%) 60 86 84 92 0.0003
Sleep Apnea at baseline (%) 6 21 7 6 0.02
Shortness of breath during sleep (%) 18 29 14 29 0.06
Coronary artery disease 2 4 9 6 0.19
Diabetes (%) 6 18 9 9 0.2
Heart attack (%) 3 4 6 2 0.65
Congestive heart failure (%) 3 0 1 0 0.33
Genetic effect
Father had COPD (%) 19 13 23 22 0.61
statistical significance (P= 0.08). Therefore, Cluster 4 sub-jects can be classified as severe mixed emphysema-fSAD with severe luminal narrowing, decreased wall-thickness and lung function.
Discussion
In the present study, we applied MICA [7], which utilized an expanded set of 69 QCT imaging-based variables at both segmental and global scales, to derive four statisti-cally stable clusters in SPIROMICS current smokers with unique structural and functional characteristics, and es-tablish their associations with clinical metrics. Cluster 1 comprised relatively resistant smokers with preserved pul-monary function (FEV1/FVC > 0.7) and respiratory symp-tomatology (CAT> 10). Cluster 2 was characterized by airway wall thickening, fSAD-dominance, obesity and ac-tivity limitation. Cluster 3 exhibited airway wall thinning (in agreement with the findings of Smith et al. [36] and fSAD-dominance. Both Clusters 2 and 3 had FEV1/FVC
close to the lower limit of normal, 0.7. Cluster 4 had mixed emphysema-fSAD with severe airway luminal nar-rowing, wall thinning and decreased lung function.
To better understand the differences between spirometry-based GOLD stages and imaging-based clus-ters, Fig. 6shows the distributions of GOLD 0–4 stages and Clusters 1–4 of the current smokers on a parametric response map (PRM) [28]. Except Cluster 2, Clusters 1, 3 and 4 appear to align with the path of the five GOLD stages. Wan et al. [37] studied a cohort of GOPDGene subjects with post-bronchodilator preserved ratio im-paired spirometry (PRISm), characterized by a reduced FEV1 (< 0.8) with a preserved FEV/FVC ratio (≥0.7). They reported that PRISm subjects exhibit increased BMI, reduced 6-min walk, increased segmental airway wall area percentage, and increased respiratory symp-toms [37], resembling both imaging and clinical charac-teristics of our Cluster 2. Thus, although only ~ 3% of the current smokers in this study met the spirometry Table 5Characteristics of biomarkers in four imaging-based clusters
Cluster 1 Cluster 2 Cluster 3 Cluster 4 Pvalue
N= 92 N= 45 N= 87 N= 55
Blood/serum biomarkers
RBC distribution width (%) 14.25
(1.17) 14.04 (0.87) 13.63 (0.84) 14.13 (1.19) 0.0016
Total WBC count (N/μl) 7153.15
(2290.62) 7352.89 (2527.31) 7109.77 (1954.51) 7073.09 (2122.85) 0.924
Neutrophils% (%) 58.06
(9.52) 58.24 (11.78) 58.06 (9.65) 61.14 (10.22) 0.26
Lymphocyte% (%) 31.35
(8.09) 31.39 (10.45) 30.81 (8.58) 27.74 (9.53) 0.088
Monocyte% (%) 7.3
(2.5) 7.46 (2.12) 7.67 (2.18) 7.85 (2.2) 0.512
Eosinophils% (%) 2.63
(1.64) 2.29 (1.74) 2.72 (1.75) 2.61 (1.9) 0.6
Basophils% (%) 0.71
(0.61) 0.52 (0.36) 0.62 (0.54) 0.68 (0.64) 0.278
Baseline CAT scorea
13.17 (7.95) 16.45 (9.54) 13.78 (7.86) 20.06 (7.86) < 0.0001 Exacerbations
Severeb 0.2
(0.6) 0.44 (1.62) 0.31 (0.82) 1.25 (2.27) < 0.0001
Totalc 0.49
(1.19) 1.09 (3.39) 0.92 (2.14) 2.09 (2.91) < 0.0001
Total at baselined 0.25
(0.68) 0.58 (1.39) 0.22 (0.63) 0.62 (0.99) 0.011 Activity limitation
6-min walk distance (m) 445.66 (91.31) 386.64 (136.27) 420.38 (71.19) 385.16 (94.09) 0.0003
Oxygen desaturation with 6-min walk (%) 14 36 14 41 < 0.0001
Biomarkers data for 5 subjects were not available. Kruskal-Wallis and chi-square tests were performed for continuous and categorical variables, respectively.aCAT score range from 0 to 40, with higher scores indicating greater severity symptoms.b
Total count of exacerbations requiring ED visit or hospitalization since entering the study.c
Total count of exacerbations since entering the study.d
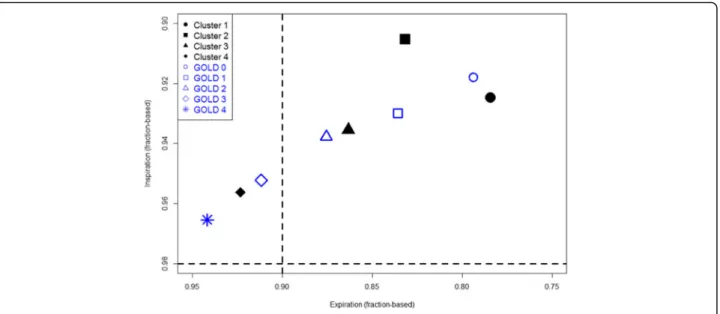
criteria for PRISm, Fig. 7 displays the distributions of GOLD 0–4 stages and Clusters 1–4 of the same subjects on a post-bronchodilator FEV1-FEV1/FVC map. Cluster 2 is located nearest to the PRISm quadrant defined by the above spirometry criteria, as compared to GOLD 1 and 2. While a further study on a large PRISm cohort is needed to establish the link between imaging-based Cluster 2 and PRISm, the above analysis suggests that the current ap-proach may be able to identify a clinically meaningful sub-population with COPD as compared with spirometric classification.
Castaldi et al. [14] classified four clusters in current and former smokers from the COPDGene study using four
variables (features); FEV1% predicted, CT-quantified emphysema, segmental wall area% and emphysema distribution. Their four clusters are: relatively resistant smokers (i.e., no/mild obstruction and minimal em-physema despite heavy smoking), mild upper zone emphysema-predominant, airway disease-predominant and severe emphysema, with Clusters 2 and 4 having strong genetic associations. They included a PFT measure (FEV1% predicted) as one of the input fea-tures for cluster analysis, which is different from our MICA approach employing solely imaging-based vari-ables to identify clusters and then establish associa-tions of derived clusters with PFTs and other clinical
Fig. 6PRM based on GOLD stages and imaging-based derived clusters
measures and symptoms. Their clusters appear to overlap with our clusters. For example, our Cluster 1 (or 4) is similar to their Cluster 1 (or 4). Although our Cluster 2 and 3 had relatively lower FEV1/FVC (but being close to the cut-off threshold of 0.7) than that of Cluster 1, they exhibited a significantly increased fSAD% (P< 0.05) com-pared to Cluster 1 without a significant increase in Emph%. Thus, our Cluster 2, which exhibited increased fSAD%, thicker airway walls, the highest BMI, high BODE index and low Emph%, may correspond to their Cluster 3 being described as airway-predominant disease, thicker airway walls, lowest average emphysema of all clusters and high BMI. In addition, our Cluster 3 showed a relatively higher upper/lower emphysema ratio than others (Table6); being similar to their Cluster 2 characterized by mild upper zone-predominant emphysema. Castaldi et al. [17] further investigated reproducibility of clustering analysis across multiple COPD cohorts using a set of common var-iables, suggesting that COPD heterogeneity may be char-acterized as a continuous trait.
Woodruff et al. [35] divided subjects (including both current and former smokers) from the SPIR-OMCS study into five categories A-E: (A) never smoked, preserved pulmonary function (B) CAT≤10 (asymptotic); (C) CAT ≥10 (symptomatic), mild-to-moderate (GOLD stage 1 or 2); (D) CAT≤10 and (E) CAT≥10. The symp-tomatic subjects with preserved pulmonary function in category C had greater airway-wall thickness, but did not have higher Emph%, as compared with asymptotic subjects. These category-C subjects were younger with higher BMI and were more likely current smokers. These characteristics are strikingly similar to those of our Clusters 1 and 2 subjects. Cluster 1 included sub-jects that had thicker airway walls compared to Clus-ters 3 and 4, and had minimal-to-no emphysema. In addition, Cluster 2 exhibited several characteristics similar to Cluster 1, including lower symptomatology with CAT ≥10, thicker airway walls, minimal-to-no emphysema and FEV1/FVC = 0.68 (close to 0.74 for Cluster 1) as well as the highest BMI and βtissue
among all clusters. Nonetheless, different from Clus-ter 1 but similar to ClusClus-ter 4, ClusClus-ter 2 exhibited se-vere activity limitations and had relatively higher fSAD% and lower Jacobian. The major difference
between Clusters 2 and 4 is that Cluster 2 had the highest BMI and βtissue. This suggests that
symptom-atic current smoker subjects in category C with pre-served pulmonary function may be further divided into two sub-groups (Clusters 1 and 2) with distinct characteristics.
Garcia-Aymerich et al. [10] identified three groups in a cohort of 342 subjects recruited for the Pheno-type and Course of COPD (PAC-COPD) study in Spain, using a comprehensive set of clinical, func-tional, biological and imaging metrics. Groups 1, 2 and 3 had respective FEV1/FVC of 0.44, 0.57 and 0.61. In addition to milder airflow limitation, Group 3 exhibited high BMI (obesity), systemic inflamma-tion, cardiovascular disease, diabetes and activity limitation. These characteristics appear to overlap with those of our Cluster 2. While both Clusters 2 and 3 were fSAD-dominant subjects, they were char-acterized by increased and decreased airway wall-thickness, respectively. Also, Sood et al. [38] suggested that higher BMI (obesity) might contribute to systemic inflammation.
Our study here has several limitations. It focused on current smokers and was a cross-sectional study. In the future, the analysis shall be extended to include former smokers and compared with the current analysis. Also, our analysis will be extended to longitudinal data and cross validation shall be performed to examine cluster transition and stability over time. As a preliminary study, we included in the Additional file 1 the cluster analysis of longitudinal data from a small COPD cohort, showing consistently four stable clusters. While our use of image matching is refined to the level of accounting for lobar slippage, it requires segmentation of the lobes at both in-spiration and expiration.
Conclusions
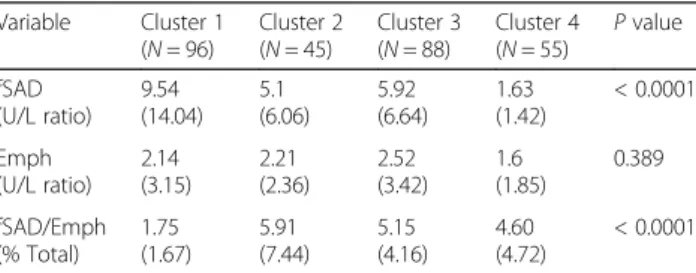
In conclusion, using a K-means clustering method we found four distinct stable clusters of COPD subtypes. These are Cluster 1, non-severe COPD with normal airway structure (relatively resistant smoker); Cluster 2, a mix of non-severe and severe COPD with fSAD dominance, low emphysema percentage, high tissue fraction with wall thickening; Cluster 3, a mix of non-severe and severe COPD, fSAD dominance with decreased wall thickness and luminal narrowing; Clus-ter 4, a mix of severe fSAD and emphysema with significant alterations in functional and structural var-iables. A decision tree analysis with only 7 discrimin-ant imaging-based variables allows classification with an accuracy close to the “original” cluster member-ship. The unique structural and functional character-istics observed in each cluster can help shed light on the existing heterogeneous nature of the disease. Table 6Upper/lower zone Emph% and fSAD%
Variable Cluster 1 (N= 96)
Cluster 2 (N= 45)
Cluster 3 (N= 88)
Cluster 4 (N= 55)
Additional file
Additional file 1:Table S1.Standardized loadings of seven principal components based upon correlation matrix.Table S2.Major structural and functional imaging-based variables in four imaging-based clusters for 45 current smokers from longitudinal study.Figure S1.Clustering analysis, a: Internal property in different clustering methods; b: Clustering stability analysis between K-means and Hierarchical clustering with different number of clusters.Figure S2.Cluster analysis in training set (a) and validation set (b) with four clusters.Figure S3.A scree plot for determining the optimal number of principal components for longitudinal study. (DOCX 276 kb)
Abbreviations
ADI:Anisotropic deformation index; BMI: Body mass index; BronInt: Right intermediate bronchus;Cr: Airway luminal circularity;Dh: Hydraulic luminal
diameter; Emph%: Emphysema percentage; FEV1: Forced expiratory volume
in one second; fSAD%: Functional small airway disease percentage; Jacobian: Determinant of Jacobian matrix; LA: Airway luminal area; LLL: Left lower lobe; LMB: Left main bronchus; LUL: Left upper lobe; Lung shape: Apical-basal distance over ventral-dorsal distance at TLC; MICA: Multiscale imaging-based cluster analysis; PCA: Principal component analysis; PFT: Pulmonary function test; PRISm: Preserved ratio impaired spirometry; QCT: Quantitative computed tomography; RLL: Right lower lobe; RMB: Right main bronchus; RML: Right middle lobe; RUL: Right upper lobe; RV: Residual volume; sLLL: Sub-grouped left lower lobe with branches of LB6, LB8; sLUL: Sub-grouped left upper lobe with branches of LB1;
SPIROMICS: Subpopulations and intermediate outcome measures in COPD study; sRLL: grouped right lower lobe with branches of RB6; sRML: Sub-grouped right middle lobe with branches of RB4; sRUL: Sub-Sub-grouped right upper lobe with branches of RB1; TLC: Total lung capacity; TriLLB: Trifurcation of left lower lobe; U/(M + L)|v: The ratio of air volume changes in upper lobes to those in middle and lower lobes; WA%: Airway wall area percentage, i.e., the ratio of wall area to total area; WBC: White blood cell; WT: Airway wall thickness;βtissue: Tissue fraction;ΔVairF: Lobar fraction of air
volume change between TLC and RV;θ: Bifurcation angle between two daughter branches
Acknowledgements
The authors thank the SPIROMICS participants and participating physicians, investigators and staff for making this research possible. More information about the study and how to access SPIROMICS data is athttps://
www.spiromics.org/spiromics/. We would like to acknowledge the following current and former investigators of the SPIROMICS sites and reading centers: Neil E Alexis, PhD; Wayne H Anderson, PhD; Igor Barjaktarevic, MD, PhD; R Graham Barr, MD, DrPH; Eugene R Bleecker, MD; Richard C Boucher, MD; Russell P Bowler, MD, PhD; Elizabeth E Carretta, MPH; Stephanie A Christenson, MD; Alejandro P Comellas, MD; Christopher B Cooper, MD, PhD; David J Couper, PhD; Gerard J Criner, MD; Ronald G Crystal, MD; Jeffrey L Curtis, MD; Claire M Doerschuk, MD; Mark T Dransfield, MD; Christine M Freeman, PhD; MeiLan K Han, MD, MS; Nadia N Hansel, MD, MPH; Annette T Hastie, PhD; Eric A Hoffman, PhD; Robert J Kaner, MD; Richard E Kanner, MD; Eric C Kleerup, MD; Jerry A Krishnan, MD, PhD; Lisa M LaVange, PhD; Stephen C Lazarus, MD; Fernando J Martinez, MD, MS; Deborah A Meyers, PhD; Wendy C Moore, MD; John D Newell Jr., MD; Laura Paulin, MD, MHS; Stephen Peters, MD, PhD; Cheryl Pirozzi, MD; Elizabeth C Oelsner, MD, MPH; Wanda K O’Neal, PhD; Victor E Ortega, MD, PhD; Robert Paine, III, MD; Nirupama Putcha, MD, MHS; Sanjeev Raman, MBBS, MD; Stephen I. Rennard, MD; Donald P Tashkin, MD;; J Michael Wells, MD; Robert A Wise, MD; and Prescott G Woodruff, MD, MPH. The project officers from the Lung Division of the National Heart, Lung, and Blood Institute were Lisa Postow, PhD, and Thomas Croxton, PhD, MD.
Funding
Support for this study was provided, in part, by NIH grants U01-HL114494, R01-HL112986 and S10-RR022421. SPIROMICS was supported by contracts from the NIH/NHLBI (HHSN268200900013C, HHSN268200900014C, HHSN268200900015C, HHSN268200900016C, HHSN268200900017C, HHSN268200900018C, HHSN268200900019C, HHSN268200900020C), and sup-plemented by contributions made through the Foundation for the NIH and the COPD Foundation from AstraZeneca/MedImmune; Bayer; Bellerophon
Therapeutics; Boehringer-Ingelheim Pharmaceuticals, Inc..; Chiesi Farmaceutici S.p.A.; Forest Research Institute, Inc.; GlaxoSmithKline; Grifols Therapeutics, Inc.; Ikaria, Inc.; Nycomed GmbH; Takeda Pharmaceutical Company; Novartis Pharmaceuticals Corporation; ProterixBio; Regeneron Pharmaceuticals, Inc.; Sanofi; and Sunovion.
Author’s contributions
Conception and design: BH, SC; acquisition of data: BH, SC, EAH, APC, JDN, RGB, EB, CBC, DC, MH, NNH, REK, EAK, ECK, FJM, WO, SIR, PGW, CLL; analysis and interpretation of data: all authors; drafting the article or revising it critically for important intellectual content: BH, SC, JC, EAH, CLL; final approval of the version to be published: all authors. All authors read and approved the final manuscript.
Ethics approval and consent to participate
Ethics and consent were approved by SPIROMICS committee.
Consent for publication
The paper was approved by SPIROMICS publications and presentation committee.
Competing interests
There is no conflict of interest for all authors including:
Babak Haghighi, Sanghun Choi, Jiwoong Choi, Eric A. Hoffman, Alejandro P. Comellas, John D. Newell Jr., R. Graham Barr, Eugene Bleecker, Christopher B. Cooper, David Couper, MeiLan Han, Nadia N. Hansel, Richard E. Kanner, Ella A. Kazerooni, Eric C Kleerup, Fernando J. Martinez, Wanda O’Neal, Stephen I Rennard, Prescott G Woodruff, Ching-Long Lin. Although E.A. Hoffman is a shareholder in VIDA diagnostics, which is commercializing lung image ana-lysis software derived from the University of Iowa lung imaging group.
Publisher’s Note
Springer Nature remains neutral with regard to jurisdictional claims in published maps and institutional affiliations.
Author details
1Department of Mechanical and Industrial Engineering, University of Iowa,
2406 Seamans Center for the Engineering Art and Science, Iowa City, Iowa 52242, USA.2IIHR-Hydroscience & Engineering, University of Iowa, 2406 Seamans Center for the Engineering Art and Science, Iowa City, Iowa 52242, USA.3Department of Mechanical Engineering, Kyungpook National University, Daegu, Republic of Korea.4Department of Radiology, University of Iowa, Iowa City, Iowa, USA.5Department of Epidemiology, Mailman School of Public Health, Columbia University Medical School, New York, NY, USA. 6Division of Genetics, Genomics and Precision Medicine, Department of
Medicine, University of Arizona, Tucson, AZ, USA.7Department of Physiology, UCLA, Los Angeles, CA, USA.8Department of Biostatistics, University of North Carolina, Chapel Hill, NC, USA.9Department of Internal Medicine, University of Michigan, Ann Arbor, MI, USA.10School of Medicine, Johns Hopkins, Baltimore, MD, USA.11School of Medicine, University of Utah, Salt Lake City, UT, USA.12Department of Radiology, University of Michigan, Ann Arbor, MI, USA.13Department of Medicine, UCLA, Los Angeles, CA, USA.14Department of Medicine, Weill Cornell Medical Center, New York, NY, USA.15School of Medicine, University of North Carolina, Chapel Hill, NC, USA.16Department of Internal Medicine, University of Nebraska College of Medicine, NE, USA and Clinical Discovery Unit, AstraZeneca, Cambridge, UK.17Department of Medicine, University of California San Francisco, San Francisco, CA, USA.
Received: 5 June 2018 Accepted: 10 September 2018
References
1. Murphy SL, Kochanek KD, Xu J, Heron M. Deaths: final data for 2012. Natl Vital Stat Rep Cent Dis Control Prev Natl Cent Health Stat Natl Vital Stat Syst. 2015;63:1–117.
3. Rabe KF, Hurd S, Anzueto A, Barnes PJ, Buist SA, Calverley P, Fukuchi Y, Jenkins C, Rodriguez-Roisin R, van Weel C, Zielinski J. Global initiative for chronic obstructive lung disease. Global strategy for the diagnosis, management, and prevention of chronic obstructive pulmonary disease: GOLD executive summary. Am J Respir Crit Care Med. 2007;176:532–55. 4. Han MK, Agusti A, Calverley PM, Celli BR, Criner G, Curtis JL, Fabbri LM,
Goldin JG, Jones PW, Macnee W, Make BJ, Rabe KF, Rennard SI, Sciurba FC, Silverman EK, Vestbo J, Washko GR, Wouters EFM, Martinez FJ. Chronic obstructive pulmonary disease phenotypes: the future of COPD. Am J Respir Crit Care Med. 2010;182:598–604.
5. Burrows B, Fletcher CM, Heard BE, Jones NL, Wootliff JS. The emphysematous and bronchial types of chronic airways obstruction: a Clinicopathological study of patients in London and Chicago. Lancet. 1966;287:830–5.
6. Choi S, Hoffman EA, Wenzel SE, Castro M, Fain SB, Jarjour NN, Schiebler ML, Chen K, Lin C-L. Quantitative assessment of multiscale structural and functional alterations in asthmatic populations. J Appl Physiol. 2015;118:1286–98. 7. Choi S, Hoffman EA, Wenzel SE, Castro M, Fain S, Jarjour N, Schiebler ML, Chen
K, Lin C-L. Quantitative computed tomographic imaging–based clustering differentiates asthmatic subgroups with distinctive clinical phenotypes. J Allergy Clin Immunol.https://doi.org/10.1016/j.jaci.2016.11.053. 8. Hoffman EA, Lynch DA, Barr RG, van Beek EJR, Parraga G, IWPFI
Investigators. Pulmonary CT and MRI phenotypes that help explain chronic pulmonary obstruction disease pathophysiology and outcomes. J Magn Reson Imaging JMRI. 2016;43:544–57.
9. Cho MH, Washko GR, Hoffmann TJ, Criner GJ, Hoffman EA, Martinez FJ, Laird N, Reilly JJ, Silverman EK. Cluster analysis in severe emphysema subjects using phenotype and genotype data: an exploratory investigation. Respir Res. 2010;11:30.
10. Garcia-Aymerich J, Gómez FP, Benet M, Farrero E, Basagaña X, Gayete À, Paré C, Freixa X, Ferrer J, Ferrer A, Roca J, Gáldiz JB, Sauleda J, Monsó E, Gea J, Barberà JA, Agustí À, Antó JM, PAC-COPD Study Group. Identification and prospective validation of clinically relevant chronic obstructive pulmonary disease (COPD) subtypes. Thorax. 2011;66:430–7.
11. Paoletti M, Camiciottoli G, Meoni E, Bigazzi F, Cestelli L, Pistolesi M, Marchesi C. Explorative data analysis techniques and unsupervised clustering methods to support clinical assessment of chronic obstructive pulmonary disease (COPD) phenotypes. J Biomed Inform. 2009;42:1013–21. 12. Moore WC, Meyers DA, Wenzel SE, Teague WG, Li H, Li X, D’Agostino R, Castro
M, Curran-Everett D, Fitzpatrick AM, Gaston B, Jarjour NN, Sorkness R, Calhoun WJ, Chung KF, SAA C, Dweik RA, Israel E, Peters SP, Busse WW, Erzurum SC, Bleecker ER, National Heart, Lung, and Blood Institute’s Severe Asthma Research Program. Identification of asthma phenotypes using cluster analysis in the severe asthma research program. Am J Respir Crit Care Med. 2010;181:315–23. 13. Burgel P-R, Roche N, Paillasseur J-L, Tillie-Leblond I, Chanez P, Escamilla R,
Court-Fortune I, Perez T, Carré P, Caillaud D, INITIATIVES BPCO Scientific Committee. Clinical COPD phenotypes identified by cluster analysis: validation with mortality. Eur Respir J. 2012;40:495–6.
14. Castaldi PJ, Dy J, Ross J, Chang Y, Washko GR, Curran-Everett D, Williams A, Lynch DA, Make BJ, Crapo JD, Bowler RP, Regan EA, Hokanson JE, Kinney GL, Han MK, Soler X, Ramsdell JW, Barr RG, Foreman M, van Beek E, Casaburi R, Criner GJ, Lutz SM, Rennard SI, Santorico S, Sciurba FC, DeMeo DL, Hersh CP, Silverman EK, et al. Cluster analysis in the COPDGene study identifies subtypes of smokers with distinct patterns of airway disease and emphysema. Thorax. 2014;69:415–22.
15. Burgel P-R, Paillasseur J-L, Caillaud D, Tillie-Leblond I, Chanez P, Escamilla R, Court-Fortune I, Perez T, Carré P, Roche N. Initiatives BPCO scientific committee. Clinical COPD phenotypes: a novel approach using principal component and cluster analyses. Eur Respir J. 2010;36:531–9.
16. Gagnon P, Casaburi R, Saey D, Porszasz J, Provencher S, Milot J, Bourbeau J, O’Donnell DE, Maltais F. Cluster analysis in patients with GOLD 1 chronic obstructive pulmonary disease. PLoS One. 2015;10:e0123626.
17. Castaldi PJ, Benet M, Petersen H, Rafaels N, Finigan J, Paoletti M, Boezen HM, Vonk JM, Bowler R, Pistolesi M, Puhan MA, Anto J, Wauters E, Lambrechts D, Janssens W, Bigazzi F, Camiciottoli G, Cho MH, Hersh CP, Barnes K, Rennard S, Boorgula MP, Dy J, Hansel NN, Crapo JD, Tesfaigzi Y, Agusti A, Silverman EK, Garcia-Aymerich J. Do COPD subtypes really exist? COPD heterogeneity and clustering in 10 independent cohorts. Thorax 2017;thoraxjnl-2016-209846. doi:
https://doi.org/10.1136/thoraxjnl-2016-209846.
18. Choi S, Hoffman EA, Wenzel SE, Castro M, Lin C-L. Improved CT-based estimate of pulmonary gas trapping accounting for scanner and lung-volume variations in a multicenter asthmatic study. J Appl Physiol. 2014;117:593–603.
19. Couper D, LaVange LM, Han M, Barr RG, Bleecker E, Hoffman EA, Kanner R, Kleerup E, Martinez FJ, Woodruff PG, Rennard S, Alexis N, Anderson W, Badr S, Basta P, Boucher RC, Carretta E, Cooper CB, Curtis J, Doerschuk C, Greenberg J, Hansel N, Kaner R, Kesimer M, Lazarus SC, Meyers D, O’Neal W, Paine R, Group for the SR,et al.Design of the Subpopulations and Intermediate Outcomes in COPD Study (SPIROMICS). Thorax 2013; thoraxjnl-2013-203897. doi:https://doi.org/10.1136/thoraxjnl-2013-203897.
20. Multiscale Imaging-Based Clusters in the COPD Cohort Associates with Clinical Characteristics: The SubPopulations and InteRmediate Outcome Measures in COPD Study (SPIROMICS) - ajrccm-conference. 2016. 193.1_ MeetingAbstracts. A6612. athttp://www.atsjournals.org/doi/pdf/10.1164/ ajrccm-conference.2016.193.1_MeetingAbstracts.A6612.
21. Hennig C. Cluster-wise assessment of cluster stability. Comput Stat Data Anal. 2007;52:258–71.
22. Shaker SB, Stavngaard T, Laursen LC, Stoel BC, Dirksen A. Rapid fall in lung density following smoking cessation in COPD.COPD2011;8:2–7.
23. Sieren JP, Newell JD, Barr RG, Bleecker ER, Burnette N, Carretta EE, Couper D, Goldin J, Guo J, Han MK, Hansel NN, Kanner RE, Kazerooni EA, Martinez FJ, Rennard S, Woodruff PG, Hoffman EA, SPIROMICS Research Group. SPIROMICS protocol for multicenter quantitative computed tomography to phenotype the lungs. Am J Respir Crit Care Med. 2016;194:794–806. 24. Yin Y, Hoffman EA, Lin C-L. Mass preserving nonrigid registration of CT lung
images using cubic B-spline. Med Phys. 2009;36:4213–22.
25. Haghighi B, D Ellingwood N, Yin Y, Hoffman EA, Lin C-L. A GPU-based symmetric non-rigid image registration method in human lung. Med Biol Eng Comput. 2017.https://doi.org/10.1007/s11517-017-1690-2. 26. Amelon R, Cao K, Ding K, Christensen GE, Reinhardt JM, Raghavan ML.
Three-dimensional characterization of regional lung deformation. J Biomech. 2011;44:2489–95.
27. Jahani N, Yin Y, Hoffman EA, Lin C-L. Assessment of regional non-linear tissue deformation and air volume change of human lungs via image registration. J Biomech. 2014;47:1626–33.
28. Galbán CJ, Han MK, Boes JL, Chughtai KA, Meyer CR, Johnson TD, Galbán S, Rehemtulla A, Kazerooni EA, Martinez FJ, Ross BD. Computed tomography– based biomarker provides unique signature for diagnosis of COPD phenotypes and disease progression. Nat Med. 2012;18:1711.
29. Jain AK, Murty MN, Flynn PJ. Data clustering: a review. ACM Comput Surv CSUR. 1999;31:264–323.
30. Fraley C, Raftery AE. Model-based clustering, discriminant analysis, and density estimation. J Am Stat Assoc. 2002;97:611–31.
31. clValid: An R Package for Cluster Validation | Brock | Journal of Statistical Software. 2008.https://www.jstatsoft.org/article/view/v025i04.
32. NbClust function | R Documentation. 2015.https://www.rdocumentation. org/packages/NbClust/versions/3.0/topics/NbClust.
33. Hayton JC, Allen DG, Scarpello V. Factor retention decisions in exploratory factor analysis: a tutorial on parallel analysis. Organ Res Methods. 2004;7:191–205.
34. Data Analysis and Decision Support | Daniel Baier | Springer 2005.http:// www.springer.com/us/book/9783540260073.
35. Woodruff PG, Barr RG, Bleecker E, Christenson SA, Couper D, Curtis JL, Gouskova NA, Hansel NN, Hoffman EA, Kanner RE, Kleerup E, Lazarus SC, Martinez FJ, Paine RI, Rennard S, Tashkin DP, Han MK. Clinical significance of symptoms in smokers with preserved pulmonary function. N Engl J Med. 2016;374:1811–21.
36. Smith B, Hoffman E, Donohue K, Rabinowitz D, Barr RG. Airway wall thinness and COPD: analysis of spatially comparable airways. The MESA COPD study. Eur Respir J. 2013;42:210.
37. Wan ES, Castaldi PJ, Cho MH, Hokanson JE, Regan EA, Make BJ, Beaty TH, Han MK, Curtis JL, Curran-Everett D, Lynch DA, DeMeo DL, Crapo JD, Silverman EK. Epidemiology, genetics, and subtyping of preserved ratio impaired spirometry (PRISm) in COPDGene. Respir Res. 2014;15:89. 38. Sood A. Obesity, Adipokines, and lung disease. J Appl Physiol Bethesda Md