Offshore Wind Integration
through High Voltage Direct
Current Systems
M
ARCC
HEAHM
AÑESchool of Engineering
Cardiff University, UK
T
HESISS
UBMITTED FOR THED
EGREE OFD
OCTOR OFP
HILOSOPHYContent
Content ... ii
Abstract ... vi
Declaration ... vii
Acknowledgements ... viii
List Abbreviations ... ix
List of Tables ... xi
List of Figures ... xiii
Chapter 1
1.
Introduction ... 1
1.1 Offshore Wind Energy ... 1
1.2 HVDC-connected Offshore Wind Power Plants ... 2
1.3 Existing and Future Projects ... 3
1.4 Future Challenges ... 4
1.5 Objectives of the Thesis ... 5
1.6 Thesis Outline ... 5
Chapter 2
2.
HVDC-connected
Offshore
Wind
Power
Plants ... 7
2.1 Introduction ... 7
2.2 General Configuration of an HVDC-connected Offshore Wind Power Plant . 7 2.3 HVDC Transmission System Configurations ... 8
2.4 Control of HVDC-connected Wind Power Plants ... 13
2.5 Functional Requirements ... 18
2.6 Summary ... 27
Chapter 3
3.
Interlinks
between
HVDC-Connected
Offshore Wind Power Plants ... 29
3.1 Introduction ... 29
3.2 Interlink Options ... 30
3.4 Power Loss Analysis ... 32
3.5 Availability Analysis ... 45
3.6 Cost-Benefit Analysis ... 55
3.7 Interlink Cable Capacity ... 57
3.8 Summary ... 62
Chapter 4
4.
Inertia Emulation in Offshore Wind Power
Plants ... 64
4.1 Introduction ... 64
4.2 Inertia Response in Variable Speed Wind Turbines ... 65
4.3 Control Strategies for Inertia Emulation ... 70
4.4 Impact of Wind Turbine Recovery Power ... 78
4.5 Integration with VSC-HVDC Transmission Systems ... 82
4.6 Experimental Implementation of Inertia Emulation ... 84
4.7 Simulation and Experimental results ... 89
4.8 Summary ... 94
Chapter 5
5.
Electrical Resonance Stability in
HVDC-connected Offshore Wind Power Plants ... 96
5.1 Introduction ... 96
5.2 Impedance-based Representation of an HVDC-connected OWPP ... 97
5.3 Impedance-based Model of VSCs ... 99
5.4 Stability Analysis of HVDC-connected OWPPs ... 102
5.5 Resonance Characterisation ... 107
5.6 Voltage Stability Analysis ... 111
5.7 Summary ... 120
Chapter 6
6.
Conclusions ... 121
6.1 General Conclusions ... 121 6.2 Contributions ... 124 6.3 Future Work ... 124Appendix A
Publications ... 126
A.1. Publications Related to this Thesis... 126
A.2. Other Publications during the PhD... 126
Appendix B
Details of Power Loss and Availability Analysis
... 128
B.1. Objective Function of OPF Algorithm ... 128
B.2. Variables of OPF Algorithm ... 129
B.3. Availability Expressions ... 130
B.3.1. AC collector interlink ... 130
B.3.2. AC offshore converter interlink... 131
B.3.3. DC offshore converter interlink... 131
B.4. Outage Combinations ... 132
Appendix C
Modelling and Control of Wind Turbine with
Permanent Magnet Synchronous Generator ... 136
C.1. Aerodynamic and Mechanical Model ... 136
C.2. Generator Model ... 137
C.3. Back-to-back Control ... 138
Appendix D
Low Order System Frequency Response Model .. 139
Appendix E
Specifications of Experimental Test Rig ... 140
Appendix F
Complex Transfer Functions ... 143
Appendix G
Demonstration of Positive-net-Damping Stability
Criteria ... 145
G.1. Impedance-based Models ... 145
G.2.1. Positive-net-damping Criterion from the Gain Margin ... 147
G.2.2. Positive-net-damping Criterion from the Phase Margin ... 149
Appendix H
Details of Case Studies ... 152
H.1. Case study in Chapter 3 ... 152
H.2. Case study in Chapter 4 ... 155
H.2.1. Wind Turbine ... 155
H.2.2. HVDC Point-to-point System ... 157
H.2.3. Onshore ac Grid ... 158
H.3. Chapter 5 ... 158
Abstract
Offshore wind generation has an important role in the transition to renewable energy. In particular, HVDC-connected Offshore Wind Power Plants (OWPPs) are emerging as an economical solution for long distances from the shore. This thesis was focused on three key areas related to planning, operation and stability issues, which are present technical challenges in the integration of OWPPs through VSC-HVDC transmission systems.
In relation to planning, the installation of interlink cables between OWPPs was analysed to increase the wind power transfer. Different interlink options were compared based on a power loss reduction and an increase of availability. In general, it was recommended to have interlinks close to the wind generation point to provide more flexible active power sharing between OWPPs. Also, a cost-benefit analysis was used to quantify savings from the operation with interlinks and a design procedure was developed to determine the interlink cable capacity.
In terms of operation, inertia emulation was analysed as a potential fast frequency response service from OWPPs. Synthetic inertia and temporary overproduction have been presented as main control strategies to implement inertia emulation and they were compared using MATLAB Simulink. Results showed similar frequency response performance from both strategies, however temporary overproduction was more appropriate in order to comply with system operator’s requirements. Emulation of inertia was also demonstrated in a HVDC-connected OWPP employing a hardware-in-the-loop set-up.
The converter control interaction with electrical resonances of the offshore ac grid was analysed. An impedance-based representation of the system was used to identify resonant frequencies and to assess stability. A reformulation of the positive-net-damping criterion was used to evaluate the effect that the offshore HVDC converter control and OWPP configuration have on the stability. As a result, risk of resonance interaction was identified in no-load operation and when a limited number of wind turbines were connected.
Declaration
This work has not been submitted in substance for any other degree or award at this or any other university or place of learning, nor is being submitted concurrently in candidature for any degree or other award.
Signed……….. Date………..
STATEMENT 1
This thesis is being submitted in partial fulfilment of the requirements for the degree of PhD
Signed……….. Date………..
STATEMENT 2
This thesis is the result of my own independent work/investigation, except where otherwise stated, and the thesis has not been edited by a third party beyond what is permitted by Cardiff University’s Policy on the Use of Third Party Editors by Research Degree Students. Other sources are acknowledged by explicit references. The views expressed are my own.
Signed……….. Date………..
STATEMENT 3
I hereby give consent for my thesis, if accepted, to be available online in the University’s Open Access repository and for inter-library loan, and for the title and summary to be made available to outside organisations.
Acknowledgements
The completion of this thesis would have not been possible without the support and help of many people. First, I would like to express my gratitude to Dr. Jun Liang for his technical guidance and for always trying to find a practical application to my research. I would also like to thank Prof. Nick Jenkins for his wise advices, which I will remember beyond the research presented in this thesis.
During this journey I had the pleasure to collaborate with other colleagues, who I would like to acknowledge with a special mention. My sincere thanks to Dr. Oluwole Daniel Adeuyi, with whom I have spent many days in the lab and I have learnt, suffered and overcome part of my research with great success. My thanks also go to Dr. Luis Sainz, who helped me to develop and complete an important part of this thesis.
In addition, I would like to acknowledge the financial support of the European Commission through the MEDOW project, which gave me the opportunity to explore and develop my career with different training and dissemination activities. In particular, my special thanks to the other MEDOWers for the interesting and useful discussions we shared during this project and also to Cath and Karolina for their patience dealing with all our issues.
I would also like to thank all my colleagues and friends in CIREGS for all the motivation and inspiration I got from them. In particular, my special thanks to Dantas, Tony, Senthooran, Tibin, Gen, Khadijat and Sathsara, with whom I spent most of the lunch and coffee breaks.
Last but not least, my deep gratitude to my family, who always gave me an unconditional support during this journey.
List Abbreviations
CIGRE Conseil International des Grands Réseaux Électriques COPT Capacity Outage Probability Tables
DFIG Doubly-Fed Induction Generator
ENTSOE European Network of Transmission System Operators for Electricity ETYS Electricity Ten Year Statement
EWEA European Wind Energy Association FRC Fully Rated Converter
FRT Fault Ride Through FSM Frequency Sensitive Mode GCP Grid Connection Point GIS Gas Insulated Switch GSC Grid Side Converter HIL Hardware-in-the-Loop HQT Hydro-Québec TransÉnergie HVAC High Voltage Alternate Current HVDC High Voltage Direct Current
IESO Independent Electricity System Operator IGBT Insulated-Gate Bipolar Transistor
LCC Line Commutated Converters LFSM Limited Frequency Sensitive Mode MMC Modular Multilevel Converter MPPT Maximum Power Point Tracking MTDC Multi-Terminal Direct Current MTTF Mean Time To Fail
MTTR Mean Time To Repair
MVAC Medium Voltage Alternate Current NPV Net Present Value
OFTO Offshore Transmission Owner
ONS Operador Nacional do Sistema Eletrico
PI Proportional-Integral PLL Phase Locked Loop POC Point of Connection RL Resistance-Inductance
RoCoF Rate of Change of Frequency SI Synthetic Inertia
TO Temporary Overproduction TSO Transmission System Operator
UK United Kingdom
VSC Voltage Source Converter WFC Wind Farm Converter
WPP Wind Power Plant
WT Wind Turbine
XLPE Cross-linked Polyethylene Insulation PMSG Permanent Magnet Synchronous Generator
List of Tables
Table 1.1: Details of existing HVDC-connected OWPPs projects presented in Figure
1.3 [10], [11], [16] ... 4
Table 2.1: Functional requirements in HVDC-connected OWPPs ... 18
Table 3.1: Power loss coefficients of different converters expressed in per-unit [95]– [98]. ... 35
Table 3.2: Power loss coefficients of single HVDC-connected OWPP in different OPF options expressed in per-unit. ... 39
Table 3.3: COPT for example without interlink. ... 51
Table 3.4: COPT for example with dc offshore converter interlink. ... 51
Table 3.5: COPT for example with ac offshore converter interlink. ... 51
Table 3.6: COPT for example with ac collector platform interlink. ... 52
Table 3.7: Interlink cable costs for a length of 5 km ... 55
Table 3.8: Annual average of undelivered energy and energy losses with their associated savings compared to the base case... 56
Table 3.9: Results of cost-benefit analysis ... 57
Table 3.10: Sensitivity analysis in relation to the dc breaker cost ... 57
Table 3.11: Results of ac interlink cable capacity selection. ... 59
Table 4.1: Example of HQT requirement of inertia emulation applied for the grid scenario presented in [112]. ... 67
Table 4.2: Specifications for inertia emulation in different system operators ... 68
Table 4.2: Control parameters of Synthetic Inertia strategies ... 73
Table 4.3: Control parameters of Temporary Overproduction strategies ... 73
Table 4.5: RoCoF and maximum frequency deviation for simulations results in Figures 4.6 and 4.7. The minimum values for SI and TO options are highlighted in boldface. ... 77
Table 4.7: Frequency deviation and RoCoF from PSCAD simulation results ... 91
Table B.1: Outage combinations of S1-S5 and resulting capacity outage. Capacities of S1-S5 are expressed in per-unit with base power equal to the rated power of an OWPP ... 132
Table E.1: Specifications of wind turbine test rig ... 140
Table E.2: Specifications of VSC test rig ... 141
Table E.3: Specifications of dc network cabinet ... 141
Table E.4: Specifications of real time simulator ... 142
Table E.5: Specifications of grid simulator... 142
Table H.1: Parameters of Wind Turbines, HVDC converters and transformers. .... 152
Table H.2: Cable parameters. ... 153
Table H.3: Cable lengths of wind farm cluster in Figure H.2. ... 154
Table H.4: MTTF and MTTR of transmission system components [102], [103]. ... 155
Table H.5: Parameters of PMSG. ... 155
Table H.6: Aerodynamic and mechanical characteristic of WT. ... 156
Table H.7: Specifications and control parameters of WT back-to-back converter. . 156
Table H.8: Specifications and control parameters of dc cables. ... 157
Table H.9: Specifications and control parameters of HVDC converters. ... 157
Table H.10: Specifications of ac grid model. ... 158
Table H.11: Specifications of offshore HVDC converter and HVDC transformer. 158 Table H.12: Specifications of WT grid-side converter and WT transformer. ... 159
List of Figures
Figure 1.1: Global wind power capacity and annual additions from 2005 to 2015 [1].
... 1
Figure 1.2: Cumulative and annual offshore wind installations in Europe from 1993 to 2015 [6] ... 2
Figure 1.3 Map of offshore wind farms in the North Sea connected to Germany [16] . ... 3
Figure 2.1: General configuration of an OWPP with two wind farms connected through an HVDC point-to-point link. ... 8
Figure 2.2: OWPP connected through a Point-to-point system. ... 10
Figure 2.3: OWPP connected through an offshore ac grid. ... 11
Figure 2.4: OWPP connected through an offshore dc grid. ... 12
Figure 2.5: General control scheme of a HVDC-connected OWPP ... 13
Figure 2.6: WPP control based on [47]. ... 14
Figure 2.7: Control scheme for GSCs using vector control ... 16
Figure 2.8: Control scheme for WFCs using amplitude control or vector control. ... 17
Figure 2.9: Active power control functions of OWPP. ... 19
Figure 2.10: ENTSOE requirements for voltage at the grid connection point of a dc-connected system [18]. Voltage operational boundaries are function of Q/Pmax, where Pmax is the maximum active power transmission capacity. The outer envelope represents the maximum values fixed by ENTSOE. The inner envelope is defined by each system operator and it does not have to be a rectangle. ... 20
Figure 2.11: National Grid (Great Britain) requirements for reactive power capacity at the interface connection point of a WPP or a DC-connected system [61]. The Q values are expressed as function of the interface point capacity of the OWPP. The dashed area is an optional requirement for active power generation below 0.2 pu. ... 20 Figure 2.12: Voltage limits as function of power factor required by National Grid
connection point in 155 kV. National Grid has different voltage levels (380, 220, 110
and 33 kV), but only high voltage is considered for OWPPs. ... 21
Figure 2.13: TenneT (Germany) requirements for reactive power capacity supplied by a generator unit at the grid connection point [34]. ... 21
Figure 2.14: Voltage support during ac fault required by TenneT (Germany) in generating units [34]. ... 22
Figure 2.15: Frequency response characteristic required by EirGrid (Ireland) in WPPs [65]. Points A-E are defined depending on system conditions and location of the OWPP. Deadband frequency range is between B and C. ... 23
Figure 2.16: Frequency response characteristic required by TenneT (Germany) in offshore-connected systems [34]. The power reduction depends on the current available power, PM. ... 23
Figure 2.17: ENTSOE requirements for frequency response in DC-connected systems [18]. A Frequency Sensitive Mode (FSM) is defined for under and overfrequency events, whereas a Limited Frequency Sensitive Mode (LFSM) can be defined for a frequency trend or both. The droop gains s1 – s4 are at least 0.1%, the maximum deadband is ±500 mHz and the maximum insensitivity is 30 mHz. The LFSM is activated for frequency variations higher than 200 mHz. ... 23
Figure 2.18: FRT profile required by ENTSOE at the grid connection point of HVDC-connected power plants [18]. 𝑈𝑟𝑒𝑡 is the retained voltage during an ac fault, 𝑡𝑐𝑙𝑒𝑎𝑟 is the fault duration and (𝑈𝑟𝑒𝑐1, 𝑡𝑟𝑒𝑐1) and (𝑈𝑟𝑒𝑐2, 𝑡𝑟𝑒𝑐2) are limits defined during the fault recovery... 25
Figure 2.19: FRT requirements for WTs in different countries [84]. ... 26
Figure 3.1: Representation of ac and dc interlinks. ... 29
Figure 3.2: Structure of Chapter 3. ... 30
Figure 3.3: Interlink options between OWPPs. ... 31
Figure 3.4: Case study with two HVDC-connected OWPPs used in power loss and availability analysis. ... 32
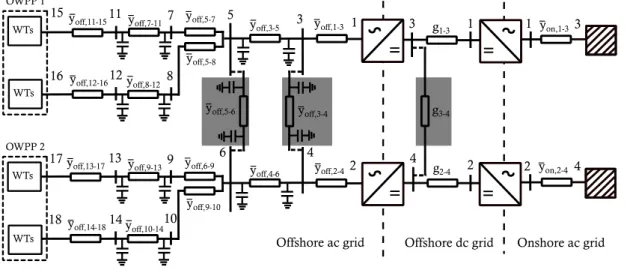
Figure 3.5: Model of the case study with enumeration of converters, buses and admittances (interlink cables options are indicated in grey rectangles). ... 34
Figure 3.6: Inputs and outputs of Optimal Power Flow. ... 38 Figure 3.7: Total power losses in a single HVDC-connected OWPP for different OPF options and wind generations, 𝑃𝑂𝑊𝐹. ... 40 Figure 3.8: Reactive power supply from offshore converters in a single OWPP for different OPF options and wind generations, 𝑃𝑂𝑊𝐹. ... 40 Figure 3.9: Power loss distribution in a single OWPP for different OPF options. .... 41 Figure 3.10: Percentage distribution of power losses in a single OWPP when optimisation determines reactive power supply and POC voltage (OPF-QV) ... 41 Figure 3.11: Power losses and interlink power flow when one OWPP is generating nominal power and the other is not generating power. ... 44 Figure 3.12: Total power losses for different interlink options and interlink lengths when OWPP1 generates nominal power and OWPP2 does not generate power. ... 45 Figure 3.13: Interlink power flows for different interlink options and interlink lengths when OWPP1 generates nominal power and OWPP2 does not generate power. ... 45 Figure 3.14: Block diagrams to represent equivalent availability of OWPP transmission system elements. The per-unit quantities are referred to the rated power of an OWPP. ... 47 Figure 3.15: Elements to represent equivalent availability of two OWPPs with interlinks. The per-unit quantities are referred to the rated power of an OWPP ... 50 Figure 3.16: Energy availability for different wind capacity factors when OWPPs generate the same power, transmission system capacity is defined as 100% and interlink capacity for 50% of the OWPP rated power. ... 53 Figure 3.17: Energy availability for different interlink capacities when transmission system capacity is defined as 100% of the OWPP rated power. ... 53 Figure 3.18: Energy availability for different transmission system capacities when wind generation from each OWPP is 0.4 pu and interlink capacity is defined as 50% of the OWPP rated power. ... 53 Figure 3.19: Energy availability when failure rates are modified from 0.1 to 10 times
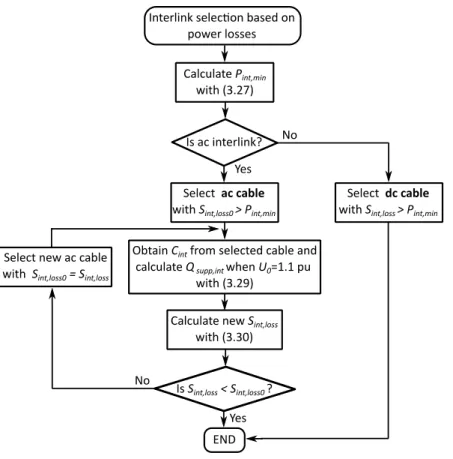
Figure 3.20: Flow chart to select interlink capacity based on power losses analysis 59
Figure 3.21: Flow chart to select interlink capacity based on availability analysis ... 60
Figure 3.22: Weibull distribution and WT generation used as an example to calculate minimum interlink capacity. ... 61
Figure 3.23: Energy availability for different interlink capacities (a) considering probability of all wind power generations and (b) considering capacity factor of the OWPP. The interlink capacities are expressed in per-unit considering the rated power of an OWPP as a base power. ... 62
Figure 4.1: Inertia Response description. ... 65
Figure 4.2: Representation of Inertia Emulation requirements. ... 68
Figure 4.3: General scheme of WT controls including inertia emulation. ... 69
Figure 4.4: Control scheme of Synthetic Inertia strategy. ... 71
Figure 4.5: Control scheme of Temporary Overproduction strategy. ... 72
Figure 4.6: Comparison of SI strategies considering the same time of overproduction and a maximum power contribution equal to 10% of P0. ... 75
Figure 4.7: Comparison of TO strategies considering the same time of overproduction and a maximum power contribution equal to 10% of P0. ... 76
Figure 4.8: Inertia emulation as TO with step function and maximum power contribution equal to 10% of nominal power. ... 78
Figure 4.9: Reduction of demand in ac grid with TO strategy... 78
Figure 4.10: Increase of overproduction time in TO from 6 to 10 s when the demand level is 4 GW. ... 79
Figure 4.11: Increase of power rate limit from 0.5 to 3 s when the demand level is 4 GW. ... 80
Figure 4.12: Limitation of recovery power with saturation at 2% of P0 when the demand level is 4 GW. ... 81
Figure 4.13: Limitation of recovery power with saturation at 2% of P0 and increase of power rate limit from 1 to 3 s when the demand level is 4 GW. ... 82
Figure 4.14: HVDC point-to-point control scheme with artificial frequency coupling
between onshore and offshore grids. ... 84
Figure 4.15: General diagram of the HIL set-up ... 85
Figure 4.16: Elements represented in the HIL test. The scaled-down components are in black and the emulated elements are in grey. ... 85
Figure 4.17: Wind Turbine test rig ... 86
Figure 4.18: VSC test rig and dc network cabinet ... 87
Figure 4.19: Interior of VSC test rig ... 87
Figure 4.20: Interface of RTDS with VSC test rig... 88
Figure 4.21: Real time simulator and Grid simulator ... 88
Figure 4.22: Simulation (left side) and experimental (right side) results of the onshore ac grid frequency ... 91
Figure 4.23: Simulation (left column) and experimental (right column) results of the power transfer through HVDC transmission. ... 92
Figure 4.24: Simulation (left column) and experimental (right column) results of the WT rotor speed and efficiency ... 92
Figure 4.25: Simulation (left column) and experimental (right column) results of the DC voltage at WFC and offshore ac frequency deviation. ... 93
Figure 4.26: Simulation results of onshore and offshore frequency and OWPP power variation during activation of inertia emulation. ... 94
Figure 5.1: General scheme of an HVDC-connected OWPP. ... 98
Figure 5.2: Impedance-based model of an HVDC-connected OWPP for resonance and stability analysis. ... 99
Figure 5.3: Control structures: (a) Offshore HVDC converter and (b) WT grid side converter. ... 101
Figure 5.4: Equivalent impedance-based circuit of an HVDC-connected OWPP with representation of offshore grid circuit. ... 102
Figure 5.6: Impedance-based model of an HVDC-connected OWPP with simplified VSC and cable models (indicated in grey rectangles) ... 109 Figure 5.7: Impedance-based model of an HVDC-connected OWPP with aggregation of collector system ... 109 Figure 5.8: Frequency response of OWPP impedance without and with VSC and cable model simplifications (parameters in Appendix H with 𝑘𝑝, 𝑣 = 1, 𝑘𝑖, 𝑣 = 500). .. 110 Figure 5.9: Zero-crossing frequencies of 𝑅𝑐ℎ when 𝑘𝑝, 𝑣 = 0.01, 𝑘𝑖, 𝑣 = 2.5. ... 113 Figure 5.10: Stable area of offshore HVDC converter in no-load operation as function of 𝑘𝑝, 𝑣, 𝑘𝑖, 𝑣 and 𝑙𝑐𝑏 (the stable and unstable examples of Figures 5.12 and 5.13 are marked with circles). ... 113 Figure 5.11: Root locus of OWPP in no-load operation for variations of export cable length and ac voltage control parameters. ... 114 Figure 5.12: Stable example in no-load operation with 𝑘𝑝, 𝑣 = 0.01, 𝑘𝑖, 𝑣 = 2.5
and 𝑙𝑐𝑏 = 10 𝑘𝑚. ... 115 Figure 5.13: Unstable example in no-load operation with 𝑘𝑝, 𝑣 = 0.01, 𝑘𝑖, 𝑣 = 4.6
and 𝑙𝑐𝑏 = 10 𝑘𝑚. ... 116 Figure 5.14: Stable area of offshore HVDC converter as a function of 𝑘𝑝, 𝑣 and 𝑘𝑖, 𝑣
and the number of connected WTs (the stable and unstable examples of Figures 5.16 and 5.17 are marked with a circle). ... 117 Figure 5.15: Root locus of OWPP for variations of ac voltage control parameters and number of WTs. ... 117 Figure 5.16: Stable example when all the WTs are connected (𝑁 = 80), 𝑘𝑝, 𝑣 = 1
and 𝑘𝑖, 𝑣 = 500. ... 118 Figure 5.17: Unstable example when 24 WTs are connected, 𝑘𝑝, 𝑣 = 1 and 𝑘𝑖, 𝑣 = 500. ... 119 Figure 5.18: Instantaneous and RMS voltages at POC when the number of WTs is reduced from 80 to 24 at 1 s. The ac voltage control parameters are 𝑘𝑝, 𝑣 = 1
and 𝑘𝑖, 𝑣 = 500. ... 119 Figure C.1: Control structure of generator-side VSC. ... 138
Figure C.2: Control structure of grid-side VSC. ... 138
Figure D.1: Block diagram of low order system frequency response model. ... 139
Figure G.1: Equivalent impedance-based circuit with load subsystem as an impedance. ... 145
Figure G.2: Equivalent impedance-based circuit with source as a Thévenin equivalent and load as Thévenin or Norton equivalents. ... 146
Figure G.3: Nyquist trajectories for stable and unstable systems. ... 147
Figure H.1: Equivalent impedance of a string with N WTs. ... 154
Chapter 1
1.
Introduction
1.1
O
FFSHOREW
INDE
NERGYThe total wind power capacity has increased more than seven times since 2005, as shown in Figure 1.1. By the end of 2015, wind energy represented 3.7% of the global electricity production and contributed to 15.6% of the renewable energy share [1]. Currently, wind generation is predominately onshore; however, there is an increasing interest in offshore wind generation due to limited onshore site location and less public opposition. Importantly, high-power wind turbines can be installed in the sea and the offshore wind speed is much higher and more uniform than inland [2].
Figure 1.1: Global wind power capacity and annual additions from 2005 to 2015 [1].
In Europe, offshore wind generation has significantly increased during the past decade, as illustrated in Figure 1.2. By the end of 2015, 91% (11 GW) of the global offshore wind capacity was installed in Europe [3]. The European Wind Energy Association (EWEA) expects that the total capacity in Europe will reach 20 GW by 2020 and 66 GW by 2030 [4], [5]. More than two thirds of the total European offshore wind capacity are installed in the North Sea, which is an ideal location for offshore wind generation due to high wind speeds and shallow water [6]. The UK is leading the market with nearly 50% of the total installed capacity in 2015 [6].
Chapter 1 Introduction
Figure 1.2: Cumulative and annual offshore wind installations in Europe from 1993 to 2015 [6]
1.2
HVDC-
CONNECTEDO
FFSHOREW
INDP
OWERP
LANTSGrid integration is one of the main challenges for offshore wind development. Offshore Wind Power Plants (OWPPs) can be connected to the onshore grid through High Voltage Alternate Current (HVAC) or High Voltage Direct Current (HVDC) submarine cables. The ac connection of offshore wind power plants is currently the most common solution, but dc connection provides an economically viable option for long distances (longer than 40 - 100 km [7]). This is because long ac submarine cables generate a considerable amount of reactive power that increases the power losses and requires the installation of reactive compensators. In addition, HVDC connections offer an electrical decoupling between OWPPs and onshore ac grids, which avoids resonance interactions and the propagation of ac faults [8].
HVDC can use two different converter topologies: Line Commutated Converters (LCCs) and Voltage Source Converters (VSCs). Conventional HVDC systems are based on LCC, which allows bulk power transmission for long distances. VSC has been developed recently for HVDC applications and is more suitable than LCC to connect OWPPs. Compared to LCC, VSC provides black start capability and requires a smaller footprint, which reduces the offshore platform cost. Also, VSCs are more robust to onshore ac grid disturbances, since they are based on IGBT valves and do not suffer from commutation failure [8]. VSCs have fast and independent control of active and reactive power, which is beneficial to OWPPs for providing ancillary services to onshore ac grids.
1.3
E
XISTING ANDF
UTUREP
ROJECTSBorWin1 was the first HVDC link to connect offshore wind farms to shore [9]. Since then, nine HVDC-connected OWPP projects located in the south-eastern part of the North Sea are in operation, under construction or planned, as shown in Figure 1.3 and Table 1.1 [10], [11]. These projects are based on HVDC point-to-point links, but a future offshore grid in the North Sea region with ac and dc interconnections is under discussion [10], [12]. In the UK, the Crown Estate is planning to install up to 25 GW of offshore wind generation and more than 75% of this capacity will be connected through HVDC point-to-point links [13]. In the US, it is anticipated that the Atlantic Wind Connection will integrate up to 6 GW of offshore wind through a Multi-terminal DC Grid (MTDC) [14], [15].
Chapter 1 Introduction
Table 1.1: Details of existing HVDC-connected OWPPs projects presented in Figure 1.3 [10], [11], [16]
Project Capacity Voltage Cable length Commissioning year
BorWin1 400 MW ±150 kV 200 km 2010 BorWin2 800 MW ±300 kV 200 km 2015 DolWin1 800 MW ±320 kV 165 km 2015 HelWin1 576 MW ±250 kV 130 km 2015 HelWin2 690 MW ±320 kV 130 km 2015 SylWin1 864 MW ±320 kV 205 km 2015 BorWin3 900 MW ±320 kV 200 km 2019 DolWin2 916 MW ±320 kV 135 km 2016 DolWin3 900 MW ±320 kV 160 km 2018
1.4
F
UTUREC
HALLENGESThe connection of OWPPs through HVDC systems has been demonstrated but it is not a mature technology yet. Offshore HVDC transmission systems have to ensure high reliability due to the long repair time and high cost of offshore maintenance. More complex topologies based on offshore interconnections between OWPPs improve reliability, but increase the cost of the offshore transmission system. The design of the offshore transmission system can be optimised if OWPP and transmission system owners are coordinated [17]. At first, point-to-point HVDC links will be built and at later stages offshore cable connections may be installed between existing OWPPs if it is financially viable. In addition, power flow control and protection strategies are important challenges in interconnected offshore systems, especially for HVDC grids [7].
In future, a large number of synchronous generators are expected to be replaced by asynchronous renewable generation, such as HVDC-connected OWPPs. Therefore, OWPPs must provide ancillary services to onshore grids. A number of these services can be provided by the onshore HVDC converter, e.g. voltage support, but other services have to be provided by the Wind Turbines (WTs) and require coordination between HVDC converters and OWPPs, e.g. frequency response. The European Union
systems that was developed by the European Network of Transmission System Operators for Electricity (ENTSOE) [18]. However, a number of requirements, such as inertia response, short-circuit contribution or power oscillation damping, are still under consideration.
Offshore ac and dc grids are isolated systems with high penetration of converters. Poorly damped resonances of an offshore grid can interact with the converter controls until the system becomes unstable. Such resonance interactions caused by WT converters and HVDC converters must be identified during the design process and can be limited by introducing additional damping to the system [19].
1.5
O
BJECTIVES OF THET
HESISThe research work carried out in this thesis contributes to solve the future challenges for HVDC-connected OWPPs. The aims of this thesis are to investigate interconnection topologies and analyse the operation and stability of OWPPs connected through VSC-HVDC transmission systems. Particular objectives of this thesis include:
• Analyse the contribution of interlink cables between OWPPs to increase availability and reduce power losses of the transmission system.
• Compare wind turbine inertia emulation strategies to provide inertia response from OWPPs.
• Build a hardware-in-the-loop test rig to demonstrate inertia emulation from an OWPP connected through an HVDC point-to-point link.
• Identify instabilities caused by control interactions of VSCs with the resonances of the offshore ac grid. The impact of the offshore HVDC converter is analysed in detailed.
1.6
T
HESISO
UTLINEThe structure of this thesis is as follows:
Chapter 2 –HVDC-connected Offshore Wind Power Plants
This chapter reviews the current research areas for the development of HVDC-connected OWPPs. These research areas include the design of HVDC transmission
Chapter 1 Introduction
system topologies, control structures and functional requirements in an HVDC-connected OWPP.
Chapter 3 – Interlinks between HVDC-connected Offshore Wind Power Plants This chapter presents a comparative analysis of different topologies with interlink cables between OWPPs. Reduction of power losses and increase of wind energy availability were quantified and discussed in different interlink options. The power losses were analysed using an optimal power flow and the availability was analysed using Capacity Outage Probability Tables (COPTs). Also, a cost-benefit analysis was used to compare the interlink options in terms of operational savings and a design procedure was developed to determine the interlink cable capacity.
Chapter 4 – Inertia Emulation in Offshore Wind Power Plants
This chapter presents the concept and the current developments of inertia emulation in OWPPs. Two main strategies were compared: Synthetic Inertia and Temporary Overproduction. Also, control strategies to limit wind turbine recovery power were described. The implementation of inertia emulation in an HVDC-connected OWPP was demonstrated using a hardware-in-the-loop set-up based on a wind turbine test rig, a VSC test rig, a dc network cabinet, a grid simulator and a real time simulator. Chapter 5 – Electrical Resonance Stability in HVDC-connected Offshore Wind Power Plants
This chapter analyses the interaction of converter controls with harmonic series resonances of the offshore ac grid. An impedance-based representation of the offshore ac grid and the VSCs was used to identify resonant frequencies and assess stability. A reformulation of the positive-net-damping stability criterion was demonstrated and used to evaluate the effect that the offshore HVDC converter control and the OWPP configuration have on the stability.
Chapter 6 – Conclusions
This chapter outlines the conclusions and contributions of this thesis and describes recommendations for further work.
Chapter 2
2.
HVDC-connected Offshore Wind Power
Plants
2.1
I
NTRODUCTIONThe connection of OWPPs through VSC-HVDC links has been demonstrated in real projects but there are still technical challenges that must be addressed, such as the optimal configuration of the transmission system, the control coordination and the provision of ancillary services [11], [20]. The potential topologies to connect an OWPP through an HVDC transmission system are described and discussed. The control of the OWPP and the HVDC converters is presented and the potential control interactions between the converters are highlighted. Also, the functional requirements of the overall system and the onshore and offshore grids are described.
2.2
G
ENERALC
ONFIGURATION OF ANHVDC-
CONNECTEDO
FFSHOREW
INDP
OWERP
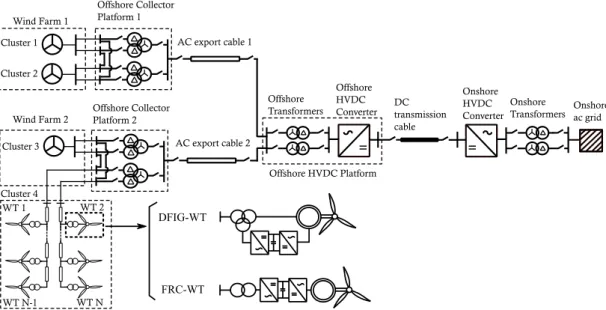
LANTFigure 2.1 shows the general configuration of an OWPP connected through an HVDC point-to-point link, where the basic components are indicated. In offshore applications, WTs are based on Doubly-Fed Induction Generators (DFIGs) or generators with Fully Rated Converters (FRCs) [21]. High-power WTs (from 5 MW) use FRCs with Permanent Magnet Synchronous Generators (PMSG) due to their high reliability and efficiency [22]. Offshore WTs generate power at low ac, which is stepped-up with a transformer to a medium ac voltage (33 - 66 kV [20]) collector grid. The most common collector system design consists in a radial grid, where the WTs are connected to different feeders or strings as shown in Figure 2.1 [23]. The wind farms are connected to offshore collector platforms, where transformers step-up the voltage to HVAC (132 – 220 kV [20]). The collector platforms transfer the power to offshore HVDC converters through ac export cables. The offshore HVDC converters operate as rectifiers and deliver the power to the onshore HVDC substation though HVDC transmission cables (up to ±525 kV [24]). The onshore HVDC converters operate as
Chapter 2 HVDC-connected Offshore Wind Power Plants
inverters and inject the power to the onshore grid. The early HVDC converters for offshore wind integration were based on 2-level topologies, but current designs use Modular Multilevel Converter (MMC) topologies to reduce the harmonic emission and minimise or eliminate the use of passive filters [11], [23]. Symmetrical monopoles are assumed for each sending end of the HVDC transmission system since this is the arrangement used in the current projects shown in Table 1.1.
Figure 2.1: General configuration of an OWPP with two wind farms connected through an HVDC point-to-point link.
2.3
HVDC
T
RANSMISSIONS
YSTEMC
ONFIGURATIONSThe factors used to choose a transmission system topology for OWPPs are discussed and a number of HVDC transmission options are described.
2.3.1
Selection of transmission system configurations
The main objective of the transmission system is to maximise the wind power transfer, which is achieved by reducing the total power losses and energy not supplied [8], [25], [26]. However, a complete evaluation must include an economic assessment and consider regulatory and geographical limitations [17], [27].
Although the components of the transmission system are designed to have minimum power losses, optimal operation of the OWPPs can further reduce the total losses. Even a 0.1% loss reduction of the nominal wind power transfer could represent
the power and voltage set-points of the HVDC converters and the WT converters [29]– [31].
Traditionally, transmission systems were designed on a basis of N-1 or N-2 redundancy, i.e. in case of loss of one (N-1) or two assets (N-2), the rest of the system must maintain operation. However, in offshore systems this is not the case due to the high cost of redundant components. As an alternative, two approaches are proposed in [20]:
• The economic value of energy not supplied is compared to costs. For example, the increase of transmission capacity reduces the wind power curtailment, but the initial investment is higher [32]. Therefore, a trade-off between cost of the assets and wind power curtailment defines the optimal transmission capacity.
• A minimum availability of the transmission system is set by the consumer or a governmental institution. For example, in the UK the Offshore Transmission Owners (OFTOs) will be penalised if the availability is less than 98% [33].
An economic assessment based on a cost-benefit analysis is used to select the best transmission system configuration. The costs of the transmission system include the initial investment of the assets and the operation and maintenance costs. The income is mainly from the wind energy generation, but the provision of ancillary services may be rewarded depending on the system operator regulations. Also, the energy savings from the reduction of power losses and power curtailment can be used to compare transmission topologies [8], [25], [26].
The operation and design of the transmission system can be constrained by system operator regulations, e.g. in Germany, TenneT requires the grid connection point of OWPPs to be at 155 kV with a continuous operating range between 140-170 kV [34]. If OWPPs are connected to two or more countries, the selection and design of the transmission topology will be more complex due to different regulation requirements and potential incompatibilities between countries [35]. Also, geographical constraints should be considered, such as location of OWPPs, onshore connection and cable routes [27].
Chapter 2 HVDC-connected Offshore Wind Power Plants
Existing HVDC-connected OWPPs are based on point-to-point links, but more complex configurations have additional advantages in terms of power losses reduction and increase of energy availability.
2.3.2
Point-to-Point systems
OWPPs can be connected using HVDC point-to-point links. This is the simplest option with the lowest cost. Figure 2.2 shows an example of an OWPP connected through an HVDC point-to-point system.
Figure 2.2: OWPP connected through a Point-to-point system.
In case of a dc fault, dc breakers are not necessary, since ac breakers at each HVDC converter terminal are used to isolate the dc system. The main disadvantage of this topology is that an outage in the transmission system will cause the power loss of the entire OWPP, because it is assumed that the configuration is based on symmetrical monopoles. All the existing HVDC-connected OWPPs are based on point-to-point configurations [16].
2.3.3
Offshore ac interconnections
OWPPs can be interconnected to form an offshore ac grid that delivers wind power to the onshore grid through different dc links. Figure 2.3 shows an example of three OWPPs with two possible ac grid topologies: multi-infeed connection, where the OWPPs are connected to a common ac bus, or meshed ac grid, where the OWPPs are interconnected with ac cables.
(b) Meshed ac grid
Figure 2.3: OWPP connected through an offshore ac grid.
Offshore ac interconnections will increase the availability of the wind power transfer. This is because in case of outage in one of the components, e.g. dc transmission cables, ac export cables or HVDC converters, the wind power generation can be exported through the remaining cables or converters. In addition, ac interconnections allow the active power to be shared among the dc links, which can be used to reduce the power losses of the offshore transmission system. Another advantage is that ac breakers can be used to isolate the dc links in case of dc fault, as in the point-to-point configuration. This option has been presented as the Supernode Concept to build part of the future European Supergrid and it has been proposed by National Grid as the integrated strategy to connect the incoming long-distance OWPPs to Great Britain’s grid [36], [37].
2.3.4
Offshore dc interconnections
As alternative, OWPPs can be interconnected with dc cables to form an offshore dc grid. Figure 2.4 shows an example of three OWPPs with two possible offshore dc grid topologies: multi-terminal dc grid (MTDC) and meshed dc grid.
Chapter 2 HVDC-connected Offshore Wind Power Plants
(b) Meshed dc grid
Figure 2.4: OWPP connected through an offshore dc grid.
Offshore dc interconnections offer the same advantages as the ac interconnections in terms of increasing availability and active power sharing. Meshed dc grids have additional redundancy compared to MTDC grids and they may provide N-1 contingency. However, the total cost of a meshed dc grid is higher due to additional dc cables that increase redundancy. An offshore dc grid requires dc circuit breakers to isolate the dc cables in case of dc fault or HVDC converter outage. DC circuit breakers are not commercially available, which limits the development of an offshore dc grid. AC breakers can be used, but the entire offshore dc grid has to be out of operation after a dc fault [38]. Also, other options based on HVDC converters with fault-blocking capability can be considered as alternative to the dc breakers [39]. Currently only two MTDC grids are in operation: Zhoushan Islands Interconnection and Nan’ao Wind Farm Integration [40], [41].
2.3.5
Future designs
In order to decrease the total cost of the offshore transmission system, alternative solutions have been proposed to reduce the size of the offshore HVDC platform or remove it completely. The offshore HVDC converter can be replaced by an diode rectifier, which reduces the converter dimensions and increases the robustness in offshore environments [42]. Other options are based on dc collector systems, where the ac export cables and the ac collector cables are replaced by dc cables. In these configurations, the offshore HVDC converter is replaced by an isolated dc-dc converter, which allows a smaller footprint of the offshore platform due to the use of
[44]. In this case, the WTs are connected to dc feeders at voltages around ± 60 kV through ac-dc converters. Then, the power is transferred directly to an onshore substation and transformed back to ac voltage through small dc-ac converters connected to each dc feeder or through a large converter in bipolar configuration if the dc feeders are clustered in two groups.
2.4
C
ONTROL OFHVDC-
CONNECTEDW
INDP
OWERP
LANTS2.4.1
General control scheme
Figure 2.5 shows the general control scheme of a HVDC-connected OWPP [11]. The main control blocks are: Grid Side Converter (GSC) control, Wind Farm Converter (WFC) control, Wind Power Plant (WPP) control and WT control. The details of the HVDC converter controls and the WPP control are presented in this section, whereas the WT control is described in Chapter 4 and Appendix C.
Figure 2.5: General control scheme of a HVDC-connected OWPP
The WFC generates the offshore ac voltage for the WTs, transfers the wind power to the HVDC transmission system and can supply reactive power to the export and collector cables. The GSC controls the dc voltage of the HVDC transmission system and transfers the wind power to the onshore ac grid. The WPP control is responsible for the active and reactive power dispatch of the WTs. The power references are sent from the WPP controller to each WT through communications channels. TSOs have communication with the GSC or the WPP control to request ancillary services for the onshore ac grid. Also, TSOs can request power reductions to the WPP controller for congestion management.
Chapter 2 HVDC-connected Offshore Wind Power Plants
The WTs provide ancillary services to the onshore grid if there is an artificial coupling between the onshore and offshore ac grids. Fast communication between the GSC and the WFC or WPP controller can be used to transfer the variations of onshore frequency and ac voltage to the WTs [45]. Alternatively, artificial coupling can be achieved without fast communication between VSCs [46]. In this case, GSC transfers the variation of onshore frequency or ac voltage as a dc voltage, which is used as a communication signal that is measured by the WFC.
2.4.2
Wind Power Plant Control
The WPP control is a centralised controller that defines the active and reactive power scheduling of the WTs based on measurements from the Grid Connection Point (GCP) of the OWPP, the available wind power and the requirements from the TSOs. Figure 2.6 shows an example of the WPP control structure proposed by the Technical University of Denmark (DTU) [47].
Figure 2.6: WPP control based on [47].
The WPP has a number of control functions that can be activated manually by the TSO or automatically by using measurements at the GCP. According to [47] there are two types of control functions: standard control functions and additional control functions. The standard control functions are services required by TSOs and include active power control, frequency response, reactive power and voltage control. The additional control functions are services expected to be implemented in WPPs and include inertia response, power system damping and synchronising power. Fault Ride Through (FRT) is not included as control function because it is implemented at WT level [47]. The WPP control functions have to be coordinated with the operation of the HVDC transmission system, as explained more in detail in Section 2.5.
The standard control functions provide active and reactive power set-points, 𝑃𝑠𝑒𝑡𝑊𝑃𝑃
and 𝑄𝑠𝑒𝑡𝑊𝑃𝑃, that are regulated by a PI controller using power measurements at the GCP,
𝑃𝑚𝑒𝑠𝐺𝐶𝑃 and 𝑄
𝑚𝑒𝑠𝐺𝐶𝑃. The power references from the additional control functions, ∆𝑃𝑟𝑒𝑓𝑊𝑃𝑃
and ∆𝑄𝑟𝑒𝑓𝑊𝑃𝑃, are included as feed-forward components after the PI controller outputs,
𝑃𝑟𝑒𝑓0𝑊𝑃𝑃 and 𝑄𝑟𝑒𝑓0𝑊𝑃𝑃 [47]. The PI controller is designed to have a response much slower than the WT control. This allows the additional control functions to operate simultaneously with the standard functions without interaction. The WPP dispatch receives the total active and reactive power references, 𝑃𝑟𝑒𝑓𝑊𝑃𝑃 and 𝑄𝑟𝑒𝑓𝑊𝑃𝑃, and sends power references to the WTs, 𝑃𝑟𝑒𝑓,𝑖𝑊𝑇 , according to the available wind power generation of each WT, 𝑃𝑎𝑣,𝑖𝑊𝑇.
2.4.3
Grid Side HVDC Converter Control
Figure 2.7 shows the general control scheme of a GSC. This VSC is controlled using a vector control strategy, where the d-axis regulates dc voltage or active power and the q-axis controls reactive power or ac voltage. The outer loops use PI controllers to compute the ac current references, 𝑖𝑑∗ and 𝑖𝑞∗, which are fed to the inner loop, as
illustrated in Figure 2.7. Also, a Phase Locked Loop (PLL) tracks the phase of the onshore ac voltage, which is used in the vector control to obtain the dq components.
In an offshore dc grid with several HVDC converters, the GSCs are coordinated using two main options: master-slave control or distributed dc voltage control [48]. In master-slave control, one of the GSCs regulates the dc voltage (master converter) and the others regulate active power (slave converters). The outage of the master converter can cause a blackout in the dc grid, unless another converter takes over the dc voltage regulation. In distributed dc voltage control, a number of GSCs regulate dc voltage and share the active power transfer using a droop control of active power – dc voltage, which is enabled when 𝑘𝑝𝑣 or 𝑘𝑣𝑝 are non-zero in Figure 2.7. In case of multiple
GSCs connected to an onshore ac grid, reactive power and ac voltage regulation can be coordinated with a droop control of reactive power – ac voltage, which is enabled when 𝑘𝑞𝑣 or 𝑘𝑣𝑞 are non-zero in Figure 2.7.
Chapter 2 HVDC-connected Offshore Wind Power Plants
Figure 2.7: Control scheme for GSCs using vector control
2.4.4
Wind Farm HVDC Converter Control
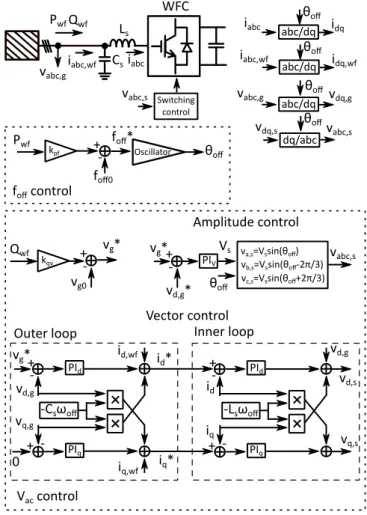
Figure 2.8 shows the general control scheme of a WFC. This VSC controls the voltage and frequency of the offshore ac grid. The voltage control can be implemented with an amplitude control or a vector control based on an outer voltage loop and an inner current loop, as illustrated in Figure 2.8 [49]–[52]. If the WFC is an MMC, the high frequency filter (represented as the capacitor 𝐶𝑠 in Figure 2.8) is not necessary
and only an outer voltage loop can be used in the vector control [53]. The frequency and phase of the offshore grid are generated by an oscillator.
In case of multiple WFCs connected to an offshore ac grid, the ac voltage control can be coordinated by the converters using a reactive power – ac voltage droop control, which is enabled when 𝑘𝑝𝑓 is non-zero [50]. Also, the active power can be shared between the converters using a droop control of active power – frequency, which is enabled when 𝑘𝑞𝑣 is non-zero [50], [54].
Figure 2.8: Control scheme for WFCs using amplitude control or vector control.
2.4.5
Converter Control Interactions
The large number of converters in HVDC-connected OWPPs can cause operational problems due to converter control interactions. OWPPs can become unstable if poorly damped resonances of the offshore ac or dc system interact with the converters. In [55] grid resonances are classified in two main categories: harmonic resonances and near-synchronous resonances.
Harmonic resonances are in the range from hundreds of Hz to few kHz. They are caused by the interaction of electrical resonances with the switching control and the inner current or voltage loop control of the VSCs. In HVDC-connected OWPPs electrical resonances originate from the inductive and capacitive characteristic of cables, transformers and filters of the offshore system [11], [19], [20]. Harmonic instabilities will occur in OWPPs if resonances are excited by the harmonic emission of the converters or during specific operations, such as the offshore grid energisation
Chapter 2 HVDC-connected Offshore Wind Power Plants
or switching operations in the offshore system due to unexpected or planned outages [20], [56].
Near-synchronous resonances are in the range from frequencies below the synchronous frequency f0 (subsynchronous resonances [57]) to values close to 2 f0.
(supersynchronous resonances). They are caused by the interaction of mechanical or electrical resonances with the inner loop control or the outer loop controls of the VSCs, i.e. active power control, dc voltage control, reactive power control, ac voltage control and PLL [51], [58], [59]. In HVDC-connected OWPPs mechanical interactions are only possible with WTs based on DFIG, because the stator is directly connected to the offshore ac grid [60].
2.5
F
UNCTIONALR
EQUIREMENTSThe functional requirements of an HVDC-connected OWPP can be classified according to Table 2.1.
Table 2.1: Functional requirements in HVDC-connected OWPPs
Function Onshore ac grid Offshore ac grid Overall system
Active Power Management x
Reactive Power and
Voltage Support x x
Frequency Support x Inertia Response x
Fault Ride Through x x
Short Circuit Current
Contribution x x
Power Oscillation
Damping x
The onshore control functions are related to grid code requirements of the onshore grid. The requirements defined for WPPs, dc-connected systems and offshore-connected systems are also applied for HVDC-offshore-connected OWPPs. These control
Offshore ac grids connected through HVDC systems are islanded grids with a large number of power converters, which may define different requirements compared to the onshore grids. The offshore control functions are provided by WFCs and WTs. Currently, there are not grid codes for HVDC-connected offshore ac grids and it is assumed that the WTs connected to these islanded systems will follow the grid code requirements of ac-connected OWPPs [20].
2.5.1
Active power management
In low-medium wind speeds the OWPP extracts maximum power based on Maximum Power Point Tracking (MPPT) control at each WT and in high wind speeds the OWPP generates the nominal power. The WPP control reduces the active power and limits the rate of change of power when is required by the TSOs. Figure 2.9 illustrates the active power control functions. The wind power can be curtailed to have power reserve for congestion management or frequency response [47]. The power curtailment is achieved with balance control, which is a constant reduction of active power, or delta control (also known as power spinning reserve), which is an active power reduction proportional to the wind generation. In addition, a power ramp rate control is included to limit the increase or decrease of active power.
(a) Balance control (b) Delta control (c) Power ramp rate control
Figure 2.9: Active power control functions of OWPP.
2.5.2
Reactive Power Control and Voltage support
In the onshore ac grid, GSCs provide reactive power and ac voltage support based on grid code requirements at the onshore point of connection. The HVDC converter can operate in three different control modes: reactive power control, ac voltage control or power factor control. In Europe, ENTSOE has defined general requirements for dc-connected power park modules in relation to [18]:
Chapter 2 HVDC-connected Offshore Wind Power Plants
• The maximum period of time that the converters must operate in different voltage ranges.
• The reactive power capability as a V - Q/Pmax profile that determines the
operational boundaries of the converter as shown in Figure 2.10. • The voltage transient response.
Figure 2.10: ENTSOE requirements for voltage at the grid connection point of a dc-connected system [18]. Voltage operational boundaries are function of Q/Pmax, where Pmax is the
maximum active power transmission capacity. The outer envelope represents the maximum values fixed by ENTSOE. The inner envelope is defined by each system operator and it does not have to be a rectangle.
Also, a number of European system operators have more specific regulations. For example, Figure 2.11 shows the reactive power capacity diagram required by National Grid in Great Britain and Figure 2.12 shows the power factor diagram required by TenneT in Germany and National Grid.
Figure 2.11: National Grid (Great Britain) requirements for reactive power capacity at the interface connection point of a WPP or a DC-connected system [61]. The Q values are
Figure 2.12: Voltage limits as function of power factor required by National Grid (Great Britain) in WPPs or DC-connected systems and TenneT (Germany) in offshore-connected systems [34], [61]. TenneT defines the nominal voltage at the onshore connection point in 155 kV. National Grid has different voltage levels (380, 220, 110 and 33 kV), but only high voltage is considered for OWPPs.
In the offshore ac grid, the voltage is regulated by the WFCs. The WTs can be set to control reactive power, ac voltage or power factor. The minimum requirements in the offshore ac grid are to keep the ac voltage within safe limits and to compensate the reactive power of the medium voltage collector cables and the high voltage export cables. Passive reactive compensators can be installed on the offshore platforms or WTs at the expense of increasing the total installation costs. Also, WFCs and WT grid-side converters can supply reactive power to the offshore ac grid. If all converters supply reactive power, an optimal power flow can be defined to minimise power losses or to reduce the size or number of passive compensation components [29], [49].
Grid codes define requirements for ac-connected OWPPs at the connection point of the offshore ac grid. For example, TenneT defines the PQ-diagram shown in Figure 2.13 for each WT. National Grid does not define specific requirements for each WT, but the reactive power transfer at the offshore grid entry point of OWPPs must be zero.
Figure 2.13: TenneT (Germany) requirements for reactive power capacity supplied by a generator unit at the grid connection point [34].
Chapter 2 HVDC-connected Offshore Wind Power Plants
In addition,a number of system operators require WTs to provide voltage control during fault conditions. For example, TenneT defines a reactive power – ac voltage droop characteristic, as shown in Figure 2.14. Also, the reactive power injection from each WT has to be coordinated to prevent ac overvoltage at the terminals located far from the fault [49].
Figure 2.14: Voltage support during ac fault required by TenneT (Germany) in generating units [34].
2.5.3
Frequency Support
OWPPs can provide frequency response to the onshore grid as conventional synchronous generators. In case of overfrequency events, WTs reduce the active power output using pitch angle control [62]. If WTs are required to respond to underfrequency events, they must operate in deloaded mode, i.e. below maximum power extraction, during normal operation to ensure a power reserve margin. The deloading operation of the WTs is achieved by rotor speed control or pitch angle control [63].
Frequency response can be activated manually by TSOs as a temporary variation of active power, i.e. based on balance or delta control. Also, the WTs can respond automatically if they have information about the onshore frequency. This response can be a temporary variation of active power or a droop control that exchanges additional active power according to the onshore frequency variation.
OWPPs connected through HVDC links are decoupled from onshore frequency variations. HVDC converters and the WPP control can be coordinated to transfer the onshore frequency information to the WTs and activate the frequency response. Such frequency coupling between onshore and offshore ac grids can be implemented with fast communications between the VSCs or using the voltage of the HVDC system as
Figure 2.15: Frequency response characteristic required by EirGrid (Ireland) in WPPs [65]. Points A-E are defined depending on system conditions and location of the OWPP. Deadband frequency range is between B and C.
Figure 2.16: Frequency response characteristic required by TenneT (Germany) in offshore-connected systems [34]. The power reduction depends on the current available power, PM.
Figure 2.17: ENTSOE requirements for frequency response in DC-connected systems [18]. A Frequency Sensitive Mode (FSM) is defined for under and overfrequency events, whereas a Limited Frequency Sensitive Mode (LFSM) can be defined for a frequency trend or both. The droop gains s1 – s4 are at least 0.1%, the maximum deadband is ±500 mHz and the maximum
insensitivity is 30 mHz. The LFSM is activated for frequency variations higher than 200 mHz.
Grid codes include requirements that define a droop control characteristic and the minimum response times [64]. As example, Figure 2.15 shows the response for under and overfrequency events required by EirGrid in Ireland. A number of system
Chapter 2 HVDC-connected Offshore Wind Power Plants
operators only require response for overfrequency events, e.g. TenneT as shown in Figure 2.16. Also, ENTSOE defines the maximum period of time that the converters must operate in different frequency ranges and provides a range of values for parameters of the droop control, as described in Figure 2.17 [18].
2.5.4
Inertia Response
Inertia response is a fast frequency response service to limit the frequency variation and the Rate of Change of Frequency (RoCoF) of the onshore ac grid during the first seconds after a power imbalance. This service is activated automatically when the onshore frequency or RoCoF exceed a predefined threshold. OWPPs can provide inertia response through inertia emulation or operating in deloaded mode. Inertia emulation consists on using the kinetic energy stored in WT rotating mass to provide additional power to the onshore grid. Electrostatic energy from dc link capacitors of the HVDC system can be also used to emulate inertia [66]–[70]. The time response to release the energy from dc capacitors is faster than the WT rotating mass. However, the energy extracted from dc capacitors is limited unless large capacitors are utilised [66], [71]. Also, the dc choppers of the HVDC system can be used to absorb power during overfrequency events [72].
The grid codes are starting to introduce inertia response requirements for WPPs. System operators in Canada and Brazil have defined requirements as inertia emulation [73]–[75]. Also, inertia response has been proposed by a number of system operators as a short-term increase of active power. As example, National Grid has introduced a new service called Enhanced Frequency Response to provide support from solar PV, battery storage and WPPs [76], [77]. ENTSOE defines inertia response from dc-connected systems, but the specific requirements have to be agreed between a relevant TSO and the HVDC system owner [18].
2.5.5
Fault Ride Through Capability and DC Overvoltage
HVDC-connected OWPPs are required to have FRT capability, i.e. they have to remain connected to the onshore or offshore ac grid during temporary ac faults. The grid codes define a voltage-against-time characteristic that represents the minimum voltage that the VSCs have to withstand without disconnection.
power plants, where the voltage and time parameters are defined as a range of values at the grid connection point of the GSCs. Also, ENTSOE defines additional requirements, e.g. in case of asymmetrical faults or in relation to the post fault active power recovery [18].
Figure 2.18: FRT profile required by ENTSOE at the grid connection point of HVDC-connected power plants [18]. 𝑈𝑟𝑒𝑡is the retained voltage during an ac fault, 𝑡𝑐𝑙𝑒𝑎𝑟 is the fault
duration and (𝑈𝑟𝑒𝑐1, 𝑡𝑟𝑒𝑐1) and (𝑈𝑟𝑒𝑐2, 𝑡𝑟𝑒𝑐2) are limits defined during the fault recovery.
During an onshore ac fault the GSC power capacity is reduced, which will cause a power imbalance in the offshore transmission system if the wind power generation cannot be transferred to the onshore grid. As a consequence, there will be an overvoltage in the dc system. In case of offshore grid topologies with multiple GSCs, the wind power excess can be transferred through the other GSCs if they have available power capacity.
The dc overvoltage can be limited by using dc choppers in the HVDC system that absorb the power excess during an ac fault [78]–[80]. DC choppers are robust, fast and do not affect the OWPP operation. However, the use of a resistor with chopper circuit will have an additional cost and require space in the converter stations. This solution is currently used in existing HVDC-connected OWPPs [81]. In addition, the dc overvoltage can be prevented by reducing the wind power generation [80], [82], [83]. The GSCs connected to the faulty onshore grid and the OWPPs have to be coordinated, since the HVDC system decouples the offshore and onshore ac grids. Fast communications can be used to rapidly deload the WTs, but inherent delays or loss of communication may compromise the effectiveness of this option [83]. As alternative, local measurements of the WTs can be used to activate the power reduction. In this case, the WFCs reduce the ac voltage or increase the frequency of the offshore ac grid according to the dc overvoltage magnitude and this is used as an intermediate signal that is measured by the WTs [80], [82].
![Figure 1.1: Global wind power capacity and annual additions from 2005 to 2015 [1].](https://thumb-us.123doks.com/thumbv2/123dok_us/10181432.2920573/21.892.182.781.556.769/figure-global-wind-power-capacity-annual-additions.webp)
![Figure 1.2: Cumulative and annual offshore wind installations in Europe from 1993 to 2015 [6]](https://thumb-us.123doks.com/thumbv2/123dok_us/10181432.2920573/22.892.168.794.101.322/figure-cumulative-annual-offshore-wind-installations-europe.webp)
![Figure 1.3 Map of offshore wind farms in the North Sea connected to Germany [16] .](https://thumb-us.123doks.com/thumbv2/123dok_us/10181432.2920573/23.892.174.778.489.932/figure-map-offshore-wind-farms-north-connected-germany.webp)
![Figure 2.5 shows the general control scheme of a HVDC-connected OWPP [11].](https://thumb-us.123doks.com/thumbv2/123dok_us/10181432.2920573/33.892.165.789.543.757/figure-shows-general-control-scheme-hvdc-connected-owpp.webp)
![Figure 2.6 shows an example of the WPP control structure proposed by the Technical University of Denmark (DTU) [47]](https://thumb-us.123doks.com/thumbv2/123dok_us/10181432.2920573/34.892.165.790.540.730/figure-example-control-structure-proposed-technical-university-denmark.webp)
![Figure 2.16: Frequency response characteristic required by TenneT (Germany) in offshore- offshore-connected systems [34]](https://thumb-us.123doks.com/thumbv2/123dok_us/10181432.2920573/43.892.313.663.105.849/frequency-response-characteristic-required-germany-offshore-offshore-connected.webp)