Transportation Research Procedia 14 ( 2016 ) 2015 – 2024
2352-1465 © 2016 The Authors. Published by Elsevier B.V. This is an open access article under the CC BY-NC-ND license (http://creativecommons.org/licenses/by-nc-nd/4.0/).
Peer-review under responsibility of Road and Bridge Research Institute (IBDiM) doi: 10.1016/j.trpro.2016.05.169
ScienceDirect
6th Transport Research Arena April 18-21, 2016
Using low-cost smartphone sensor data for locating crash risk
spots in a road network
Claus Aichinger
a,*, Philippe Nitsche
a, Rainer Stütz
a, Marko Harnisch
aa
AIT Austrian Institute of Technology, Giefinggasse 2, 1210 Vienna, Austria
Abstract
This paper investigates the use of smartphones in vehicle fleets for identifying high-risk locations in a road network, before a crash may have happened. A novel method is proposed on how to use smartphone GPS and motion sensor data to automatically recognize critical car driving situations and near-misses such as emergency braking, evasion manoeuvres or sudden driving speed changes. In the area of Vienna, Austria, approximately 200 hours of driving data were collected with a dedicated smartphone app, from about 100 drivers covering more than 8,000 km. Additionally, various near-miss manoeuvres were measured on a closed test track under controlled conditions. In post-processing, this data was analysed in terms of driver-specific thresholds for critical driving situations. Results show that by using this modelling approach, critical situations can be accurately identified and geographically located with smartphones. An interface to traffic management would allow near-miss information to be used along accident data in the improvement of safety and efficiency of a traffic system. A combination of the proposed method with digital maps enables future applications for traffic and fleet managers, such as a “road safety hazard map”.
© 2016The Authors. Published by Elsevier B.V..
Peer-review under responsibility of Road and Bridge Research Institute (IBDiM). Keywords:Road safety; smartphone; near-miss recognition; driving manoeuvre; crash risk
* Corresponding author. Tel.: +43 664 2351877. E-mail address:[email protected]
© 2016 The Authors. Published by Elsevier B.V. This is an open access article under the CC BY-NC-ND license (http://creativecommons.org/licenses/by-nc-nd/4.0/).
1. Introduction
In everyday road traffic, collisions occur very rarely considering the amount of daily vehicles traveling on a road network. In fact, they only represent the tip of the iceberg in terms of safety-critical events, but still build the primary basis for road safety work and research. It is assumed that a significant number of collisions must occur in order to identify a road safety problem that must be solved.
However, there are countless situations where a collision and the subsequent injuries and damages are only marginally avoided, i.e. unreported near-misses, often referred to as “traffic conflicts” in Europe or “near crash” in the US. Detecting these conflicts can reveal possible high-risk road sections, whose potential danger can be mitigated or eliminated through optimized traffic management and appropriate road safety measures. The relationship between crashes and near-misses is complex and depends on contributory factors such as conflict/crash type, lighting conditions, weather, surface conditions, level of service etc. However, there is a strong frequency relationship between crash and near-crash, which means that near-crashes contain valuable information about crash risks and can serve as a surrogate (Guo et al., 2010). Furthermore, analysing near-misses can help to overcome the shortcomings of unreported or erroneously reported accidents, which can lead to biased conclusions on road safety measures.
Therefore, an effort was made to gain a better understanding of the nature of near-misses. Early studies presented several methods of how to identify and measure traffic conflicts (cf. Allen et al., 1978; Asmussen, 1984; Hydèn, 1987; Perkins and Harris, 1968; Spicer, 1973; Williams, 1981; Zegeer and Deen, 1978), primarily based on stationary visual observation of specific road sites, e.g. intersections. Traditional conflict techniques were then enhanced by using microscopic computer simulation models, which increased tremendously the possible number of conflict scenarios to be evaluated under varying infrastructure settings (Young et al., 2014). However, as for traditional techniques, which rely on the subjective judgement of the observer and collect data for only a few days, simulation-based methods also have disadvantages. Various assumptions have to be made to develop the simulation models, which may not always reflect real-life situations and normal driving behaviour (Archer, 2001).
With the advancements in video and sensor technology, conflict detection became more sophisticated and in-vehicle recordings were used as a supplement to stationary traffic observations. The combination of video with GPS and data from other in-vehicle instrumentation made it possible to evaluate traffic conflicts much more accurately and objectively. When naturalistic driving studies were established as a reliable method for driver behaviour analysis and road safety research, the large amount of real-world driving data allowed experts to draw conclusions from a different perspective. Compared to traditional crash database studies, naturalistic data provides unique information about the behaviour in everyday driving situations, including collisions and near-misses. Nevertheless, results from previous large-scale naturalistic studies have corroborated the fact that actual collisions are very unlikely. For example, in the 100-car study (Dingus et al., 2006), only 69 crashes were observed over a period of one year. This underlines the importance of near-miss detection, whose investigation does not only overcome the problem of small sample sizes, but also provides insight into risk factors similar to those of crashes.
There have been several approaches to recognize conflicts within naturalistic driving data without manually reviewing all video streams. A common approach is to analyse kinematic vehicle data (e.g. accelerations, yaw rate) to detect safety-critical events such as emergency brakings or sudden steering manoeuvres. A summary of those “event triggers” is given in the next section of this paper. However, it must be noted that not all conflicts can be detected by those triggers as 1) some situations are safety-critical, but do not necessarily show kinematic extremes and 2) kinematic patterns depend on various factors such as driver style, vehicle type, driving speed or road infrastructure. Furthermore, there is still the problem of false positives, as the triggers lack sufficient calibration.
The issue of road infrastructure leads to the main topic of this paper, namely the interplay between road design and driver behaviour. For road network operators, it is of major importance to know about high-risk locations, i.e. where a collision is more likely to occur. Furthermore, road planners can learn from the detection of such spots, as they may provide hints about safety gaps and needs for improvement. This paper postulates that accumulated near-misses at a certain spot indicate a high-risk location. Of course, no indication can be given for locations, for which hardly any or no near-miss information is available. The increased use of probe vehicle data (PVD) has been facilitating continuous driving data collection on a large-scale basis. PVD have been introduced as a further step of extended floating car data (xFCD, see Huber et al., 1999; Messelodi et al., 2009), generated by vehicles about their
current position, motion and timestamp. PVD also include additional data elements provided by vehicles that have added intelligence to detect traction information, brake status, airbag deployment status, windshield wiper status etc. The data may be generated by devices integrated with the vehicles’ computers, or by nomadic devices such as smartphones or on-board units.
This paper investigates the use of PVD collected by smartphones in vehicle fleets for identifying high-risk locations in a road network. A novel threshold-based model is proposed on how to use smartphone GPS and motion sensor data to automatically recognize critical car driving situations such as emergency brakings, evasion manoeuvres or sudden driving speed changes. The developed model combines the well-established euroFOT indicator (cf. Section 2) with a threshold based on quantile regression (QR). The resulting data driven model is both speed-dependent and driving-style-adaptive. In the context of this work, critical car driving situations are interpreted as near-misses and it is assumed that such situations can be identified by applying a suitable threshold. The issue of false positives is addressed by means of spatial clustering. An interface to traffic management would allow near-miss information to be used along accident data in the improvement of safety and efficiency of a traffic system.
This work is structured as follows: Section 2 summarizes common event triggers used for recognizing conflicts with kinematic vehicle data. The methodology of this work is then described in Section 3, dealing with data collection, processing and modelling. Section 4 presents the validation results of the proposed model and demonstrates the applicability by means of a digital “road safety hazard map”, before Section 5 concludes the paper with final remarks and an outlook on further research.
2. Background on near-miss recognition
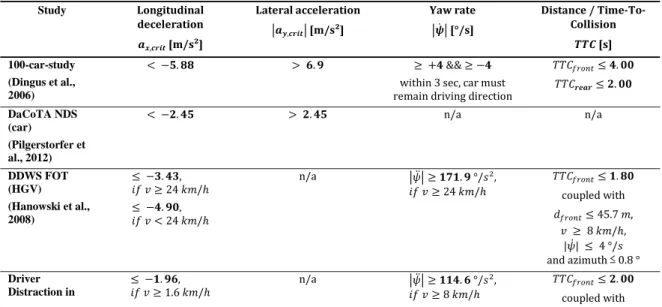
This section describes state-of-the-art methods for recognizing traffic conflicts based on kinematic data. Almost all past and ongoing naturalistic driving studies use GPS and vehicle sensor data alongside with video and eye-tracking data. Objective indicators or threshold values are typically applied to extract events of interest that can later be verified by manual video observation. According to Metz et al. (2013), those indicators can be categorized into 1) longitudinal, 2) lateral, 3) heading and 4) distance values. The first two can be measured by accelerometers, the third by gyroscopes and the latter by radar or other distance measurement devices. Hence, smartphones are not capable to measure distance to the front or other vehicles, although there have been approaches using image processing techniques (see Dagan et al., 2004; Stein et al., 2003). However, for this study, only longitudinal and lateral acceleration data were further analysed. Table 1 gives an overview about indicator values used in various driving studies. For better comparison, numbers from studies using g values have been converted to SI (m/s2).
Table 1. Literature synthesis for indicators of critical driving events.
Study Longitudinal deceleration ࢇ࢞,ࢉ࢚࢘ [m/s²] Lateral acceleration หࢇ࢟,ࢉ࢚࢘ห[m/s²] Yaw rate ห࣒ሶห [°/s] Distance / Time-To-Collision ࢀࢀ [s] 100-car-study (Dingus et al., 2006) < െ.ૡૡ > .ૢ + && െ
within 3 sec, car must remain driving direction
ܶܶܥ௧ . ܶܶܥ࢘ࢋࢇ࢘ . DaCoTA NDS (car) (Pilgerstorfer et al., 2012) < െ. > . n/a n/a DDWS FOT (HGV) (Hanowski et al., 2008) െ., ݂݅ݒ 24 ݇݉/݄ െ.ૢ, ݂݅ݒ< 24 ݇݉/݄ n/a ห߰ሷห ૠ.ૢ °/ݏଶ, ݂݅ݒ 24 ݇݉/݄ ܶܶܥ௧ .ૡ coupled with ݀௧45.7 ݉, ݒ 8 ݇݉/݄, |߰ሶ| 4 °/ݏ and azimuth ӊ 0.8 ° Driver Distraction in െ.ૢ, ݂݅ݒ 1.6 ݇݉/݄ n/a ห߰ሷห . °/ݏଶ, ݂݅ݒ 8 ݇݉/݄ ܶܶܥ௧ . coupled with
Commercial Vehicle Operations (HGV) (Olson et al., 2009) ݀௧76.2 ݉, ݒ 8 ݇݉/݄, |߰ሶ|6 °/ݏ and azimuth ӊ 0.12 ° Naturalistic Truck Driving Study (NTDS) (HGV) (Blanco et al., 2008) െ.ૢ, ݂݅ݒ 1.6 ݇݉/݄ n/a ห߰ሷห . °/ݏଶ, ݂݅ݒ 8݇݉/݄ ܶܶܥ௧ . coupled with ݀௧76.2 ݉, ݒ 8 ݇݉/݄, |߰ሶ|6 °/ݏ and azimuth ӊ 0.12 ° uDRIVE NDS (car+HGV)
െ.ૢ n/a n/a n/a
euroFOT (car) (Benmimoun et al., 2011) െ., if ݒ< 50 ݇݉/݄ (െ+)ڄ࢜ െ െ , ݂݅ 50 ݒ 150 ݇݉/݄ െ., if ݒ> 150 ݇݉/݄ (ૠ െ .)ڄ ࢜ +., ݂݅ݒ< 40 ݇݉/݄ >ૠ., ݂݅ 40 ݒ 50 ݇݉/݄ ( െ ૠ)ڄ࢜ െ +ૠ, ݂݅ 50 <ݒ 100 ݇݉/݄ >.,݂݅ݒ> 100 ݇݉/݄ >,݂݅ݒ< 40 ݇݉/݄ ( െ )ڄ࢜ െ +, ݂݅ 40 ݒ 50 ݇݉/݄ ( െ )ڄ࢜ െ +, ݂݅ 50 <ݒ 85 ݇݉/݄ >,݂݅ݒ> 85 ݇݉/݄ <.ૠ
Teen driver study (car)
(McGehee et al., 2007)
െ.ૢ . n/a n/a
The table shows that indicator values strongly vary. Thresholds for the longitudinal deceleration reach from -1.96 to -6.37 m/s², and those for the lateral acceleration vary between 2.45 and 7.35 m/s². It must be noted that in literature, the yaw rate (representing changes in heading) is often replaced by its derivative ߰ሷ called yaw acceleration.
Dingus et al. (2006) note that event detection based only on quantitative thresholds results in many false positives and require manual verification. Therefore, speed-dependent thresholds have been introduced, which should reduce false positives (e.g. Benmimoun et al., 2011; Mitschke, 2003). Metz et al. (2013) further suggested to automatically dividing a ride into distinctive manoeuvres to handle ‘situation variance’, i.e. varying driving behaviour according to the driving task and situation. Those manoeuvres could be accelerating, constant straight driving, turning or lane changing. It has also been reported that different driver types and styles must be considered, since driving experience, aggressiveness etc. lead to varying thresholds. This paper investigates such driver-specific thresholds as new approach for recognizing critical events. Instead of using in-vehicle sensor data (e.g. from the CAN bus), low-cost smartphone data is processed to develop an advanced indicator for traffic conflicts.
3. Methodology
This section is devoted to the developed methodology for detecting high-risk locations in a road network. In Subsection 3.1, a description of the investigated data sets as well as the measurement setup is given, followed by a few comments on data-annotation and post-processing in Subsection 3.2. The main concept and ideas regarding data analysis and modelling are presented in Subsection 3.3.
3.1. Data sets and data collection
In this work, three different data sets are considered. The first data set (I) was collected to evaluate the adequacy of smartphones for detecting critical driving events. To this end various near-miss manoeuvres were performed with a dedicated BMW X3 probe vehicle on a closed test track under controlled conditions. During these test runs, kinematic data was collected from the following measurement systems: 1) the probe vehicle’s internal CAN bus, 2) a solidly mounted iMAR IMU providing high precision GPS data and 3) a coupled smartphone system (Samsung Galaxy S2) where one smartphone provides video footage of the exterior and GPS data whereas the other one (mounted at the bottom of the passenger seat) provides acceleration data. The second data set (II) consists of probe vehicle data from previous driving studies (cf. Aleksa et al., 2014; Nitsche et al., 2014a) amounting to in total about 27 h from 24 different drivers driving under controlled real-world conditions in the area of Vienna. This data set served the purpose of providing an average driver profile by merging the individual data sets. The resulting data was used as a training set to fit a model which can then be tested against the first data set (I). Note that this average driver profile was created to avoid a possible bias by selecting a single individual. The methodology nevertheless provides a data based driver-specific threshold. The third data set (III) was collected in course of a different controlled real-world driving study (cf. Nitsche et al., 2014b) with a smartphone app comprising two smartphones as described in the first data set (I). The study took place in the area of Vienna and involved 97 drivers that had to complete a journey of about 43 km lasting approximately 70 minutes. In total, four different vehicles (Renault Fluence ZE, Renault Megane, Mitsubishi iMiev and Hyundai i10) were employed. Each participate had to complete two rounds, one with an electric and the one with a combustion engine vehicle. This data set was then analysed to identify possible near-miss situations.
3.2. Data annotation and post-processing
In order to reduce the noise present in the measured signals, the raw data is first down-sampled to 20 Hz. The probe vehicle data was synchronized using the GPS timestamp. To avoid possible miss-alignments, the data was additionally post-synchronized by means of the lateral acceleration guaranteeing that all data sources are properly aligned in time. The kinematic data was further filtered using a 0.5 second-wide centred median filter, which is well known to preserve edges and considered suitable for the purpose of this work. To remove unnecessary data collected during standstill, only data where the velocity is greater than zero is kept. The following thresholds were applied for data selection: CAN bus: 0.1 m/s, iMAR IMU: 0.1 m/s, Smartphone: 0.5 m/s. Due to this selection, the total amount of data varies between the three measurement systems.
The near-miss manoeuvres carried out on the test track were identified manually by means of a video annotation tool. This tool allows, while displaying both video and kinematic as well as GPS data, to accurately annotate driving situation. This additional meta-information about manoeuvres can then be used to validate the model output.
3.3. Data analysis and modelling
The overall procedure for identifying high-risk locations comprises the following two steps which are described in more detail below:
x Near-miss situations are detected by applying a driver-specific and speed-dependent threshold. This threshold is based on a combination of a quantile regression (QR) model and the euroFOT threshold and incorporates the amount of available information about the driver by means of a parametrized weight function.
x Potential high-risk locations are selected by applying a spatial clustering technique to the reported individual near-misses. Clustering the detected near misses is essential to reduce false positives, which are likely to be present (see Section 2). This way the information gathered from different drivers is aggregated and only locations are kept, where near-miss situations from several different drivers where recognized.
3.3.1. Driver-specific threshold:
For the detection of critical accelerations by driver- and speed-dependent thresholds, a quantile regression model is employed. This approach allows to directly model rare events in the data that might be related to or caused by a near-miss situation. QR can be viewed as an extension of classical least squares estimation of conditional mean models. It allows the approximation of the whole conditional distribution of a response variable. This can be achieved as follows: The mean or median of a univariate distribution can be considered as the centre of the distribution, which minimizes a certain loss function. For a generic random variable ܻthe (unconditional) mean and median are the solution of the minimization problems
ߤ=ܽݎ݃݉݅݊ܧ[(ܻ െ ܿ)ଶ] (quadratic loss), and (1)
݉=ܽݎ݃݉݅݊ܧ[|ܻ െ ܿ|] (absolute loss),
respectively. The ߠ-th quantile is the value ݕsuch that ܨ(ݕ) =ܲ(ܻ ݕ) =ߠ, where ܨdenotes the cumulative
distribution function. The quantile function is defined as the inverse ܳ(ߠ) =ܨିଵ(ߠ) = inf {ݕ|ܨ(ݕ) >ߠ}, where
ߠ א[0,1]. Quantiles can also be considered as certain centres of the distribution, minimizing a weighted absolute sum of deviations. The least absolute deviation criterion is given by
ݍఏ=ܽݎ݃݉݅݊ܧ[ߩఏ(ܻ െ ܿ)], (2)
where ߩఏ is the following (asymmetric absolute) loss function
ߩఏ= [(1െ ߠ)ܫ௬ஸ+ߠܫ௬வ]|ݕ| = [ߠ െ ܫ௬ழ]ݕ. (3)
Here, the weight (1െ ߠ)is used for negative deviations and a weight ߠis assigned to positive deviations. The ideas above can be easily generalized to a regression setting. The objective functions are just extended by the conditional mean ߤ(࢞,ࢼ) =ܧ[ܻ|ࢄ=࢞] and the quantile function ܳ(ߠ,ࢄ) =ܳ[ܻ|ࢄ=࢞]. For QR this results in
the minimization problem
ݍො(ߠ,ࢄ) =ܽݎ݃݉݅݊ொೊ(ఏ,ࢄ)ܧൣߩఏ൫ܻ െ ܳ(ߠ,ࢄ)൯൧.
(4)
The model for linear QR is ࢟=ࢄࢼ(ߠ) +ࣕ, whereࢄis the model matrix, ࢼ(ߠ)is the vector of unknown coefficients and ࣕthe vector of unknown errors. In this case the minimization problem simplifies to
ࢼ(ߠ) =ܽݎ݃݉݅݊ࢼܧ[ߩఏ(ܻ െ ࢄࢼ)]. (5)
It has been shown that this minimization criterion can be formulated as a linear programming problem, which can be solved using variants of the simplex algorithm. For further details it is referred to Koenker (2009) and Davino et al. (2014).
Since the euroFOT thresholds are defined by piecewise continuous functions, a flexible regression approach is required. Therefore, for both dependent variables, ܽ௫and ܽ௬, the relationship with the covariate ݒis modelled using
a basis of natural cubic B-splines for the model matrix ࢄ. Cubic splines with four degrees of freedom are sufficient to approximate the euroFOT thresholds (cf. Figure 2). While decreasing or increasing the degrees of freedom is subject to under- or overfitting, respectively. Natural splines enforce the constraint that the function is linear beyond the boundary knots mitigating erratic behaviour often encountered in the context of polynomial-regression. The parameter ߠis chosen as 0.999 for ܽ௬and 0.001 for ܽ௫in this study.
The QR model provides a threshold tailored to each driver. However, before it can be applied, two potential drawbacks have to be taken care of. Firstly, by definition, a certain quantile of the data will automatically be labelled as critical independent on whether a truly critical event occurred or not. The number of such events can be minimized by choosing a sufficiently large parameter ߠ. Nevertheless, for numerical reasons this parameter must not be chosen too close to 1 and hence a certain amount of false positives remain. Secondly, the QR model, being based
on available data, is unable to provide reliable estimates for speed ranges where not a sufficient amount of data can be provided.
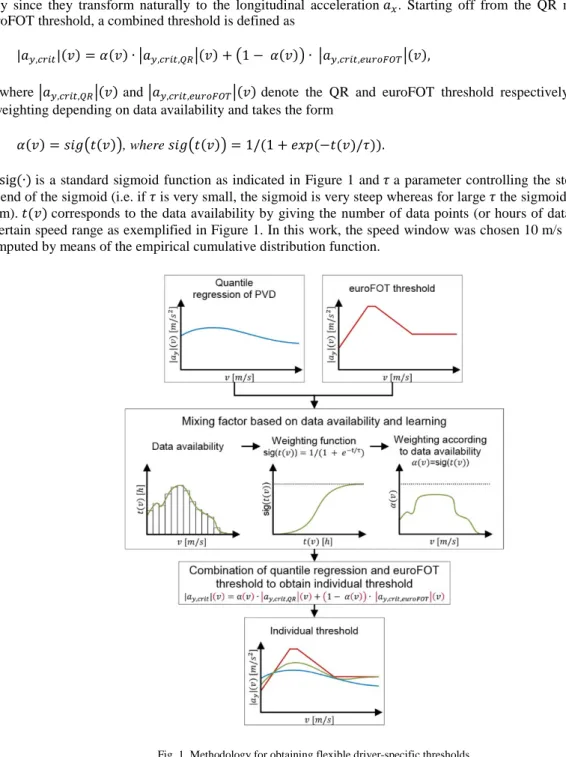
To remedy above mentioned difficulties, a combination with the well-established euroFOT threshold is derived in the way sketched in Figure 1. For sake of simplicity the following formulas are given for the lateral acceleration ܽ௬
only since they transform naturally to the longitudinal acceleration ܽ௫. Starting off from the QR model and the
euroFOT threshold, a combined threshold is defined as
|ܽ௬,௧|(ݒ) =ߙ(ݒ)ή หܽ௬,௧,ொோห(ݒ) +൫1െ ߙ(ݒ)൯ ή หܽ௬,௧,௨ிை்ห(ݒ), (6)
where หܽ௬,௧,ொோห(ݒ)and หܽ௬,௧,௨ிை்ห(ݒ)denote the QR and euroFOT threshold respectively. Ƚ(ݒ)effects
a weighting depending on data availability and takes the form
ߙ(ݒ) =ݏ݅݃൫ݐ(ݒ)൯, where ݏ݅݃൫ݐ(ݒ)൯= 1/(1 +݁ݔ (െݐ(ݒ)/߬)). (7) sig(ή)is a standard sigmoid function as indicated in Figure 1 and ߬a parameter controlling the steepness of the ascend of the sigmoid (i.e. if ߬is very small, the sigmoid is very steep whereas for large ߬the sigmoid takes a flatter form). ݐ(ݒ)corresponds to the data availability by giving the number of data points (or hours of data) available in a certain speed range as exemplified in Figure 1. In this work, the speed window was chosen 10 m/s wide and ݐ(ݒ) computed by means of the empirical cumulative distribution function.
By defining |ܽ௬,௧|(ݒ)as above, a threshold that closer to the QR model is obtained for speed ranges with
a large amount of data, whereas for speed ranges with little data the threshold resembles the euroFOT model. The tuning parameter ߬allows to adjust the weighting to put more emphasize on either of the models. For ߬= 0the QR model is recovered whereas ߬=λcorresponds to the euroFOT case.
3.3.2. Spatial clustering:
In order to average out false positives arising in course of the individual near-miss detection, spatial clustering is applied to the set of potential near-miss cases, which comprises all critical driving events from all drivers. Note that a critical driving event is characterized by an acceleration value surpassing a certain threshold, which usually corresponds to a small time interval during which the acceleration value is critical. From these time intervals, the relative extremum of the acceleration within a buffer of ±2 s is chosen to define the critical event.
In course of the clustering procedure, a minimum number of different participants is required in each cluster (by requiring a minimal cluster size) to ensure that only locations where indeed a sufficiently large number of different drivers exhibit peculiar driving behaviour contribute to the list of potential high-risk locations. The clustering procedure utilized in this work is a density based spatial clustering technique known as DBSCAN, which groups together closely packet points of data (see Ester et al. (1996) for further information). In doing so, GPS-points that lie closely together are grouped and form a cluster if the group consists of a minimal number of points. The choice of the algorithm is motivated by the fact that the number of clusters (i.e. number of potential high-risk locations) does not have to be set a priori but is determined on the fly. Furthermore, the requirement of a minimal cluster size is naturally taken care of. Points are considered closely-packed if they are reachable within a certain distance set by the user. Therefore, the essential parameters are directly interpretable and the algorithms robust nature makes it well suited for possibly noisy GPS-data.
4. Results
4.1. Adequacy of smartphone data
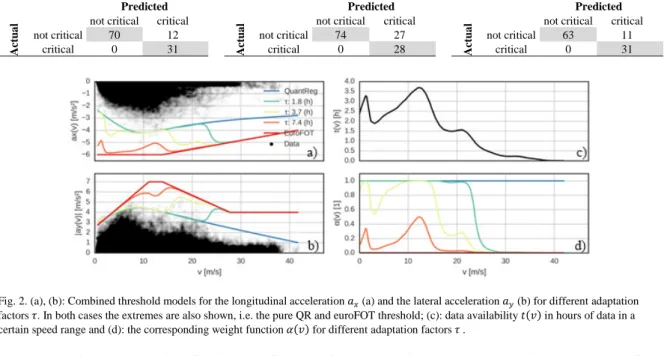
Table 2. Confusion matrices of predicted and actual critical driving events for all measurement systems. The different total number of events is caused by data related restrictions and not by the method applied (see Subsection 3.2).
CAN bus
Predicted
Ac
tua
l not critical critical not critical 70 12 critical 0 31 iMAR IMU Predicted Ac tua
l not critical critical not critical 74 27 critical 0 28 Smartphone Predicted Ac tua
l not critical critical not critical 63 11
critical 0 31
Fig. 2. (a), (b): Combined threshold models for the longitudinal acceleration ܽ௫(a) and the lateral acceleration ܽ௬(b) for different adaptation factors ߬. In both cases the extremes are also shown, i.e. the pure QR and euroFOT threshold; (c): data availability ݐ(ݒ)in hours of data in a certain speed range and (d): the corresponding weight function ߙ(ݒ)for different adaptation factors ߬.
The use of smartphone data for the identification of critical driving events was validated by means of the following procedure. First, driver specific threshold functions were computed from data set (II) (training data)
according to the methodology outlined above. Secondly, the resulting threshold functions were applied to the test data set (I) containing critical manoeuvres. This procedure was carried out for all three different data sources, i.e. the CAN bus, the iMAR IMU and the smartphone system to compare the number of correctly classified critical driving events (the true number being known from the video annotation tool as outlined in Subsection 3.2). The results are summarized in Table 2 in form of the obtained confusion matrices. It can be observed that all critical events could be identified using the smartphone system. The adaptation parameter ߬was chosen as a quarter of the total duration of the available data. Note the fair amount of false positives, highlighting the need for a further aggregation step.
Simply applying the euroFOT threshold results in very similar confusion matrices, indicating that the QR-based approach is at least as capable of identifying critical manoeuvres (cf. Figure 2). However, the driver-specific nature of the QR turns out to produce less critical events when applied to data set (III), thereby reducing the risk of falsely identifying sensible driving situations. In total, the euroFOT threshold highlights 52 longitudinal and 272 lateral events whereas the QR threshold indicates 63 longitudinal but only 200 lateral events.
For explanatory purposes, the models and weight functions resulting from the training data used in the above validation procedure are presented in Figure 2.
4.2. Identifying high-risk locations
To demonstrate the feasibility of the developed approach, it was applied to data set (III). It must be noted that since the prescribed course was 43 km long, a comparatively little amount of information about each driver and car was available. The driver-specific threshold based on the QR was incorporated by setting the adaptation parameter ߬= 1.75ήmax൫ݐ(ݒ)൯.
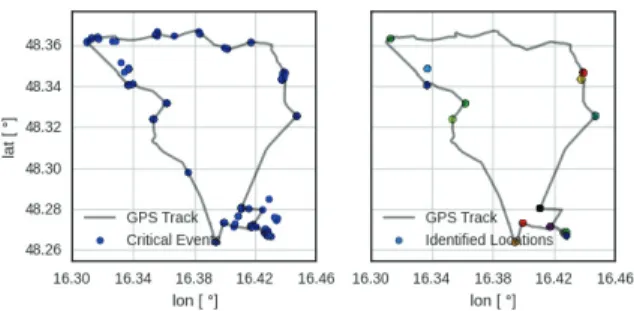
Although ߬should be chosen independently of the driver, due to the rather short observation time an individual parameter was set for each driver. Fig. 3 shows the raw set of identified critical manoeuvres (left) as well as the remaining locations after applying the spatial clustering (right). We observe a significant drop in the number of locations by requiring a minimal cluster size of 5, i.e. each spatial cluster must consist of at least five members (each representing a critical event from a different driver) The minimal cluster size is a tuning parameter and its value may increase with additional data available. The so obtained potential high-risk locations can be collected in a geographical information system and displayed on top of a digital map. Together with additional information about the observed driving events, these locations can then be assessed and screened by a road safety expert.
Fig. 3. Raw set of critical manoeuvres (left) and remaining locations after applying the spatial clustering (right). 5. Conclusions
In this paper, the use of low-cost smartphone data in vehicle fleets for identifying high-risk locations in a road network was investigated. The novel approach combines the well-established euroFOT threshold for critical driving situations with a speed-dependent driving-style-adaptive threshold able to reflect individual differences between drivers (and even vehicles). The weighting of the two thresholds is flexible in the sense that it allows to account for the amount of information available in certain speed ranges. Initially starting off with the euroFOT model over the entire speed range, driver-specific information is gradually added to the compound model as the knowledge base grows. Subsequent clustering of the detected near-misses reduces the number of false positives and provides geographically located potential high-risk locations for further assessment. Collecting and displaying sensible locations in a digital map enables road safety experts and traffic managers to systematically screen the road network for possible safety and efficiency improvements of the traffic system. Future work will focus on applying the presented method to a larger, long-term probe vehicle data set where the itinerary is arbitrary to investigate and further validate the developed model in the light of a real-world naturalistic driving study.
References
Aleksa, M., Aigner-Breuss, E., Aichinger, C., Hahn, M., Harnisch, M., Kaiser, S., Nitsche, P., Russwurm, K., Winkelbauer, M., 2014. ORTUNG - Objektive Beurteilung von Navigationssystemen mit Empfehlungen für den Gesetzesgeber (Forschungsarbeiten des österreichischen Verkehrssicherheitsfonds No. 037). Bundesministerium für Verkehr, Innovation und Technologie (bmvit), Vienna, Austria.
Aleksa, M., Aigner-Breuss, E., Aichinger, C., Hahn, M., Harnisch, M., Kaiser, S., Nitsche, P., Russwurm, K., Winkelbauer, M., 2014. ORTUNG - Objektive Beurteilung von Navigationssystemen mit Empfehlungen für den Gesetzesgeber (Forschungsarbeiten des österreichischen Verkehrssicherheitsfonds No. 037). Bundesministerium für Verkehr, Innovation und Technologie (bmvit), Vienna, Austria.
Allen, B.L., Shin, B.T., Cooper, P.J., 1978. Analysis of traffic conflicts and collisions. Transportation Research Record.
Archer, J., 2001. Traffic conflict technique - Historical to current State-of-the-Art. Institutionen för Infrastruktur KTH, Stockholm, Sweden. Asmussen, E., 1984. International Calibration Study of Traffic Conflict Techniques, in: Asmussen, E. (Ed.), International Calibration Study of
Traffic Conflict Techniques, NATO ASI Series. Springer Berlin Heidelberg, pp. 207–209.
Benmimoun, M., Fahrenkrog, F., Zlocki, A., Eckstein, L., 2011. Incident detection based on vehicle CAN-data within the large scale field operational test “euroFOT,” in: Proceedings of the 22nd International Technical Conference on the Enhanced Safety of Vehicles (ESV 2011). Washington, D.C.
Blanco, M., Hickman, J.S., Olson, R.L., Bocanegra, J.L., Hanowski, R.J., Nakata, A., Greening, M., Madison, P., Holbrook, G.T., Bowman, D., 2008. Investigating critical incidents, driver restart period, sleep quantity, and crash countermeasures in commercial vehicle operations using naturalistic data collection: Final report. Federal Motor Carrier Safety Administration, Washington, D.C.
Dagan, E., Mano, O., Stein, G.P., Shashua, A., 2004. Forward collision warning with a single camera, in: 2004 IEEE Intelligent Vehicles Symposium. Presented at the 2004 IEEE Intelligent Vehicles Symposium, pp. 37–42.
Davino, C., Furno, M., Vistocco, D., 2014. Quantile regression: theory and applications, 1. ed. ed, Wiley series in probability and statistics. Wiley, Chichester.
Dingus, T.A., Klauer, S.G., Neale, V.L., Petersen, A., Lee, S.E., Sudweeks, J., Perez, M.A., Hankey, J., Ramsey, D., Gupta, S., Bucher, C., Doerzaph, Z.R., Jermeland, J., Knipling, R.R., 2006. The 100-Car Naturalistic Driving Study, Phase II - Results of the 100-Car Field Experiment (Technical report No. DOT HS 810 593). Virginia Tech Transportation Institute, Blacksburg, Virginia.
Ester, M., Kriegel, H., S, J., Xu, X., 1996. A density-based algorithm for discovering clusters in large spatial databases with noise. AAAI Press, pp. 226–231.
Guo, F., Klauer, S.G., McGill, M.T., Dingus, T.A., 2010. Evaluating the Relationship Between Near-Crashes and Crashes: Can Near-Crashes Serve as a Surrogate Safety Metric for Crashes? (DOT HS 811 382).
Hanowski, R.J., Blanco, M., Nakata, A., Hickman, J.S., Schaudt, W.A., Fumero, M.C., Olson, R.L., Jermeland, J., Greening, M., Holbrook, T., Knipling, R.R., Madison, P., 2008. The Drowsy Driver Warning System Field Operational Test: Data Collection Methods (Final Report No. DOT HS 810 035).
Huber, W., Ladke, M., Ogger, R., 1999. Extended Floating Car Data for the acquisition of traffic information, in: Proceedings of the 6th World Congress on Intelligent Transport Systems. Toronto, Canada.
Hydèn, C., 1987. The development of a method for traffic safety evaluation: The Swedish traffic conflicts technique, Bulletin 70. Institut för Trafikteknik, LTH Lund.
Koenker, R., 2009. Quantile regression, Repr. ed, Econometric Society monographs. Cambridge Univ. Press, Cambridge.
Lerner, N., Jenness, J., Singer, J., Klauer, S., Lee, S., Donath, M., Manser, M., Ward, N., 2010. An Exploration of Vehicle-Based Monitoring of Novice Teen Drivers: Final Report (No. DOT HS 811 333). National Highway Traffic Safety Administration, Washington, D.C.
McGehee, D.V., Raby, M., Carney, C., Lee, J.D., Reyes, M.L., 2007. Extending parental mentoring using an event-triggered video intervention in rural teen drivers. Journal of Safety Research 38, 215–227.
Messelodi, S., Modena, C.M., Zanin, M., De Natale, F.G.B., Granelli, F., Betterle, E., Guarise, A., 2009. Intelligent extended floating car data collection. Expert Systems with Applications 36, 4213–4227.
Metz, B., Landau, A., Hargutt, V., Neukum, A., 2013. Naturalistic Driving Data - Re-Analyse von Daten aus dem EU-Projekt euroFOT. FAT-Schriftenreihe 256.
Mitschke, M., 2003. Dynamik von Kraftfahrzeugen. Springer, Berlin.
Nitsche, P., Aichinger, C., Aigner-Breuss, E., Hahn, M., Kaiser, S., Russwurm, K., Stütz, R., 2014. FAST - Fahrverhaltensstudien zur Ablenkungsbewertung von Straßeninfrastruktur (Forschungsarbeiten des österreichischen Verkehrssicherheitsfonds No. 033). Bundesministerium für Verkehr, Innovation und Technologie (bmvit), Vienna, Austria.
Nitsche, P., Aleksa, M., Winkelbauer, M., Harnisch, M., Kammer, M., 2014b. The impacts of electric cars on road safety: Insights from a real-world driving study, in: Transport Research Arena 2014 Proceedings. Paris, France.
Olson, R.L., Hanowski, R.J., Hickman, J.S., Bocanegra, J.L., 2009. Driver Distraction in Commercial Vehicle Operations (No. FMCSA-RRR-09-042). Virginia Tech Transportation Institute, Blacksburg, Virginia.
Perkins, S.R., Harris, J.L., 1968. Traffic conflict characteristics-accident potential at intersections. Highway Research Record.
Pilgerstorfer, M., Runda, K., Brandstätter, C., Christoph, M., Hakkert, S., Toledo, T., Ishaq, R., Gatscha, M., 2012. DaCoTA - Deliverable 6.3 Report on Small Scale Naturalistic Driving Pilot (Deliverable 6.3), Road Safety Data, Collection, Transfer and Analysis. Austrian Road Safety Board, Loughborough University, UK.
Spicer, B.R., 1973. A study of traffic conflicts at six intersections (TRRL report LR551). Crowthorne, UK.
Stein, G.P., Mano, O., Shashua, A., 2003. Vision-based ACC with a single camera: bounds on range and range rate accuracy, in: IEEE Intelligent Vehicles Symposium, 2003. Proceedings. Presented at the IEEE Intelligent Vehicles Symposium, 2003. Proceedings, pp. 120–125.
Williams, M.J., 1981. Validity of the traffic conflicts technique. Accident Analysis & Prevention 13, 133–145.
Young, W., Sobhani, A., Lenné, M.G., Sarvi, M., 2014. Simulation of safety: A review of the state of the art in road safety simulation modelling. Accident Analysis & Prevention 66, 89–103.