comm
en
t
re
v
ie
w
s
re
ports
de
p
o
si
te
d r
e
se
a
rch
refer
e
e
d
re
sear
ch
interacti
o
ns
inf
o
rmation
Strategy for encoding and comparison of gene expression
signatures
Yajun Yi
*
, Chun Li
†
, Clay Miller
*
and Alfred L George Jr
*‡
Addresses: *Department of Medicine, Garland Avenue, Vanderbilt University, Nashville, Tennessee 37232-0275,USA. †Department of Biostatistics, Garland Avenue, Vanderbilt University, Nashville, Tennessee 37232-0275,USA. ‡Department of Pharmacology, Garland Avenue, Vanderbilt University, Nashville, Tennessee 37232-0275,USA.
Correspondence: Alfred L George. Email: [email protected]
© 2007 Yi et al.; licensee BioMed Central Ltd.
This is an open access article distributed under the terms of the Creative Commons Attribution License (http://creativecommons.org/licenses/by/2.0), which permits unrestricted use, distribution, and reproduction in any medium, provided the original work is properly cited.
Comparison of expression signatures
<p>EXALT (EXpression signature AnaLysis Tool) enables comparisons of microarray data across experimental platforms and different laboratories.</p>
Abstract
EXALT (EXpression signature AnaLysis Tool) is a computational system enabling comparisons of microarray data across experimental platforms and different laboratories http:// seq.mc.vanderbilt.edu/exalt/. An essential feature of EXALT is a database holding thousands of gene expression signatures extracted from the Gene Expression Omnibus, and encoded in a searchable format. This novel approach to performing global comparisons of shared microarray data may have enormous value when coupled directly with a shared data repository.
Rationale
The application of high-throughput microarray technology for determining global changes in gene expression is an important and revolutionary experimental paradigm that facilitates advances in functional genomics and systems biol-ogy. Widespread use of this approach is evident in the rapid growth of microarray datasets stored in public repositories [1,2]. For example, the Gene Expression Omnibus (GEO), curated by the National Center for Biotechnology Informa-tion (NCBI), has received thousands of data submissions rep-resenting more than 3 billion individual molecular abundance measurements [3,4].
The growth in microarray data deposition is reminiscent of the early days of GenBank, when exponential increases in publicly accessible nucleotide sequence data occurred. How-ever, unlike nucleotide sequences, microarray datasets are not as easily shared by the research community, resulting in many investigators being unable to exploit the full potential
of these data. New paradigms for searching and comparing publicly available microarray results are needed to promote widespread, investigator-driven research on shared data.
To meet this need, we developed and implemented a bioinfor-matic strategy, termed EXALT (EXpression signature AnaLy-sis Tool), to enable comparisons of microarray data across experimental platforms, different laboratories, and multiple species. Our system allows investigators to use gene expres-sion signatures (also referred to as gene sets) to query a large formatted collection of microarray results. We accomplished this by first transforming a large collection of gene expression data into a rank ordered format of differentially expressed gene signatures within each experiment. Our strategy avoids the difficulties encountered in direct comparisons of raw microarray observations, and it is not hampered by different experimental platforms. This new approach to mining shared microarray data may have greatest value when it is offered as an online tool for mining data in a repository such as GEO. Published: 5 July 2007
Genome Biology 2007, 8:R133 (doi:10.1186/gb-2007-8-7-r133)
Received: 11 April 2007 Revised: 13 June 2007 Accepted: 5 July 2007 The electronic version of this article is the complete one and can be
In developing EXALT, we embraced the philosophy that direct comparisons of raw microarray data would be neither feasible nor beneficial. Rather than compare raw data, we chose to implement a search paradigm that matches gene expression signatures deduced from pre-processed (normal-ized, background subtracted) data, such as that deposited in the GEO database. Because of this feature, EXALT can com-pare data from any microarray platform and is not dependent on the methods used for the initial data processing. The out-put from EXALT provides similarity scores and statistical confidence levels for each signature match, thus allowing rapid perusal of relationships between the query data and entries in a database of other microarray experiments.
In order to create a searchable database, we first developed a data structure to encode gene expression signatures that incorporates three attributes, organized into 'triplets', of genes exhibiting significant differences in expression. Each triplet consists of an individual gene identifier, a statistical score, and a direction code indicating whether the gene is expressed at a higher (U for 'upregulated') or lower (D for 'downregulated') level between control and experimental groups. Thus, a gene expression signature, as defined by EXALT, is a set of significant genes with their corresponding statistical scores and direction codes. In essence, a signature (or group of signatures) represents a statistically validated 'fingerprint' associated with a biologic observation made from a gene expression experiment.
A computational pipeline (array expression signature pipe-line [AESP]) was implemented to convert automatically microarray data from GEO and other sources into an encoded gene expression signature database (SigDB). For this data-base, each microarray study was partitioned into three levels: datasets, groups, and samples. EXALT required that each microarray study had one to many datasets based on its experimental design, and that each dataset included at least two groups. In each group, EXALT further required at least two samples to serve as biologic replicates. Each sample described the abundance measurements for each feature ele-ment obtained from a single hybridization or experiele-mental condition. Two or more groups were needed to generate sta-tistical comparisons. Significant genes were defined from two groups of samples by calculating a Student's t-statistic, signif-icant gene P value (false positive rate), and Q value (false dis-covery rate). Correspondingly, gene expression signatures are collections of significant genes determined from statistical comparisons of groups. Because a microarray study can pro-duce one or many gene expression signatures, depending on the number of groups, we related the maximum total number of signatures (TNS) to the group number (N) in the following equation: TNS = (N × [N - 1])/2.
Among 874 GEO datasets representing microarray experi-ments performed using human, mouse, or rat tissues, 620
natures. The extracted signatures (total 16,181; average 1,683 significant genes per signature) from 14,303 hybridizations populated three separate SigDB files for human, mouse, and rat. The signatures in SigDB are designated as subject signa-tures. Most datasets were either single-channel intensity data, usually corresponding to Affymetrix microarrays, or dual-channel ratio data, usually corresponding to spotted cDNA microarrays. Additional SigDB entries originated from published microarray studies that were not deposited in GEO, as described in the Materials and methods section (below).
Design and validation of EXALT
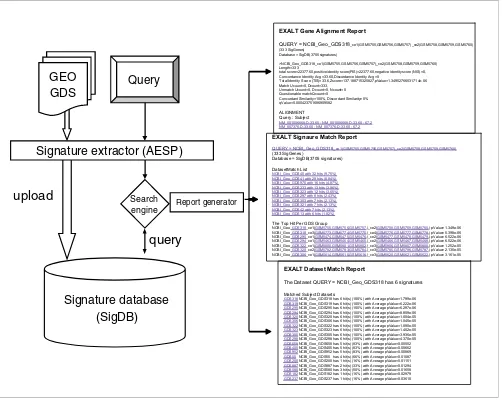
The EXALT system consists of four components (two pro-gram pipelines, SigDB, and search engine) and a web inter-face (Figure 1). To compare a user-defined query with SigDB, gene expression signatures were first extracted from a pre-processed query data set using AESP. Each user-defined query signature was then compared with every subject signa-ture in SigDB by computing similarity scores and confidence levels. Thus, all signatures from the query dataset were com-pared with all signatures in SigDB. The EXALT comparisons were based on estimating the degree of signature similarity expressed as a normalized total identity score (TIS) between expression signatures derived from a query dataset and sig-natures in SigDB (see Materials and methods, below). The significance of the similarity was determined by a simulation analysis (see Materials and methods, below). Finally, reports of similarity were summarized at three levels (gene, signa-ture, and dataset) and sent to the user via an HTML report pipeline (HRP). All results presented here were summarized from dataset-level reports, and the confidence levels are expressed as adjusted mean P values (see Materials and methods, below).
As a prerequisite for using EXALT, a user-defined, pre-proc-essed query dataset must be in a simple table format or the GEO simple omnibus format in text (SOFT) format. Then, the user can upload the pre-processed microarray dataset to the EXALT web server [5] by selecting the choice 'Uploading a query dataset' in the top menu bar and obtaining a unique dataset tracking identifier (ID). The EXALT server currently runs query datasets in a batch mode. When analysis is com-plete, the user can retrieve the EXALT result using the track-ing ID. Other features such as searchtrack-ing and browstrack-ing signatures from the EXALT databases are under development.
comm
en
t
re
v
ie
w
s
re
ports
refer
e
e
d
re
sear
ch
de
p
o
si
te
d r
e
se
a
rch
interacti
o
ns
inf
o
rmation
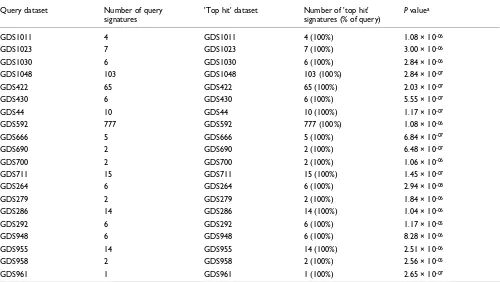
signatures. Results from this analysis demonstrated that the top 'hits' for each GDS, as defined by lowest adjusted mean P
value and greatest percentage of matching query signatures, were perfectly concordant with the corresponding entries in SigDB. Twenty representative matching records are pre-sented in Table 1. These results demonstrated that EXALT was able to identify datasets correctly through comparisons between query and subject signatures.
Relationship of statistical with biologic
significance
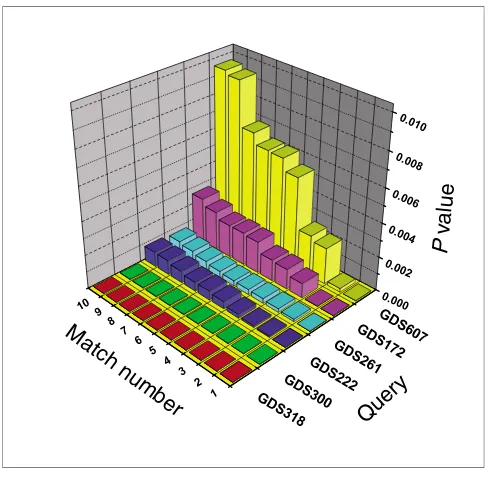
We next considered whether the output of EXALT could be used to judge the degree of biological relatedness between query and subject datasets. In Figure 2, we plotted the trend in adjusted mean P value for the top ten matches for six of the data queries derived from the 124 self-matching results. In each case, the first indexed 'hit' (match number 1)
[image:3.612.55.557.87.489.2]Schematic representation of EXALT system Figure 1
Schematic representation of EXALT system. A data flow diagram of computational steps is shown on the left, illustrating input of subject (Gene Expression Omnibus [GEO] dataset [GDS]) and query datasets, extraction of gene expression signatures, comparison with signature database, and generation of reports. Representative EXALT outputs are illustrated on the right, with three report levels including gene alignment, signature matches, and dataset matches. Reports are coded in HTML and include hypertext links (underlined blue text) to publicly accessible data sources or to other report levels. Some special terms were used in the gene alignment report. 'Total score' is the sum of positive identity score (PIS) and negative identity score (NIS).
'Concordance Identity Avg' is the average PIS per signature gene. 'Discordance Identity Avg' is the average NIS per signature gene. 'Concordant Similarity' is the number of concordant genes expressed as a percentage of the total number of genes in the signature. 'Discordant Similarity' is the number of discordant genes expressed as a percentage of the total number of genes in the signature. 'Alignment' refers to the list of query and matched subject triplets. AESP, array expression signature pipeline; EXALT, EXpression signature AnaLysis Tool; SigDB, signature database.
Query
Search
engine Report generator
Signature database
(SigDB)
Signature extractor (AESP)
upload
query
GEO
GDS
EXALT Dataset Match Report
The Dataset QUERY = NCBI_Geo_GDS318 has 6 signatures
Matched Subject Datasets
GDS318NCBI_Geo_GDS318 has 6 hit(s) (100%) with Average pValue=1.799e-06
GDS319NCBI_Geo_GDS319 has 6 hit(s) (100%) with Average pValue=6.222e-06
GDS295NCBI_Geo_GDS295 has 6 hit(s) (100%) with Average pValue=6.297e-06
GDS294NCBI_Geo_GDS294 has 6 hit(s) (100%) with Average pValue=8.809e-06
GDS320NCBI_Geo_GDS320 has 6 hit(s) (100%) with Average pValue=1.004e-05
GDS306NCBI_Geo_GDS306 has 6 hit(s) (100%) with Average pValue=1.045e-05
GDS322NCBI_Geo_GDS322 has 6 hit(s) (100%) with Average pValue=1.090e-05
GDS323NCBI_Geo_GDS323 has 6 hit(s) (100%) with Average pValue=1.402e-05
GDS305NCBI_Geo_GDS305 has 6 hit(s) (100%) with Average pValue=3.936e-05
GDS298NCBI_Geo_GDS298 has 6 hit(s) (100%) with Average pValue=4.370e-05
GDS658NCBI_Geo_GDS658 has 5 hit(s) (83%) with Average pValue=0.00552
GDS405NCBI_Geo_GDS405 has 5 hit(s) (83%) with Average pValue=0.00662
GDS952NCBI_Geo_GDS952 has 5 hit(s) (83%) with Average pValue=0.00869
GDS55NCBI_Geo_GDS55 has 4 hit(s) (66%) with Average pValue=0.01087
GDS200NCBI_Geo_GDS200 has 1 hit(s) (16%) with Average pValue=0.01151
GDS887NCBI_Geo_GDS887 has 2 hit(s) (33%) with Average pValue=0.01294
GDS580NCBI_Geo_GDS580 has 3 hit(s) (50%) with Average pValue=0.01658
GDS182NCBI_Geo_GDS182 has 1 hit(s) (16%) with Average pValue=0.02979
GDS237NCBI_Geo_GDS237 has 1 hit(s) (16%) with Average pValue=0.03610
EXALT Signaure Match Report
QUERY = NCBI_Geo_GDS318_ce1(GSM5755,GSM5756,GSM5757)_ce2(GSM5758,GSM5759,GSM5760)
(333 SigGenes)
Database = SigDB(3705 signatures) DatasetMatch List
NCBI_Geo_GDS40 with 32 hits (9.75%) NCBI_Geo_GDS41 with 29 hits (8.84%) NCBI_Geo_GDS970 with 16 hits (4.87%) NCBI_Geo_GDS233 with 13 hits (3.96%) NCBI_Geo_GDS323 with 12 hits (3.65%) NCBI_Geo_GDS297 with 8 hits (2.43%) NCBI_Geo_GDS303 with 7 hits (2.13%) NCBI_Geo_GDS321 with 7 hits (2.13%) NCBI_Geo_GDS42 with 7 hits (2.13%) NCBI_Geo_GDS13 with 6 hits (1.82%)
The Top Hit Per GDS Group
NCBI_Geo_GDS318_ce1(GSM5755,GSM5756,GSM5757,)_ce2(GSM5758,GSM5759,GSM5760,) pValue=1.349e-06 NCBI_Geo_GDS319_ce3(GSM5773,GSM5774,GSM5775,)_ce4(GSM5776,GSM5777,GSM5778,) pValue=5.398e-06 NCBI_Geo_GDS295_ce1(GSM5474,GSM5475,GSM5476,)_ce2(GSM5477,GSM5478,GSM5479,) pValue=6.522e-06 NCBI_Geo_GDS294_ce1(GSM5463,GSM5464,GSM5465,)_ce2(GSM5466,GSM5467,GSM5468,) pValue=6.522e-06 NCBI_Geo_GDS322_ce1(GSM5800,GSM5801,GSM5802,)_ce3(GSM5806,GSM5807,GSM5808,) pValue=1.252e-05 NCBI_Geo_GDS320_ce2(GSM5782,GSM5783,GSM5784,)_ce3(GSM5785,GSM5786,GSM5787,) pValue=2.135e-05 NCBI_Geo_GDS306_ce1(GSM5614,GSM5615,GSM5616,)_ce3(GSM5620,GSM5621,GSM5622,) pValue=3.161e-05
EXALT Gene Alignment Report
QUERY = NCBI_Geo_GDS318_ce1(GSM5755,GSM5756,GSM5757)_ce2(GSM5758,GSM5759,GSM5760) (333 SigGenes)
Database = SigDB(3705 signatures)
>NCBI_Geo_GDS318_ce1(GSM5755,GSM5756,GSM5757)_ce2(GSM5758,GSM5759,GSM5760) Length=333
total score=22377.60,positive identity score(PIS)=22377.60,negative identity score (NIS)=0, Concordance Identity Avg =33.60,Discordance Identity Avg =0
Total Identity Score (TIS)=33.6,Zscore=137.188715325827,pValue=1.34952766531714e-06 Match Ucount=0, Dcount=333,
Unmatch Ucount=0, Dcount=0, Ncount=0 Questionable match Qcount=0
Concordant Similarity=100%, Discordant Similarity=0% qValue=0.000423751686909582
ALIGNMENT Query : Subject
represented a self-match and the other nine were matches with subject datasets having varying levels of similarity.
The variation in adjusted mean P value trends among the query datasets illustrated in Figure 2 may potentially repre-sent different biologic relationships between the query and the subject datasets. To explore this idea further, we exam-ined the dataset matches for two specific queries (GDS318 and GDS607) that exhibited marked differences in P value trends. For the query GDS318, all ten top 'hits' had adjusted mean P values similar to the self-match (P < 1.55 × 10-05). By contrast, adjusted mean P values for subject datasets match-ing query GDS607 increased steadily through the progression of ordered hits. To determine whether these different adjusted mean P value trends reflect different biologic rela-tionships, we explored the annotations for each matching dataset. Matches to GDS318 belong to the same cluster of datasets (anchored by GDS318 set) from a single microarray study [6]. The goal of that study was to examine time-depend-ent changes in gene expression for mouse splenic B lym-phocytes stimulated with 33 different ligands known to directly induce or co-stimulate proliferation. The specific lig-and used in generating GDS318 was stromal cell derived fac-tor-1, whereas the ligands studied in the matching subject datasets were secondary lymphoid-organ chemokine,
bombe-sin, B-lymphocyte chemoattractant, terbutaline, insulin-like growth factor-1, tumor necrosis factor-α, 2-methyl-thio-ATP, and sphingosine-1-phosphate. All of these ligands induce similar physiologic events, including B-cell migration and homing [7,8], lymphocyte trafficking [9,10], and mitogenic activation [11]. These results indicate that EXALT can define related gene expression signatures evoked by a heterogenous group of ligands.
By contrast, the annotations for datasets matching GDS607 reflect greater biologic heterogeneity. The GDS607 dataset originated from a study of mouse spermatogenesis and testis development, and nearly half (four out of nine) of the match-ing subject datasets are biologically related. For example, GDS662, GDS704, GDS606, and GDS660 refer to studies of spermatogenesis and embryonic testis. However, the biologic relationships of GDS607 to the remaining five matching data-sets are less clear: GDS900 (kidney inner medulla from aquaporin-1 null and wild-type mice), GDS604 (neurofi-bromatosis and neurodevelopment), GDS592 (expression profiles from 61 physiologically normal tissues), GDS14 (lung responses to allergic stimuli), and GDS61 (vascular remode-ling in pulmonary hypertension). We interpret these findings as an illustration that the level of statistical significance defined by EXALT correlates generally with biologic
Self-matching test results for datasets compared using EXALT
Query dataset Number of query
signatures
'Top hit' dataset Number of 'top hit'
signatures (% of query)
P valuea
GDS1011 4 GDS1011 4 (100%) 1.08 × 10-06
GDS1023 7 GDS1023 7 (100%) 3.00 × 10-06
GDS1030 6 GDS1030 6 (100%) 2.84 × 10-06
GDS1048 103 GDS1048 103 (100%) 2.84 × 10-07
GDS422 65 GDS422 65 (100%) 2.03 × 10-07
GDS430 6 GDS430 6 (100%) 5.55 × 10-07
GDS44 10 GDS44 10 (100%) 1.17 × 10-07
GDS592 777 GDS592 777 (100%) 1.08 × 10-06
GDS666 5 GDS666 5 (100%) 6.84 × 10-07
GDS690 2 GDS690 2 (100%) 6.48 × 10-07
GDS700 2 GDS700 2 (100%) 1.06 × 10-06
GDS711 15 GDS711 15 (100%) 1.45 × 10-07
GDS264 6 GDS264 6 (100%) 2.94 × 10-08
GDS279 2 GDS279 2 (100%) 1.84 × 10-06
GDS286 14 GDS286 14 (100%) 1.04 × 10-06
GDS292 6 GDS292 6 (100%) 1.17 × 10-05
GDS948 6 GDS948 6 (100%) 8.28 × 10-06
GDS955 14 GDS955 14 (100%) 2.51 × 10-06
GDS958 2 GDS958 2 (100%) 2.56 × 10-05
GDS961 1 GDS961 1 (100%) 2.65 × 10-07
[image:4.612.57.557.121.403.2]comm
en
t
re
v
ie
w
s
re
ports
refer
e
e
d
re
sear
ch
de
p
o
si
te
d r
e
se
a
rch
interacti
o
ns
inf
o
rmation
relatedness among experiments. However, these results may also be informative as to less obvious relationships that will require additional investigations to be fully revealed.
Cross-platform comparisons of expression
signatures
We next tested whether EXALT could identify related gene expression signatures in biologically related datasets gener-ated using different microarray platforms. For this test we utilized publicly available expression data generated from the NCI-60 panel of cancer cell lines by three independent labo-ratories [12-14] using either oligonucleotide (Affymetrix) or spotted cDNA arrays. Previously, Kuo and coworkers [15] demonstrated that comparisons of primary data from two of these studies revealed poor correlation of individual gene expression levels when the two distinct microarray platforms were compared. They attributed the discordance to probe-specific factors and expressed pessimism about the prospects of comparing data across platforms. However, greater con-cordance was observed when comparisons were restricted to the subset of genes (generally < 25%) for which there was a high confidence level of identity between the two array plat-forms [16], or when analyses focused on gene sets sharing similar biologic function or other attributes [17].
We used EXALT to compare expression signatures obtained from analysis of NCI-60 expression data representing nine different cancers (breast, colon, prostate, central nervous sys-tem, leukemia, melanoma, lung, renal, and ovarian; Table 2). Expression data from individual cell lines derived from the same cancer type were assumed to represent biologic repli-cates that were more similar within a group than between dif-ferent groups. We deduced expression signatures from each study, then added these signatures (n = 89) to SigDB to ena-ble EXALT analysis (Taena-ble 2). Next, we used the expression signatures as queries to search SigDB, and then ordered the results based on adjusted mean P value corresponding to each query dataset. The primary goal of these comparisons was to determine whether similarities of expression signatures among biologically related datasets could be detected across different microarray platforms.
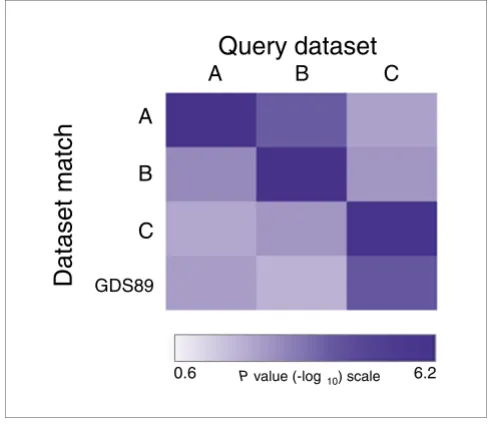
Figure 3 illustrates the significance levels for EXALT analyses organized by query dataset. The most significant match for each comparison was a self-match, and the next most closely related signatures were between studies that used the Affymetrix platform (query datasets A and B; Figure 3). Inter-estingly, EXALT also detected GDS89, an updated full ver-sion of dataset C generated by the same research group using spotted cDNA arrays. To test whether other NCI-60 data were present that were not identified by EXALT, we searched the original GEO database (May 2006 release) using various key words, including 'NCI60', and only one additional dataset (GDS88) was identified. GDS88 consisted of four groups representing four different cancer types, but three out of four cancer types had only one sample. Therefore, the experimen-tal design in this dataset could not be used by EXALT to define signatures, and this explains why no match was found to GDS88 in the initial search. Although the greatest signifi-cance levels were observed in self-matching datasets and between expression data obtained using the same microarray platform, there was also statistical confidence across plat-forms for these biologically related data sets (datasets B and C). These findings demonstrate that EXALT can infer biologic relationships between datasets generated using different array platforms.
Use of EXALT in meta-analysis
Meta-analysis has been demonstrated to provide a strategy for exploiting comparable microarray data from multiple sources to validate observations made by a single study [18]. We tested whether EXALT could enable meta-analysis of microarray data for the purpose of result validation in the set-ting of cancer gene expression, specifically breast cancer.
We selected a query dataset derived from a published study that examined gene expression differences among 69 estro-gen receptor (ER)-negative and 226 ER-positive tumors using inkjet-synthesized oligonucleotide microarrays [19]. The comparison between ER-positive and ER-negative
[image:5.612.53.297.84.323.2]sam-Significance trends among matching datasets Figure 2
Significance trends among matching datasets. Six representative query datasets from the 124 self-matching results were compared using EXALT with all Gene Expression Omnibus (GEO) records. Corresponding adjusted mean P values for each dataset match are plotted on a log10 scale.
The match number reflects the rank order of adjusted mean P values for each query dataset with one representing the best match. Self-matches exhibited the lowest adjusted mean P value for all query datasets and were ranked 1 in each search. EXALT, EXpression signature AnaLysis Tool; GDS, GEO dataset.
Match n
umber
Quer
y
P
v
ple groups enabled EXALT to extract one gene expression sig-nature. Using EXALT to search SigDB, we identified a single matching subject dataset (GDS1329; adjusted mean P value = 0.0002) obtained from a study using Affymetrix HG-U133A arrays. Interestingly, GDS1329 involved an analysis of 49 breast cancer tumors classified into luminal, basal, and a novel apocrine cell type [20]. Importantly, luminal tumors are typically ER-positive, whereas basal tumors are ER-nega-tive. Three signatures were generated from this study design, and the query signature had a significant and specific match to one of the three. The matching subject signature was derived from a specific comparison between 16 basal ER-neg-ative tumor samples and 27 luminal ER-positive samples. This finding suggests that EXALT successfully validated breast cancer ER-negative versus ER-positive gene expres-sion signatures by comparing two datasets generated by
inde-pendent groups using different microarray platforms. This result also illustrates how EXALT can be used to identify bio-logically related datasets on the basis of inherent properties of gene expression signatures.
The use of expression profiles as biomarkers to predict dis-ease prognosis and outcome has become an important adjunct diagnostic tool in cancer [21,22]. However, both training and testing datasets in such predication models typ-ically originate from the same dataset or study. Using an in silico validation strategy, such as we have illustrated here with EXALT, the confidence level in identifying predictive signatures could potentially be increased without performing additional experiments.
Other tools for meta-analysis of microarray data
There are many obstacles to the sharing and widespread use of microarray data. In general, expression measurements made across microarray technologies are not directly compa-rable [15,23]. Microarray data are inherently more complex than other biologic data types, and there are no universal standards or comparable measurement units. Comparisons among datasets have been particularly difficult [24], as evi-denced by the poor correlation between cDNA and oligonu-cleotide arrays [15,25]. Further advances in genomics and systems biology will require new analysis paradigms that are capable of performing comparisons among experiments that are platform independent.
Previously proposed strategies for comparing multiple micro-array datasets can be broadly considered in two categories: direct comparisons of significant gene lists, and indirect com-parisons based on gene ontology or other shared biologic knowledge. The most simple direct comparison strategy involves comparing lists of significant genes among related studies and visualizing overlapping genes using Venn dia-grams or other methods. Automated versions of this approach such as L2L [26] and LOLA [27], provide quick methods with which to compare lists, but they are quite lim-ited by database scale and the reliance upon potentially heter-ogeneous analysis strategies used by the original studies from which the lists are generated.
A more advanced comparison strategy of significant gene lists is provided by Oncomine [18], a comprehensive and expertly annotated database of gene expression studies related to
can-Datasets from gene expression studies of the NCI-60 cell lines
Dataset name Array type Total clones Cancer classes Signature number
Stanford_Brown_NatGenetV24P227 cDNA 9,706 9 36
Harvard_Kohane_PNASV97P12182 Affy 7,245 9 30
MIT_Golub_PNASV98P10787 Affy 6,810 9 23
[image:6.612.57.561.119.186.2]Cross-platform dataset matching revealed by EXALT Figure 3
Cross-platform dataset matching revealed by EXALT. Heat-map illustrating the statistical significance among NCI-60 gene expression profiling experiments. The datasets include those reported by Staunton and coworkers [13] (dataset A), Butte and colleagues [12] (dataset B), Ross and coworkers [14] (dataset C), and GDS89. Datasets A and B were generated using Affymetrix arrays, whereas datasets C and GDS89 were generated using spotted cDNA arrays. Dataset comparisons exhibited adjusted mean P values below 0.01 (corresponding to values > 2.0 on the -log10 scale). The greatest significance levels were observed for self-matching and matches between studies using the same microarray platform. EXALT, EXpression signature AnaLysis Tool; GDS, Gene Expression Omnibus dataset.
0.6 6.2
A B C
Query dataset
A
B
C
GDS89
Dataset match
[image:6.612.55.300.393.605.2]comm
en
t
re
v
ie
w
s
re
ports
refer
e
e
d
re
sear
ch
de
p
o
si
te
d r
e
se
a
rch
interacti
o
ns
inf
o
rmation
cer. This analytical tool enables searches to identify cancer-related expression data that demonstrate significant differen-tial expression of a single gene of interest or a list of signifi-cant genes related to a specific cancer type. Differential expression data are pre-computed in Oncomine using a uni-form statistical algorithm, and the developers of this system have demonstrated success in performing comparative meta-profiling to identify shared gene expression signatures across several experiments, although this feature does not appear accessible to the casual user. This system is limited to cancer-related gene expression studies. Another described approach to cross-platform analysis of microarray data, referred to as 'second order analysis', has been applied to deduce networks of transcription factors in yeast [28]. In this approach, the expression patterns of co-expressed gene pairs or 'doublets' were examined across multiple datasets to infer functional linkages (first order analysis). Then, groups of doublets are clustered together based on similar patterns of co-expression. Although capable of elucidating hidden functional linkages among genes, utilization of this method requires substantial informatics expertise.
Recently, Lamb and coworkers [29] described a microrray database search algorithm in an application called the Con-nectivity Map (CMAP). Like EXALT, CMAP performs micro-array signature based comparisons, but the two strategies have several important distinctions. At the database level, CMAP has a focused goal to profile drug-related cancer signa-tures in ten cell lines, and therefore only a small number of signatures (564) were generated. By contrast, SigDB used by EXALT included 16,181 signatures, representing hundreds of different experimental types from many different tissues. All collected subject signatures in CMAP were derived from one laboratory using a single microarray platform, and signatures derived from other platforms were not demonstrated to work with CMAP. Again, by contrast, SigDB contained data gener-ated with multiple platforms that are fully accessible by EXALT. Other differences include the lack of a unified method for query signature production in CMAP and restric-tions on signature length (1,000 genes), whereas EXALT has stringent requirements for query signatures and no limit to the number of genes in a signature (average signature length in SigDB is 1,683 genes). Finally, even though both strategies use signed rank genes as the basis for signatures from a two-group comparison, CMAP does not require biologic replicates in a sample group and no statistical confidence is assigned to each ranked gene, as is done by EXALT.
Unique features and limitations of EXALT
We developed EXALT to assist researchers wishing to com-pare the results of multiple gene expression profiling experi-ments. A key feature of our approach is that it enables comparative analysis of microarray datasets based on signa-ture similarity. A second important attribute is the use of a large, standardized database of microarray data (GEO) and
the ability to incorporate virtually any publicly accessible data source. We further implemented an algorithm for performing comprehensive signature comparisons and a user friendly report format. These features provide a potential platform for sharing and comparing all microarray data in a manner suit-able for widespread use.
The encoded signatures used by EXALT can serve as unique identifiers for the datasets from which they are derived. Com-monly used microarray data analysis methods identify a small fraction of all data based on statistical differences in gene expression. EXALT follows the same principle to extract sig-nificant genes from pre-processed microarray datasets, but it further compiles these data into a searchable format. This abstraction process reduces the total amount of data by more than 1,000-fold and allows for a more efficient and accurate search. More importantly, the nonparametric reduction in the volume of data achieves the goal of making different microarray expression datasets comparable. Even though the extracted signatures represent only 10% of the original data records, our results of self-matching (Table 1) indicate that they are unique and sensitive enough to identify original data-sets through signature comparisons.
EXALT, like all other methods for analyzing microarray data, has defined limitations. Signatures were not always extracta-ble from microarray datasets. Some GEO records did not have sufficient information to evaluate statistically. Similar to the GEO analysis tool and Oncomine, EXALT uses a single signif-icance test (t-test) to extract signatures from all experimental designs, and significant genes were defined based on a two-group comparison strategy. No signature could be produced if a comparison between two groups was not statistically sig-nificant. Our method adheres strictly to the group design specified by the investigators, and additional novel compari-sons within a dataset are not enabled. Signatures resulting from multiple group comparisons in the original dataset (for instance, time series experiments) could not be analyzed because the current GEO data structure does not provide a computable attribute to identify this type of experiment or hypothesis. However, other statistical comparison methods in conjunction with additional user controls are being consid-ered for future implementations of EXALT. Transcripts (expressed sequence tags) that have not been assigned to known genes having valid RefSeq identifiers cannot be included in signatures, and this will be a limitation until gene nomenclature becomes universally comprehensive and standardized.
Potential applications of EXALT
tures with coordinated transcription across a wide range of conditions in three distinct species. Drug discovery is another area driving interest in comparing microarray datasets. Ther-apeutic effects and toxicity of new drugs could be investigated by correlating gene expression signatures associated with known drug or toxic responses [23,31,32]. Finally, enabling widespread use and comparisons of microarray data will enhance the value of public repositories such as GEO and stimulate other innovative approaches to exploiting these data.
Materials and methods
Data collection
We collected publicly available gene expression data from several sources. Our primary source of preprocessed micro-array data sets was the GEO [33]. We used the May 2006 release of GEO. The logically related samples from the exper-iments represented by these records define GEO series records. About one-third of GEO series records have passed GEO internal control processes and are designated as GEO Data Sets (GDSs). GDS records are curated sets of gene expression measurements with processes such as background correction and normalization that are consistent across data-sets [3]. A GDS record represents a collection of biologically and statistically comparable GEO samples that can be exam-ined using the GEO suite of data display and analysis tools. Other datasets, as described below, were downloaded from publicly accessible sites named by the following conventions: company or institution; last name of corresponding author or dataset name; and journal abbreviation, volume (starting with 'V'), and starting page number (starting with 'P').
The NCI-60 datasets were derived from 60 human cancer cell lines and used by the US National Cancer Institute to screen for new antineoplastic drugs [15,16]. The NCI-60 panel used in this study included cell lines derived from breast, colon, prostate, and central nervous system cancers, and leukemia. The NCI-60 cell lines had been profiled using cDNA micorar-rays (Stanford_Brown_NatGenetV24P227) [14], and Affymetrix oligonucleotide HU6800 microarrays (Harvard_Kohane_ PNASV97P12182 and MIT_Golub_PNASV98P10787) [12,13]. Additional informa-tion is provided in Table 2.
Extracting gene expression signatures
We developed a four-step process to extract gene expression signatures from a dataset. First, data were formatted, if nec-essary, to a common data type, namely the SOFT format used by GEO. Reformatting included a minor reconfiguration of data annotation. All gene probe identifiers were translated to the corresponding NCBI Reference Sequence identifiers (Ref-Seq ID) [34] using our previously described Gene Annotation Project (GAP) database [35]. The RefSeq collection provides a comprehensive, integrated, nonredundant set of gene
iden-than UniGene clusters [36]. Second, for every two groups of samples in a dataset, we generated an expression signature. Following file conversion, each gene was assessed for the sig-nificance of differential expression using a two-sided Stu-dent's t-test. When multiple probes have the same RefSeq identifier, we analyzed them separately through the statistical testing step and then grouped them into a single record hav-ing a mean P value derived from the individual probes. To account for multiple hypothesis testing, P values determined for each significant gene were further adjusted by the false discovery rate (FDR) method using Q values [37]. Third, a list of significant genes with Q value of 0.2 or less was generated. For each significant gene, a Q score was calculated as the log-arithm of reciprocal Q value (-log [Q value]). Finally, a gene expression signature was generated as a list of 'triplets', each defined as RefSeq ID - direction code - Q score. The direction code is defined by the relative difference between two group means and can have one of three values (U [up], D [down], or X [uncertain]). The order of the two groups is arbitrary, and so the direction code will be reversed if the group order is flipped. However, the approach used to perform signature comparisons (see below) is not affected by the order of groups assigned at the time when signatures were extracted. Signa-tures were stored in a flat file database (SigDB).
Queries to our system are facilitated through a web-based computational pipeline (AESP) to automate the extraction of gene expression signatures from microarray datasets [5]. Input information includes dataset name, sample number, sample names, microarray platform, and group assignments. AESP performs translation of probe IDs, significance tests, and the encoding of gene expression signatures for use by EXALT. A unique dataset tracking ID is assigned to each input query dataset that can be used later to retrieve an EXALT report.
The EXALT server was implemented on a high throughput multi-CPU Linux cluster using PERL and system scripts. The primary platform was the Vanderbilt University Advanced Computing Center for Research & Education (ACCRE), which currently consists of 1,302 processors in 651 nodes, each with at least 1 gigabyte of memory, and dual gigabit ethernet ports. Processing all available GDS records (874 records, approxi-mately 2 gigabytes in size) from 14,303 hybridizations on a 35-CPU ACCRE subcluster required an average of 72 hours CPU time. A typical query dataset contains three groups. It can generate three signatures, with about 1,000 signature genes per signature. A typical EXALT analysis (for instance, production of signatures and then comparison with SigDB) will take approximately 2 hours on a single CPU.
Comparison of gene expression signatures
comm
en
t
re
v
ie
w
s
re
ports
refer
e
e
d
re
sear
ch
de
p
o
si
te
d r
e
se
a
rch
interacti
o
ns
inf
o
rmation
score (TIS) was computed in three steps. First, the signatures were aligned by matching RefSeq ID, then the direction codes (U, D, or X) for matching genes were determined to be con-cordant (U-U or D-D), discon-cordant (U-D), or uncertain (direc-tion code X in either query or subject). Next, the Q scores were summed separately for concordant and discordant matches to give a positive identity score (PIS) and a negative identity score (NIS), respectively, using the following equations:
Where N and M are numbers of concordant and discordant matches, respectively, and Siq and Sis (Sjq and Sjs ) are Q scores for the i-th concordant (j-th discordant) match in the query and subject signatures. The NIS score was assigned a negative value because of its opposite direction from PIS scores. Matches with at least one direction code of X and all non-matching genes were excluded from the identity score calcu-lations. Finally, the TIS was computed as the absolute value of the sum of PIS and NIS divided by the sum of signature lengths (Lq + Ls ) using the following: TIS = |PIS + NIS|/(Lq + Ls ).
Defining significance level
We carried out simulations to determine the statistical signif-icance of TIS values. We generated 1,000 random query sig-natures and computed TIS between each query signature and each subject signature in SigDB. The random query signa-tures had similar properties (length distribution, RefSeq ID frequency, and uniqueness) as compared with those of the actual data. The results suggested that TIS score correlated with query signature length. To adjust for the influence of query signature length, we derived the mean and standard deviation (SD) of TIS as functions of query length and then normalized TIS by converting to Z score using the following equation: ZTIS score = (TIS - mean)/SD, where mean and SD are functions of query length. This enabled us to generate an empirical distribution of ZTIS scores. For a real query, we fol-lowed the same procedure to calculate the ZTIS score, and compared it with the empirical distribution to estimate corre-sponding query P value. A query is statistically significant if its P value is 0.01 or less.
Reporting EXALT results
An algorithm for reporting EXALT results was implemented that considers information at three different levels: dataset, individual expression signature, and significant genes within a signature. The gene-level report contains alignments of sig-nificant gene triplets that were matched from within a pair of query and subject signatures. The signature level report con-tains matches between whole expression signatures. A query
signature may have none to many significant matches or 'hits' in a subject signature in SigDB, and the match with the small-est query P value is designated as the 'top hit'.
The most global comparison is a dataset (top-level) report, which describes the similarity between a query dataset and a dataset in SigDB. For this, a query dataset may have one or more query signatures, and each query signature may match one top hit in each subject dataset. The most similar dataset is selected based on two criteria. The first criterion is the aver-age of query P values from all top hit signatures divided by the total number of top hits (TS). The second criterion is the top hit ratio calculated as the total number of top hits divided by the total number of query signatures (TQ). An adjusted mean
P value is calculated by an arithmetic average of all top hit query P values divided by the top hit ratio, and this is used to rank the confidence levels of data set matches.
Acknowledgements
We dedicate this work to the memory of Anli Li (1964 to 2007). The authors thank Guangzu Zhang for assistance with software develop-ment, Drs Lu Xie and Jun Wu for dataset collection, Dr Annette Gilchrist for comments on the manuscript, Drs Christine Chung and Daniel Masys for critical review of the manuscript, and the Vanderbilt University Advanced Computer Center for Research & Education (ACCRE) for access to parallel computer support for use in our simulation study. This work was supported in part by a Howard Temin Award from the National Cancer Institute (CA114033 to YY) and NIH grant DK58749 (ALG).
References
1. Ball CA, Awad IA, Demeter J, Gollub J, Hebert JM, Hernandez-Bous-sard T, Jin H, Matese JC, Nitzberg M, Wymore F, et al.: The Stanford Microarray Database accommodates additional microarray
platforms and data formats. Nucleic Acids Res 2005,
33:D580-D582.
2. Edgar R, Domrachev M, Lash AE: Gene Expression Omnibus: NCBI gene expression and hybridization array data
repository. Nucleic Acids Res 2002, 30:207-210.
3. Barrett T, Suzek TO, Troup DB, Wilhite SE, Ngau WC, Ledoux P, Rudnev D, Lash AE, Fujibuchi W, Edgar R: NCBI GEO: mining
mil-lions of expression profiles--database and tools. Nucleic Acids
Res 2005, 33:D562-D566.
4. Barrett T, Troup DB, Wilhite SE, Ledoux P, Rudnev D, Evangelista C, Kim IF, Soboleva A, Tomashevsky M, Edgar R: NCBI GEO: mining tens of millions of expression profiles - database and tools
update. Nucleic Acids Res 2007, 35:D760-D765.
5. EXALT web server [http://seq.mc.vanderbilt.edu/exalt/]
6. Zhu X, Hart R, Chang MS, Kim JW, Lee SY, Cao YA, Mock D, Ke E, Saunders B, Alexander A, et al.: Analysis of the major patterns of B cell gene expression changes in response to short-term
stimulation with 33 single ligands. J Immunol 2004,
173:7141-7149.
7. Spiegel A, Kollet O, Peled A, Abel L, Nagler A, Bielorai B, Rechavi G, Vormoor J, Lapidot T: Unique SDF-1-induced activation of human precursor-B ALL cells as a result of altered CXCR4
expression and signaling. Blood 2004, 103:2900-2907.
8. Nombela-Arrieta C, Lacalle RA, Montoya MC, Kunisaki Y, Megias D, Marques M, Carrera AC, Manes S, Fukui Y, Martinez A, et al.: Differ-ential requirements for DOCK2 and
phosphoinositide-3-kinase gamma during T and B lymphocyte homing. Immunity
2004, 21:429-441.
9. Vora KA, Nichols E, Porter G, Cui Y, Keohane CA, Hajdu R, Hale J, Neway W, Zaller D, Mandala S: Sphingosine 1-phosphate recep-tor agonist FTY720-phosphate causes marginal zone B cell
displacement. J Leukoc Biol 2005, 78:471-480.
10. Graler MH, Huang MC, Watson S, Goetzl EJ: Immunological
PIS Siq Sis
i N
= +
=
∑
( )1
NIS Sjq Sjs
j M
= − +
=
∑
( )Immunol 2005, 174:1997-2003.
11. Soder O, Hellstrom PM: Neuropeptide regulation of human thymocyte, guinea pig T lymphocyte and rat B lymphocyte
mitogenesis. Int Arch Allergy Appl Immunol 1987, 84:205-211.
12. Butte AJ, Tamayo P, Slonim D, Golub TR, Kohane IS: Discovering functional relationships between RNA expression and
chem-otherapeutic susceptibility using relevance networks. Proc
Natl Acad Sci USA 2000, 97:12182-12186.
13. Staunton JE, Slonim DK, Coller HA, Tamayo P, Angelo MJ, Park J, Scherf U, Lee JK, Reinhold WO, Weinstein JN, et al.:
Chemosensi-tivity prediction by transcriptional profiling. Proc Natl Acad Sci
USA 2001, 98:10787-10792.
14. Ross DT, Scherf U, Eisen MB, Perou CM, Rees C, Spellman P, Iyer V, Jeffrey SS, Van de RM, Waltham M, et al.: Systematic variation in
gene expression patterns in human cancer cell lines. Nat
Genet 2000, 24:227-235.
15. Kuo WP, Jenssen TK, Butte AJ, Ohno-Machado L, Kohane IS: Anal-ysis of matched mRNA measurements from two different
microarray technologies. Bioinformatics 2002, 18:405-412.
16. Lee JK, Bussey KJ, Gwadry FG, Reinhold W, Riddick G, Pelletier SL, Nishizuka S, Szakacs G, Annereau JP, Shankavaram U, et al.: Compar-ing cDNA and oligonucleotide array data: concordance of gene expression across platforms for the NCI-60 cancer
cells. Genome Biol 2003, 4:R82.
17. Subramanian A, Tamayo P, Mootha VK, Mukherjee S, Ebert BL, Gil-lette MA, Paulovich A, Pomeroy SL, Golub TR, Lander ES, et al.: Gene set enrichment analysis: a knowledge-based approach for
interpreting genome-wide expression profiles. Proc Natl Acad
Sci USA 2005, 102:15545-15550.
18. Rhodes DR, Yu J, Shanker K, Deshpande N, Varambally R, Ghosh D, Barrette T, Pandey A, Chinnaiyan AM: Large-scale meta-analysis of cancer microarray data identifies common transcriptional
profiles of neoplastic transformation and progression. Proc
Natl Acad Sci USA 2004, 101:9309-9314.
19. van de Vijver MJ, He YD, van 't Veer LJ, Dai H, Hart AA, Voskuil DW, Schreiber GJ, Peterse JL, Roberts C, Marton MJ, et al.: A gene-expression signature as a predictor of survival in breast
cancer. N Engl J Med 2002, 347:1999-2009.
20. Farmer P, Bonnefoi H, Becette V, Tubiana-Hulin M, Fumoleau P, Lar-simont D, Macgrogan G, Bergh J, Cameron D, Goldstein D, et al.:
Identification of molecular apocrine breast tumours by
microarray analysis. Oncogene 2005, 24:4660-4671.
21. van 't Veer LJ, Dai H, van de Vijver MJ, He YD, Hart AA, Mao M, Peterse HL, van der KK, Marton MJ, Witteveen AT, et al.: Gene expression profiling predicts clinical outcome of breast
cancer. Nature 2002, 415:530-536.
22. Ramaswamy S, Tamayo P, Rifkin R, Mukherjee S, Yeang CH, Angelo M, Ladd C, Reich M, Latulippe E, Mesirov JP, et al.: Multiclass cancer
diagnosis using tumor gene expression signatures. Proc Natl
Acad Sci USA 2001, 98:15149-15154.
23. Butte A: The use and analysis of microarray data. Nat Rev Drug Discov 2002, 1:951-960.
24. Brazma A, Hingamp P, Quackenbush J, Sherlock G, Spellman P, Stoeckert C, Aach J, Ansorge W, Ball CA, Causton HC, et al.: Mini-mum information about a microarray experiment
(MIAME)-toward standards for microarray data. Nature Genet 2001,
29:365-371.
25. Tan PK, Downey TJ, Spitznagel EL Jr, Xu P, Fu D, Dimitrov DS, Lem-picki RA, Raaka BM, Cam MC: Evaluation of gene expression measurements from commercial microarray platforms.
Nucleic Acids Res 2003, 31:5676-5684.
26. Newman JC, Weiner AM: L2L: a simple tool for discovering the
hidden significance in microarray expression data. Genome
Biol 2005, 6:R81.
27. Cahan P, Ahmad AM, Burke H, Fu S, Lai Y, Florea L, Dharker N, Kobrinski T, Kale P, McCaffrey TA: List of lists-annotated (LOLA): a database for annotation and comparison of
pub-lished microarray gene lists. Gene 2005, 360:78-82.
28. Zhou XJ, Kao MC, Huang H, Wong A, Nunez-Iglesias J, Primig M, Aparicio OM, Finch CE, Morgan TE, Wong WH: Functional anno-tation and network reconstruction through cross-platform
integration of microarray data. Nat Biotechnol 2005, 23:238-243.
29. Lamb J, Crawford ED, Peck D, Modell JW, Blat IC, Wrobel MJ, Lerner J, Brunet JP, Subramanian A, Ross KN, et al.: The Connectivity Map: using gene-expression signatures to connect small
mol-ecules, genes, and disease. Science 2006, 313:1929-1935.
study in prostate cancer. Funct Integr Genomics 2003, 3:180-188.
31. Natsoulis G, El Ghaoui L, Lanckriet GR, Tolley AM, Leroy F, Dunlea S, Eynon BP, Pearson CI, Tugendreich S, Jarnagin K: Classification of a large microarray data set: algorithm comparison and
anal-ysis of drug signatures. Genome Res 2005, 15:724-736.
32. Bushel PR, Hamadeh HK, Bennett L, Green J, Ableson A, Misener S, Afshari CA, Paules RS: Computational selection of distinct
class- and subclass-specific gene expression signatures. J
Biomed Inform 2002, 35:160-170.
33. Gene Expression Omnibus [http://www.ncbi.nlm.nih.gov/geo]
34. NCBI Reference Sequence Collection [http://
www.ncbi.nlm.nih.gov/RefSeq/]
35. Yi Y, Mirosevich J, Shyr Y, Matusik R, George AL Jr: Coupled
anal-ysis of gene expression and chromosomal location. Genomics
2005, 85:401-412.
36. Pruitt KD, Tatusova T, Maglott DR: NCBI Reference Sequence (RefSeq): a curated non-redundant sequence database of
genomes, transcripts and proteins. Nucleic Acids Res 2005,
33:D501-D504.
37. Rhodes DR, Barrette TR, Rubin MA, Ghosh D, Chinnaiyan AM:
Meta-analysis of microarrays: interstudy validation of gene expression profiles reveals pathway dysregulation in