Effect of Deficit Irrigation and Mulch on Soil Physical
Properties, Growth and Yield of Maize
Rizwan Yaseen
1,*, Jamil Shafi
2, Waqas Ahmad
3, Muhammad Shoaib Rana
1,
Muhammad Salim
4, Saeed Ahmad Qaisrani
41Institute of Soil and Environmental Sciences, University of Agriculture, Faisalabad (38040) Pakistan 2Department of Plant Pathology, University of Agriculture Faisalabad (38040) Pakistan 3Institute of Horticultural Sciences, University of Agriculture, Faisalabad (38040) Pakistan
4Department of Agronomy, University of Agriculture, Faisalabad (38040) Pakistan *Corresponding Author: [email protected]
Copyright © 2014 Horizon Research Publishing All rights reserved.
Abstract
A field experiment was conducted to study the effect of deficit irrigation and mulch levels on soil physical properties and growth and yield of maize crop. The experiment comprised of two irrigation levels, i.e. I1: 558.8 mm and I2: 711.2 mm while two mulch levels, i.e. M0: no mulch and M15: 15 Mg ha-1. Soil samples were collected from 0-10, 10-20, and 20-30 cm depths before sowing and at crop harvest. The samples were analyzed for soil physical, i.e. bulk density, field saturated hydraulic conductivity (mm hr-1), and infiltration rate (mm hr-1) and chemical parameters, i.e. SOC concentration, soil NPK and plant NPK.. The results of this study showed that the maximum increase in plant height (11.39 %), biological yield (29.56 %) and grain yield (35.5 %) was observed with treatment combination I2×M15 as compared to control. In case of soil physical properties, the maximum mean value of infiltration rate and hydraulic conductivity was observed 19.4 and 88.33 mm hr-1 with treatment combination I2×M15, respectively while minimum mean value of infiltration rate and hydraulic conductivity was recorded 12.4 and 32.56 mm hr-1 with treatment combination I1×M0, respectively. Soil bulk density decreased by increasing the mulch rate and minimum value of 1.44 Mg m-3 observed at 0-10 cm depth with treatment combination I2×M15. In case of soil chemical properties, the treatment combination I2×M15 showed highest value of SOC, soil nitrogen, phosphorus and potassium that was 0.55 g kg-1, 0.64 g kg-1, 15.48 ppm and 144.67 ppm, respectively.Keywords
Maize, Soil Prosperities, Irrigation, Mulching, Yield1. Introduction
Maize (Zea mays L.) is an important cereal crop of Pakistan and it has third position in the cereals after wheat and rice. In the Khayber Pakhtunkhwa second most
important crop is maize. According to Agric. Statistics of Pakistan maize growing area is 941.6 thousands ha and total maize production is 1664.4 thousand tones and yield is 1768 kg ha-1 [1].
Deficit irrigation is a technique in which irrigation is done during drought sensitive growth stages of a crop. Outside these periods, irrigation is limited or even unnecessary if rainfall provides a minimum supply of water. Water restriction is limited to drought tolerant phenological stages, often the vegetative stages and the late ripening period. Total irrigation application is therefore not proportional to irrigation requirements throughout the crop cycle. While this inevitably results in plant droughtstress and consequently in production loss, deficit irrigation (DI) maximizes irrigation water productivity, which is the main limiting factor [2]. In other words, DI aims at stabilizing yields and at obtaining maximum crop water productivity rather than maximum yields [3].
The task of increasing food production with less water, particularly in countries with limited water, land resources has become a big challenge for the coming decades due to the serious water shortages [4]. Therefore, to increase the water use efficiency, better techniques are needed. Usually the purpose of irrigation scheduling is to attain an optimum water supply for productivity, with soil water content being controlled near field capacity. The costs of irrigation and increasing worldwide shortages of water are important for developing methods of irrigation that maximize the water use efficiency and minimize water use [5]. Irrigation scheduling is the decision to maximize profit in order to, when and how much water applied to a field. Its aim is to maximize irrigation efficiencies by the application of exact amount of water needed to refill the soil water to the appropriate level, thus save energy and water. By reducing the drainage requirements, the water-logging problems can be minimized and control the salinity problems in root zone through controlled leaching [6, 7].
growth and yield depending on the climatic conditions [8]. At any growth stage water deficiency reduces growth and production of the maize crop [9]. Water stress affects maize yield as much as all other environmental factors combined. It decreases leaf area [10] and plant height [11] by reducing cell division and leaf expansion [12]. A lot of studies have been conducted on maize water requirement and effect of water stress in temperate and semi-arid regions [13]. When the crop is subjected to drought, it causes, lower yield in maize with high dose of nitrogen [14, 15]. Variable supply of water is either due to water shortage or failure in the supply of water at critical crop growth stages in many irrigated areas of the world [16].
Traditional irrigation development model aims at providing sufficient water to crops to avoid water deficits at all stages, so as to achieve maximum yields [17]. Adoption of deficit irrigation requires the knowledge of the response of different crops to water deficit at various growth stages. Reduced yield as the result of deficit irrigation, especially under water limiting situations, may be compensated by increased production from the additional irrigated area with the water saved by deficit irrigation [18].
High sensitivity of maize to water stress means that under water limiting conditions it is difficult to implement irrigation management strategies without incurring significant yield losses [19]. The limited supplies particularly affect field maize due to its relative high water requirements and because it covers large area than any other irrigated crop in the region. Farmers with limited water often have to choose among options such as fully irrigating a portion of the field area or deficit-irrigating a larger crop area or changing to crops that require less water, or investing in more efficient irrigation systems [20].
Water stress on maize has been shown to reduce plant height, leaf area index and root growth [21].It is clear from the literature that termination of irrigation in maize causes significant yield losses. However, the effects of moderate water stress on maize yield, which in practice is more likely to occur in the region as a consequence of an increased interval between irrigations, have been less studied. This type of water deficit in some cases could result in water savings by reducing irrigation water use for little cost in yield [22].
Mulch is one of the management practices which improve the water use efficiency of soil. Any material dispersed on the surface of soil to protect it from solar radiation, evaporation or raindrops is called mulch. Mulching can affect the soil temperature and soil water content [23] and directly affect on the grain yield of crops [24]. Straw mulching systems can conserve soil water and decrease temperature because they increase residue accumulation and reduce soil disturbance on the soil surface [25, 26].
When maintained at sufficient levels, mulches can reduces the rate of evaporation and runoff of water, it increase penetration of rain fall and entrap snow and therefore soil water conservation is higher, compared to other soil in which mulch is not applied. In semi-arid areas where soil
temperature conducive for maize growth, presence of mulch during a growing season may increases the crop yields by conserving the soil water [27]. Mulched maize yield was 17 % more than un-mulched maize, when wheat stubble was removed at maize planting [28].
Mulch can decrease soil temperature and retain better root growth in maize in case of coarse textured soil and grain yield was more in loamy sand than sandy loam soil mulching has potential for increasing soil water storage [28]. Mulch directly influences the grain yield of crops. Soil biota increase under mulched soil environment thereby improving nutrient cycling and organic matter build up over a period of several years [29]. A number of researchers have evaluated the positive effects of irrigation and mulching management under rain-fed farming systems [26].
Keeping in view the above facts, this study has designed objectives to examine the effect of deficit irrigation and mulching material on the growth and yield of maize and to observe the influence of mulching material on soil physical and chemical properties.
2. Materials and Methods
The study was carried out under field condition at the Research Area, Institute of Soil and Environmental Sciences, University of Agriculture, Faisalabad during 2011, to study the ‘Effect of deficit irrigation and mulch on soil physical properties and growth and yield of maize.
Before sowing the crop, composite soil samples were taken at random from the experimental field. The soil samples were air-dried, ground, well mixed and passed through 2mm sieve and analyzed for different physical and chemical characteristics.
2.1. Treatments
There were two irrigation and two mulch levels. i. Irrigation levels:
I1= Irrigation depth 558.8 mm I2=Irrigation depth 711.2 mm ii. Mulch level:
M0= Control (no mulch) M15= Mulch applied @ 15 Mg ha-1
was used according to treatment plan, as and when required during the whole season of crop growth. Wheat straw mulch was applied after the complete germination of maize crop.
Soil physical parameters, i.e. bulk density, infiltration rate, hydraulic conductivity and soil strength and chemical parameters, i.e. N, P, K and SOC concentration were determined at the crop harvest. Yield and yield characteristics of maize, i.e. total biomass, grain yield, plant height, 1000-grain weight, cob length, number of rows per cob and number of grains per cob were recorded. At maturity, plant samples were analyzed for N, P and K concentrations. The data obtained was subjected to statistical analysis by using standard procedures and LSD test was applied to compare the effectiveness of treatments [30].
2.2. Observations 2.2.1. Soil Parameters i. Bulk density (Mg m-3)
ii. Soil organic carbon concentration (g kg-1) iii. Infiltration rate (mm hr-1)
iv. Hydraulic conductivity (mm hr-1) v. Soil strength (kPa)
vi. N, P and K concentration in soil 2.2.2. Plant Parameters
i. Plant height (cm)
ii. Biological yield (Mg ha-1) iii. Grain yield (Mg ha-1) iv. 1000-grain weight (g)
v. Cob length (cm) vi. Number of rows per cob vii. Number of grains per row viii. N, P and K uptake in plants
2.2.3. Water use efficiency (WUE)
WUE= Total biomass (kg ha-1)/ Total water applied in mm
2.3. Analytical Methods
Soil and plant samples were analyzed according to analytical method described by US Salinity Lab. Staff [31], unless otherwise mentioned.
2.3.1. Soil Analysis
2.3.1.1. Particle size analysis
Percentage of sand, silt and clay was determined by Bouyoucos hydrometer methods. Soil (40 g) was soaked over-night with 1 % sodium hexameta-phosphate solution plus distilled water. Then this was dispersed with electrical stirrer, transferred to 1-L graduated cylinder, silt and clay particles (%) was determined by using Bouyoucos hydrometer. Textural class was determined by the International triangle [32].
2.3.1.2. pH of saturated soil paste (pH s)
Saturated paste of soil (300 g) was prepared by adding distilled water (Method 2, p. 84). The saturated paste was allowed to stand as such for overnight and pHs was measured by the model HM – 12 pH meter, by calibrating it with buffer solution of pH 4, 7 and 9.2.
2.3.1.3. Electrical conductivity of saturated soil extracts (ECe)
Clear extract of saturated soil paste was obtained by a vacuum pump. The ECe (dS m-1) was measured by using Jenway Conductivity meter Model-4070 (Method 21a, 21c, p. 102).
2.3.1.4. Total soluble salts (TSS)
The ECe (dS m-1) was converted into TSS (mmolc L-1) in soil following the graph [32].
2.3.1.5. Saturation percentage
A portion of saturated soil paste was transferred to a tarred soil can with lid, weighed and dried to a constant weight at 105 0C, cooled and weighed again (Method -2, 26-27, p. 107).
Water content (%) = (Loss in mass on drying/Mass of oven dry soil) x 100
2.3.1.6. Water Soluble Ions a) Calcium and Magnesium
Soil extract was titrated against 0.01 normal EDTA (Ethylene diamine tetra acetic acid) using Eriochrome Black T indicator in the presence of NH4Cl-NH4OH buffer solution (Method 7, p. 94).
a. Sodium and Potassium
Soluble sodium and potassium ions were determined by using Corning Flame photomerter-410 after calibrating with standard solutions of Na and K (Method 10a and 11a, p. 96-97).
b. Carbonates and Bicarbonates
Soil carbonates and bicarbonates were determined by titrating the soil extract against 0.01 N H2SO4 using phenolphthalein and methyl orange indicators, respectively to colorless and pinkish yellow end point (Method 12, p. 98).
c. Chloride
After carbonates and bicarbonates titration, chloride were determined by titrating the soil extract against 0.005 AgNO3 solution using K2CrO4 as an indicator to brick red end point (Method 13, p. 99).
d. Sulphates
Sulphates were determined by difference method by the following formula:
SO4-2 meq L-1 = (TSS in meq L-1) – (CO3-2 + HCO3-1 + Cl in meq L-1)
2.3.1.7. Organic carbon concentration of soil
sample were taken in a 500 mL beaker and added 10 mL 1 N Potassium dichromate solution. Afterward added 20 mL concentrated sulfuric acid, swirled the beaker to mix the suspention and than allow it to stand for 30 minutes. To it added 200 mL de-ionized water, 10 mL concentrated Orthophosphoric acid, allowed the mixture to cool and added 10-15 drops of Diphenyl amine indicator. Then the contents were titrated with 0.5 M Ferrous ammonium sulphate solution, until the color changed from violet blue to green. Two blank reading were obtained by following above procedure except adding soil.
Calculations
% Oxidizable organic carbon = [(Vblank-Vsample) x 0.3 x M] / [Weight of soil (g)]
% Total organic carbon (w/w) = 1.33 x % Oxidizable organic carbon
M = Molarity of ferrous ammonium sulphate solution Vblank = Volume of ferrous ammonium sulphate solution used
for blank (mL)
Vsample = Volume of ferrous ammonium sulphate solution with soil sample (mL)
2.3.1.8. Soil bulk density
Soil bulk density of 0-30 cm depth was determined. The core sampler was pressed in the soil far enough depth to fill the core. Carefully removed the sampler and trimmed the soil extending out of the core with a sharp knife. Soil was oven dried at 105 0C to a constant weight, cooled and weighed. Soil volume was taken equal to inner volume of core sampler [34].
Bulk density = (mass of oven-dry soil) / (Volume of soil including pore spaces)
2.3.1.9. Infiltration rate
Infiltration rate was measured with double ring infiltrometer. The inner and outer rings were driven 10 cm in to the soil by means of driving plate and impact absorbing hammer. The inner and outer rings were filled with water. The water flows vertically through the inner ring into the soil was noted until constant rate was obtained [36].
2.3.1.10. Field saturated hydraulic conductivity
A uniform debris free well hole was made with help of auger and sizing auger. The Guelph Permeameter (Model 2800 KI) was assembled and installed in the well hole. Three steady-state readings were taken from two depths (5.0 cm and 10.0 cm at constant lead). Field saturated hydraulic conductivitywascalculatedfrom the following formula:
Kfs= (0.0041)(X)(R2) - (0.0054)(X)(R1)
Where R1 = the steady-state rate of fall of water in the reservoir when the first head H1 of water is established, in cm/s.
H1 = the first head of water established in the well hole, in cm.
H2 = the second head of water established in the well hole, in cm.
R2 = the steady-state rate of fall of water in the reservoir when the second head of water is established, in cm/s. X = Reservoir constant, corresponds to the cross sectional area of the combined reservoir expressed in cm2
2.3.1.11. Soil strength
Soil strength was measured with Cone penetrometer. The penetrometer was operated by placing the core on the soil surface with the shaft oriented vertically. The cone was then pressed into the soil until it just becomes buried (i.e. soil surface was level with the base of cone). Then reading was noted. Soil sample for water content were also taken, and then correlated to force applied. Each plot was repeated three times.
2.3.1.12. Total nitrogen
Ten gram of soil was added in 40 mL of concentrated H2SO4 plus 10 g of digestion mixture (K2SO4:FeSO4:CuSO4, 10:1:0:5)and then digested the material using the Kjeldahl digestion method. Ten mL of aliquot was taken from 250 mL of digested material and distillation was carried out with micro Kjeldahl apparatus. The NH3 evolved was absorbed in a receiver containing 4 % Boric acid solution and mixed indicator (Bromocresol green and methyl red). After distillation, the contents of receiver were titrated against 0.1 N H2SO4 [37] and N was calculated by the following formula:
2.3.1.13. Extractable phosphorus
Five gram of soil sample was extracted with the sodium bicarbonate solution while shaking on mechanical shaker. Then 2 mL of aliquot was taken and put in 50 mL flask, add 8 mL of color developing reagent and make the volume up to the mark (Ascorbic acid, Ammonium molybdate, Potassium antimony tartrate and suphuric acid). After 30 minutes reading was recorded on ANA-703 Spectrophotometer at a wavelength of 880 nm [37].
2.3.1.14. Extractable potassium
Extraction was made by ammonium acetate solution and extractable K was determined by PEP-70 Flame photometer after standardizing with K standard solutions (Method 58a: p. 132).
2.3.2. Plant Analysis
At maturity, the harvesting was done on an area of 1 m2 per plot. The fresh weight was determined in the field; an aliquot was randomly taken for the determination of dry matter and for nitrogen analysis. The samples of grains and straws were kept at 65 0C for 48 hrs in an electric oven and then their weight was obtained. The concentration of N, P and K in grain and straw were analyzed as under:
The plant samples were digested by following method of Moore and Chapman (1986). For this purpose digestion mixture was prepared. Added 0.42 g Se and 14 g of Li2SO4.H2O to 350 mL of 100 % pure H2O2. Mixed well and added 420 mL of concentrated H2SO4 with care. Cooled the mixture during addition of the acid. Weighed 0.4 g of dry ground plant sample into a suitable Kjeldahl flask. Added 4.4 mL of digestion mixture. Digested at low heat until the initial reaction subsides avoiding loss of H2SO4 fumes. Continued the digestion until a clear and almost colorless solution is obtained. For most of the samples this requires about 2 hours. Then diluted the sample five folds.
2.3.2.2. Nitrogen determination
Dried and powdered plant material (1 g) was digested using 30 mL of H2SO4 and 8 g of digestion mixture. Ten mL aliquot from 100 mL digested material was taken from the distillation in the micro Kjeldahl apparatus. Nitrogen evaluated as ammonia was collected in a receiver containing Boric acid (4 %) solution and mixed indicator (Bromocresol green and methyl red) and titrated against 0.1 N H2SO4 to pink end point [37].
2.3.2.3. Phosphorus determination
Plant samples were digested in an acid mixture of HNO3 and HCIO4. Then phosphorus was determined by developing color with reagent (Ammonium molybdate, Ammonium vanadate and Nitric acid). The phosphorus was determined with an ANA-730 Spectrophotometer at 470 nm after calibrating with P standards (Method 61: p. 134).
2.3.2.4. Potassium determination
Potassium was determined by Corning Flame photometer-410 after calibrating the instrument with K standards (Method 58: p. 132).
2.4. Agronomic Parameters 2.4.1. Plant height (cm)
Plant height was measured with a meter tape at 10 random sites in each plot and their average was calculated.
2.4.2. Grain yield (Mg ha-1)
The cobs were removed from the plants from each plot, unsheathed, sun-dried for one week, shelled and weighed and then converted on hectare basis.
2.4.3. 1000-grain weight (g)
One thousand grains were taken at random from the grain lot of each plot and weighed with the help of electronic balance.
2.4.4. Cob length (cm)
Ten cobs were taken from each plot, their length was measured using measuring tape and average was calculated. 2.4.5. Number of rows per cob
Ten cobs were taken at random from each plot and number of grain rows counted and their average was calculated. 2.4.6. Number of grains per cob
Ten cobs were taken at random from each plot and counted the number of grains per row and average was calculated accordingly.
2.5. Statistical Analysis
Statistical analysis of the data was carried out using RCBD split plot design. The comparisons among treatment means were made according to appropriate test [30].
3. Results
3.1. Agronomic Parameters
3.1.1. Effect of irrigation and mulch on plant height (cm) of maize
Plant growth is generally measured in term of plant height. The data shows that the irrigation had significant effect on plant height shown in Table-2. As regards the irrigation, mean maximum value of plant height (229.38 cm) was observed in I2 and minimum (222.92 cm) was in case of treatment I1. The mulch also had significant effect on plant height as shown in Table-3 and the mean maximum value of plant height (235.20 cm) was found in treatment M15 where straw was applied @ 15 Mg ha-1 and minimum (217.90 cm) was in M0 (control).
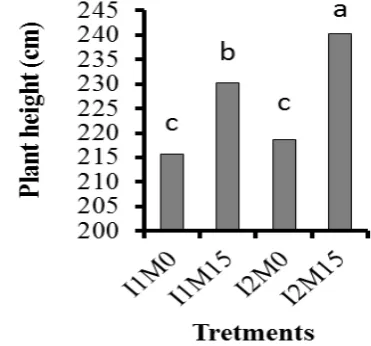
The data presented in Fig. 1 revealed that the combined effect of irrigation and mulch had non significant effect on plant height yet treatment I2 x M15 being the most effective. The mean maximum value of plant height (240.18 cm) was observed with treatment combination I2 x M15 followed by 230.23 Mg ha-1 in case of I
[image:5.595.332.518.554.727.2]1 x M15 and minimum value of plant height (215.60 cm) was observed in I1 x M0 combination.
Table 1. Effect of irrigation on agronomic parameters in maize
Plant height (cm) Biological yield (Mg/ha) Grain yield(Mg/ha) No.of rows/cob Grains/row Cob length (cm) 1000-grain weight (g)
I1 222.92 B 9.73 B 2.7 B 14.9 A 36 B 14.4 A 271.5 B
I2 229.38 A 12.75 A 3.8 A 15.3 A 38 A 14.8 A 307.0 A
LS
D 8.253 1.030 0.653 1.652 2.303 1.742 12.364
[image:6.595.50.566.196.265.2] [image:6.595.360.505.437.582.2]Means with in columns for each treatment followed by the same letter are not significantly different at α = 0.05.
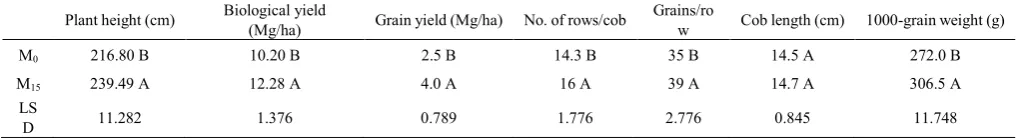
Table 2. Effect of mulch on agronomic parameters in maize
Plant height (cm) Biological yield (Mg/ha) Grain yield (Mg/ha) No. of rows/cob Grains/row Cob length (cm) 1000-grain weight (g)
M0 216.80 B 10.20 B 2.5 B 14.3 B 35 B 14.5 A 272.0 B
M15 239.49 A 12.28 A 4.0 A 16 A 39 A 14.7 A 306.5 A
LS
D 11.282 1.376 0.789 1.776 2.776 0.845 11.748
Means with in columns for each treatment followed by the same letter are not significantly different at α = 0.05.
3.1.2.NE ffect of irrigation and mulch on biological yield (Mg ha-1) in maize
The data related to biological yield of maize are shown in Table 2 and 3. This revealed that irrigation and mulch rates had significant effect on biological yield of maize crop. As regard irrigation levels, the mean maximum value of biological yield was 12.75 Mg ha-1 recorded in case of treatment I2 and minimum (9.73 Mg ha-1) was found in treatment I1. In case of mulch rates, the mean maximum value (12.28 Mg ha-1) was found in treatment M
15 and minimum (10.20 Mg ha-1) was recorded in M
0, i.e. control. The interactive effects between irrigation and mulch was significant (Fig. 2) and mean maximum value of biological yield (14.13 Mg ha-1) was observed with treatment combination I2 x M15 followed by 11.36 Mg ha-1 in case of I2 x M0 and minimum value of biological yield (9.03 Mg ha-1) was observed in I1 x M0 treatment combination.
Figure 2. Effect of irrigation and mulch on biological yield (Mg ha-1) in maize
3.1.3. Effect of irrigation and mulch on grain yield (Mg ha-1) of maize
Data presented in Table 1 and 2 shows that irrigation and mulch rates had significant effect on grain yield of maize crop. Regarding the irrigation effect on grain yield, the mean
maximum value (3.81 Mg ha-1) of grain yield was recorded in case of treatment I2 and minimum (2.77 Mg ha-1) was found in treatment I1. In case of mulch rates, the mean maximum value (4.00 Mg ha-1) of grain yield was observed in treatment M15 and minimum (2.59 Mg ha-1) was found in case of treatment M0.
It is revealed from the data that the interactive effects between irrigation and mulch was significant (Fig. 3) and mean maximum value of grain yield 4.75 Mg ha-1 was observed with treatment combination I2 x M15. Next to this, treatment combinations I1 x M15, I2 x M0 and I1 x M0 showed grain yields of 3.25, 2.88 and 2.3 Mg ha-1, respectively.
Figure 3. Effect of irrigation and mulch on grain yield (Mg ha-1) of maize
3.1.4. Effect of irrigation and mulch on number of rows per cob in maize
[image:6.595.95.261.503.654.2]per cob was observed in M15 treatment and minimum of 14.36 rows per cob was in case of control. Interaction of irrigation and mulch shows that treatment combination I2 x M15 showed maximum number of rows per cob, that was 16 (18.71 % more over control) and minimum 14 (4.56 % less than control) was in treatment combination I1 x M0 (Fig. 4).
Figure 4. Effect of irrigation and mulch on number of rows per cob in maize
3.1.5. Effect of irrigation and mulch on number of grains per row in maize
It evident from data listed in Table 2 and 3 that the effect of irrigation and mulch rates on number of grains per row in maize crop was significant. Statistical analysis (ANOVA) revealed that the mulch had significantly affected the number of grains per rows. But mulch and their interaction is statistically non-significant. As regards irrigation levels, the mean maximum value of 38 number of grains per row was observed in treatment I2 and minimum, i.e. 36 was noted in I2 treatment. In case of mulch, the mean maximum value of 39 grains per row was observed in M15 treatment and minimum of 35 grains per row was observed in case of treatment M0. Interaction of irrigation and mulch showed that treatment combination I3 x M3 showed maximum number of 40 grains per row (Fig. 5) that was 34.15 % more as compare to control. Next to this, treatment combinations I1 x M15, I2 x M0 and I1 x M2 showed 38, 36 and 34 number of grains per row, respectively.
Figure 5. Effect of irrigation and mulch on number of grains per row in maize
3.1.6. Effect of irrigation and mulch on cob length (cm) in maize
The data pertaining to the effect of irrigation and mulch on cob length are given in Table 1 and 2. The data shows that both the irrigation and mulch had non-significant effect on cob length. As regards the irrigation levels, mean maximum values of 14.8 cm cob length was measured in treatment I2, followed by I1 treatment which showed 14.4 cm cob length. The mean values show that there is no significant effect on cob length under different irrigation levels. As regards the mulch, the mean maximum value of 14.7 cm cob length was observed in case of treatment M15 and minimum of 14.5 cm cob length was noted in case of control treatment M0.
[image:7.595.344.514.306.458.2]The interactive effects between irrigation and mulch was statistically non significant but there was mean maximum value of 14.96 cm cob length in treatment combination I2 x M15 (Fig. 6) and minimum (14.13 cm) was found in I1 x M1 treatment combination.
Figure 6. Effect of irrigation and mulch on cob length (cm) in maize
3.1.7. Effect of irrigation and mulch on 1000-grain weight (g) in maize
Data regarding effect of irrigation and mulch on 1000-grain weight is given in Table 1. Statistically both irrigation levels and mulch rates had significant effect on 1000-grain weight of maize crop. As regards irrigation, the mean maximum value, i.e. 307.0 g 1000-grain weight was observed in treatment I2 and minimum of 271.50 g was in treatment I1. In case of mulch, the maximum value, i.e. 306.50 g 1000- grain weight was observed in treatment M15 and minimum of 272.0 g was observed in M0 treatment. Due to the application of mulch the 1000-grain weight was increased and in case of M15, 1000-grain weight increased 9.6 % over control.
[image:7.595.100.256.581.726.2]Figure 7. Effect of irrigation and mulch on 1000-grain weight (g) in maize
3.2. Water Use Efficiency and Soil Physical Parameters 3.2.1. Effect of irrigation and mulch on water use efficiency
(kg/ha/mm) in maize
Data regarding the effect of irrigation and mulch on water use efficiency are given in Table 3 and 4, which revealed that irrigation and mulch had significant effect on water use efficiency of maize crop. As regard irrigation levels, the mean maximum value of 2.68 kg ha-1 mm-1 water use efficiency was recorded in treatment I1 and minimum of 20.8 kg ha-1 mm-1 was in I
2 treatment. As regard mulch rates, the mean maximum value of 24.3 kg ha-1 mm-1 water use efficiency was measured in case of treatment M15 and minimum of 23.3 kg ha-1 mm-1 water use efficiency was noted in treatment M0. Mulch reduced the evaporation losses and improved WUE.
[image:8.595.343.515.335.504.2]It is revealed from the data presented in Fig. 8 that the interactive effects between irrigation and mulch was significant on WUE and treatment combination I1 x M15 showedmean maximum value of water use efficiency 28.4 kg ha-1 mm-1 (40.87 % more over control). Next to this, treatment combinations I1 x M1, I2 x M0 and I2 x M15 showed 25.1, 21.5 and 20.16 kg ha-1 mm-1, respectively.
Figure 8. Effect of irrigation and mulch on water use efficiency (kg/ha/mm) in maize
3.2.2. Effect of irrigation and mulch on infiltration rate (mm hr-1) at maize harvest
Data regarding the effect of irrigation and mulch on infiltration rate of soil at harvest of maize crop is presented in Table 3 and 4. Statistical analysis (ANOVA) revealed that the mulch had significantly affected the infiltration rate while irrigation effect was non significant. As regard irrigation, the mean maximum value of 16.3 mm hr-1 infiltration rate was observed in treatment I2 and minimum of 15.5 mm hr-1 was noted in I
1 treatment. In case of mulch, the mean maximum value of 19.4 mm hr-1 was observed in treatment M15 (57.02 % more over control) and minimum of 12.4 mm hr-1 was noted in case of M
0, i.e. control.
As regard the interactive effects between irrigation and mulch, the mean maximum value of infiltration rate (19.80 mm hr-1) was observed in treatment combination I
2 x M15 (Fig. 9). The treatment combinations viz. I1 x M15 and I2 x M1 gave the increase in infiltration rate by 41.6 and 17.6 % over control, respectively.
Figure 9. Effect of irrigation and mulch on infiltration rate (mm hr-1) at maize harvest
3.2.3. Effect of irrigation and mulch on field saturated hydraulic conductivity (mm hr-1) at maize harvest The data pertaining to effect of irrigation and mulch on field saturated hydraulic conductivity of soil at harvest of maize crop are presented in Table 3 and 4. The data showed that both irrigation and mulch had significant effect on field saturated hydraulic conductivity. In case of irrigation, mean maximum value of 64.5 mm hr-1 hydraulic conductivity was observed in treatment I2 (35.04 % more over control) and minimum of 45.6 mm hr-1 was noted in I
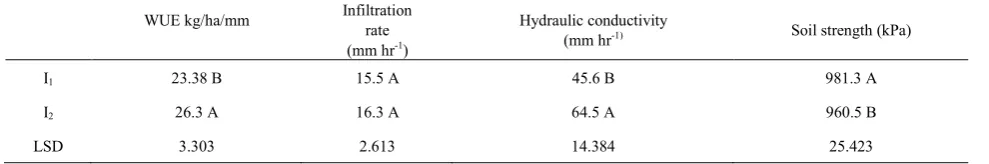
[image:8.595.100.258.539.697.2]Table 3. Effect of irrigation on WUE and soil physical quality parameters
WUE kg/ha/mm Infiltration rate (mm hr-1)
Hydraulic conductivity
(mm hr-1) Soil strength (kPa)
I1 23.38 B 15.5 A 45.6 B 981.3 A
I2 26.3 A 16.3 A 64.5 A 960.5 B
LSD 3.303 2.613 14.384 25.423
[image:9.595.62.547.210.290.2]Means with in columns for each treatment followed by the same letter are not significantly different at α = 0.05
Table 4. Effect of mulch on WUE and soil physical quality parameters
WUE kg/ha/mm Infiltration rate (mm hr-1)
Hydraulic conductivity
(mm hr-1) Soil strength (kPa)
M0 23.3 B 12.4 B 36.6 B 1060.7 A
M15 24.3 A 19.4 A 73.5 A 881.2 B
LSD 2.776 2.346 13.928 22.532
Means with in columns for each treatment followed by the same letter are not significantly different at α = 0.05.
The data presented in Fig. 10 showed that interactive effects between irrigation and mulch have non-significant effect on Kfs. The mean maximum value of field saturated hydraulic conductivity 88.33 mm hr-1 was observed in treatment combination I2 x M15 followed by 58.70 mm hr-1 in case of I1 x M2 and minimum value of field saturated hydraulic conductivity (32.56 mm hr1) was observed in treatment combination I1 x M0.
Figure 10. Effect of irrigation and mulch on field saturated hydraulic conductivity (mm hr-1) at maize harvest
3.2.4. Effect of irrigation and mulch on soil strength (kPa) The data regarding the soil strength as affected by irrigation and mulching at harvest of maize is presented in Table 4 and 5. There is significant effect of mulching on soil strength due to lower soil bulk density which lowers the penetration resistance in the soil. As regard irrigation, mean maximum value (981.3 kPa) of soil strength was observed in treatment I1 and minimum (960.5 kPa) was noted in treatment I2. In case of mulch application, the mean maximum value (1060.7 kPa) of soil strength was observed in M0 and minimum (881.2 kPa) was found in treatment M15. Data given in Fig. 11 revealed that at the harvest of maize
crop less penetration resistance was observed with treatment combination I2 x M15 (891.3 kPa). More penetration resistance was observed in treatment combination I1 x M0 due to less moisture contents. Due to lower water contents soil become compact and hard.
Figure 11. Effect of irrigation and mulch on soil strength (kPa)
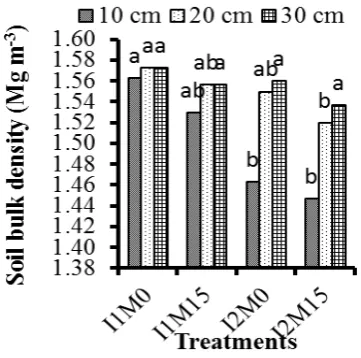
3.2.5. Effect of irrigation and mulch on soil bulk density(Mg m-3) at maize harvest
Data related to effect of irrigation and mulch on soil bulk density at 0-10 cm depth after harvesting of maize crop are given in Table 5 and 6. Statistical analysis clearly indicated that the irrigation had significant effect on bulk density of soil. As regard irrigation levels, the mean maximum value of 1.54 Mg m-3 soil bulk density was observed in treatment I
1 and minimum of 1.45 Mg m-3 soil bulk density was in case of treatment I2. In case of mulch rates, the mean maximum value 1.51 Mg m-3 of soil bulk density was observed in M
0 and minimum (1.48 Mg m-3) was noted in M
[image:9.595.360.508.380.534.2] [image:9.595.99.255.417.572.2]by 1.53 Mg m-3 in case of treatment combination I
[image:10.595.313.553.88.163.2]1 x M15 and minimum value of soil bulk density 1.44 Mg m-3 was observed in case of I2 x M15 combination. The data regarding interaction of irrigation and mulch is presented graphically in Fig. 12.
Figure 12. Effect of irrigation and mulch on soil bulk density (Mg m-3) at maize harvest
At 10-20 cm depth, effect of both irrigation and mulch on soil bulk density was found statistically non significant. As regard the irrigation, the mean maximum value of 1.56 Mg m-3 soil bulk density was observed in treatment I
1 and minimum of 1.53 Mg m-3 was found in treatment I
2. In case of mulch rates, the mean maximum value (1.56 Mg m-3) of soil bulk density was reported in M0 and minimum (1.53 Mg m-3) was noted in treatment M
15.
In case of interaction, the mean maximum value of soil bulk density 1.57 Mg m-3 was observed in case of treatment combination I1 x M0 and minimum value of soil bulk density 1.52 Mg m-3 was observed in case of I
2 x M15 combination. Bulk density reduced due to mulch because of decomposition on mulch soil improved by aggregation and soil porosity increased. So due to porosity, bulk density at soil surface reduced. Irrigation had no effect on bulk density. At 20-30 cm depth, effect of irrigation on soil bulk density was found statistically non significant and effect of mulch was significant. As regard irrigation, the mean maximum value of 1.56 Mg m-3 soil bulk density was observed in treatment I1 and minimum 1.55 Mg m-3 was noted in treatment I2. In case of mulch rates, the mean maximum value (1.56 Mg m-3) of soil bulk density was reported in treatment M0 and minimum (1.54 Mg m-3) of soil bulk density was observed in treatment M15.
In case of interaction, the mean maximum value of soil bulk density 1.57 Mg m-3 was observed in case of treatment combination I1 x M0 followed by 1.56 Mg m-3 in case of treatment combination I2 x M0 and minimum value of soil bulk density 1.53 Mg m-3 was observed in case of I
2 x M15 combination. Mulching increased organic matter contents and soil moisture leading to appropriate environment for root penetration.
Table 5. Effect of irrigation and mulch on soil bulk density
Irrigation level Bulk density (Mg m-3)
0-10 (cm) 10-20 (cm) 20-30 (cm)
I1 1.54 A 1.56 A 1.56 A
I2 1.45 B 1.53 A 1.55 A
LSD 0.0703 0.0563 0.0236
[image:10.595.87.268.143.322.2]Means with in columns for each treatment followed by the same letter are not significantly different at α = 0.05.
Table 6. Effect of irrigation and mulch on soil bulk density
Mulch rates Bulk density (Mg m-3)
0-10 (cm) 10-20 (cm) 20-30 (cm)
M0 1.51 A 1.56 A 1.56 A
M15 1.48 A 1.53 A 1.54 A
LSD 0.0876 0.0283 0.0283
Means with in columns for each treatment followed by the same letter are not significantly different at α = 0.05.
3.3.1. Effect of irrigation and mulch on soil organic carbon concentration (g kg-1) at harvest of maize
The data pertaining to the effect of irrigation and mulch on soil organic carbon concentration at harvest of maize is given in Table 7 and 8. As regard irrigation, there was non significant effect on SOC concentration. The mean maximum value 5.70 g kg-1 of SOC was observed in treatment I2 and minimum 5.01 g kg-1 was noted in I1 treatment. At the harvest of maize crop, statistically more SOC concentration was observed with treatment M15 (5.96 g kg-1) and least with treatment M
0 (4.83 g kg-1).
The interactive effect of irrigation level with mulch at 0-10 cm depth of soil organic carbon was found statistically non significant. However, the mean maximum SOC concentration at maize harvest (6.5 g kg-1) was observed in treatment combination I2 x M15 while I1 x M15 showed 5.43 g kg-1 and was second best treatment. Minimum SOC concentration of 4.76 g kg-1 was observed in case of I
1 x M0 at 0-10 cm depth (Fig.13).
Figure 13. Effect of irrigation and mulch on soil organic carbon concentration (g kg-1) at harvest of maize
[image:10.595.312.552.205.280.2] [image:10.595.356.504.551.694.2]of SOC concentration was measured in treatment M15 and minimum (1.64 g kg-1) was observed in treatment M
0. As regard irrigation, there was non significant effect on SOC concentration yet the mean maximum value (2.45 g kg-1) of SOC was observed in treatment I2 and minimum (2.14 g kg-1) was noted in I1 treatment.
Interaction of mulch and irrigation levels also showed non significant effect on SOC at 10-20 cm depth. The I2 x M15 proved to be the best treatment combination regarding SOC concentration, yielding mean maximum SOC concentration that showed 3.26 g kg-1. It was followed in descending order by treatment combinations I1 x M15, I2 x M0 and I1 x M0 which increased SOC concentration (g kg-1) by 2.65, 1.65 and 1.63 g kg-1, respectively at 10-20 cm depth (Fig. 13).
At 20-30 cm depth, effect of irrigation levels and mulch was significant on SOC concentration. As regard irrigation levels, the mean maximum value of 1.61 g kg-1 SOC was observed in treatment I2 and minimum 1.10 g kg-1 was noted in treatment I1.
In case of mulch, the mean maximum value of 2.10 g kg-1 SOC was measured in treatment M3 and minimum (0.61 g kg-1) was noted in M
0 treatment.
[image:11.595.312.552.90.160.2]The interactive effect of irrigation levels with mulch was also significant. The SOC concentration at 20-30 cm was greater with I2 x M15 treatment combination. Treatment combination I2 x M15 gave mean maximum value of soil organic carbon of 2.55 g kg-1. Minimum SOC was found in treatment combination I1 x M0, i.e. 0.55 g kg-1 (Fig. 13).
Table 7. Effect of irrigation on soil organic carbon concentration
Irrigation level Soil organic carbon (g kg-1)
0-10 (cm) 10-20 (cm) 20-30 (cm)
I1 5.1000 B 2.1400 B 1.1017 A
I2 5.7000 A 2.9683 A 2.1000 B
LSD 1.8303 0.8313 0.3683
[image:11.595.343.514.414.568.2]Means with in columns for each treatment followed by the same letter are not significantly different at α = 0.05.
Table 8. Effect of mulch on soil organic carbon concentration Mulch rates Soil organic carbon (g kg-1)
0-10 (cm) 10-20 (cm) 20-30 (cm)
M0 4.833 B 1.6400 B 0.6117 B
M15 5.9667 A 2.9683 A 2.1000 A
LSD 1.576 0.7193 0.1634
Means with in columns for each treatment followed by the same letter are not significantly different at α = 0.05.
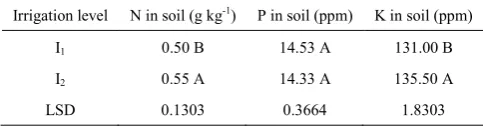
Table 9. Effect of irrigation on soil macronutrient (NPK) status
Irrigation level N in soil (g kg-1) P in soil (ppm) K in soil (ppm)
I1 0.50 B 14.53 A 131.00 B
I2 0.55 A 14.33 A 135.50 A
LSD 0.1303 0.3664 1.8303
[image:11.595.59.298.435.512.2]Means with in columns for each treatment followed by the same letter are not significantly different at α = 0.05.
Table 10. Effect of mulch on soil macronutrient (NPK) status
Mulch rates N in soil (g kg-1) P in soil (ppm) K in soil (ppm)
M0 0.46 B 13.39 B 126.33 B
M15 0.58 A 15.46 A 140.17 A
LSD 0.1576 0.7762 2.7376
Means with in columns for each treatment followed by the same letter are not significantly different at α = 0.05
3.3.2. Effect of irrigation and mulch on soil nitrogen (g kg-1) The data related to effect of irrigation and mulch on N concentration is shown in Table 9 and 10 and there was significant effect of mulching on nutrient status. As regard irrigation, the mean maximum value 0.55 g kg-1 of soil nitrogen war observed in treatment I2 and minimum 0.50 g kg-1 was in treatment I
1. In case of mulch, the mean maximum value 0.58 g kg-1 of soil nitrogen was reported in treatment M15 and minimum 0.46 g kg-1 was noted in treatment M0. Due to mulching nitrogen losses reduced and also its amount increased within the soil because of decomposition of straw mulch.
There was also significant effect of their interaction on soil nitrogen. The mean maximum value 0.64 g kg-1 of soil nitrogen was found in that treatment combination I2 x M15 where straw was applied @ 15 Mg ha-1 and that is 50 % more than control and minimum value of soil nitrogen 0.46 g kg-1 was observed in case of I1 x M0 (Fig 14).
Figure 14. Effect of irrigation and mulch on soil nitrogen (g kg-1)
3.3.3. Effect of irrigation and mulch on soil phosphorus (ppm)
The data related to effect of irrigation and mulch on phosphorus concentration is given in Table 9 and 10. As regard irrigation, the mean maximum value 14.53 ppm of soil phosphorus was observed in treatment I2 and minimum 14.32 ppm was found in treatment I1. In case of mulch, the mean maximum value 15.46 ppm of soil phosphorus was observed in case of treatment M15 and minimum 13.35 ppm was in M0, i.e. control treatment.
[image:11.595.57.297.553.629.2] [image:11.595.56.298.673.736.2]was found in treatment combination I1 x M0 that was 13.22 ppm (Fig. 15).
Figure 15. Effect of irrigation and mulch on soil phosphorus (ppm
3.3.4. Effect of irrigation and mulch on soil potassium (ppm) The data related to effect of irrigation and mulch on potassium concentration is presented in Table 10 and 11. As regard irrigation, the mean maximum value 135.50 ppm of soil potassium was observed in treatment I2 and minimum 131.08 ppm was noted in treatment I1. In case of mulch, the mean maximum value 140.17 ppm of soil potassium was observed in treatment M15 and minimum 126.33 ppm of soil potassium was found in M0 treatment.
[image:12.595.106.253.109.264.2]But in case of interaction, irrigation and mulch had significant effect on soil potassium concentration and data is shown graphically in Fig. 16. Mean maximum value of soil potassium was found in treatment combination I2 x M15 that was 144.67 ppm (13.55 % more over control) and minimum value was 126.33 ppm soil potassium found in treatment combination I1 x M0.
Figure 16. Effect of irrigation and mulch on soil potassium (ppm)
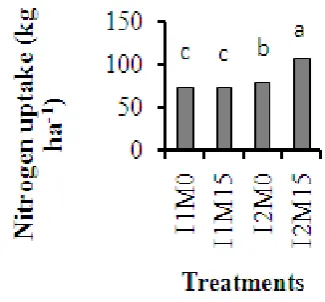
3.3.5. Effect of irrigation and mulch on nitrogen uptake by maize
The data related to effect of irrigation and mulch on N, P and K uptake by maize plant is listed in Table 11 and 12. Mulch and irrigation has significant effect on nitrogen uptake by maize plant. Interaction of irrigation and mulch also was significant on nitrogen uptake by plant. As regard
irrigation, the mean maximum value 91.71 kg ha-1 of N uptake by maize crop was observed in treatment I2 and minimum 71.87 kg ha-1 of N uptake by maize crop was noted in treatment I1. In case of mulch, the mean maximum value 88.79 kg ha-1 of N uptake by maize crop observed in M
15 treatment and minimum 74.79 kg ha-1 was found in case of treatment M0.
In case of interaction, the mean maximum value of N uptake was found in treatment combination I2 x M15 that was 105 kg ha-1 which was 15.68 % more over control. Next to this treatment combinations I2 x M0 and I1 x M15 showed 78.28 and 72.44 kg ha-1, respectively and minimum nitrogen uptake in case of I1 x M0 that is 71.32 kg ha-1 (Fig. 17).
[image:12.595.349.512.240.391.2]Figure 17. Effect of irrigation and mulch on nitrogen uptake by maize
Table 11. Effect of irrigation on NPK uptake by maize crop Irrigation
level N uptake (kg ha-1) P uptake (kg ha-1) K uptake (kg ha-1)
I1 71.87 B 31.01 A 131.48 B
I2 91.71 A 31.61 A 137.58 A
LSD 4.433 1.648 2.303
Means with in columns for each treatment followed by the same letter are not significantly different at α = 0.05.
Table 12. Effect of mulch on NPK uptake by maize crop Mulch
rates N uptake (kg ha-1) P uptake (kg ha-1) (kg haK uptake -1)
M0 74.79 B 28.05 B 129.53 B
M15 88.79 A 34.58 A 139.53 A
LSD 4.984 1.646 2.776
Means with in columns for each treatment followed by the same letter are not significantly different at α = 0.05.
3.3.6 Effect of irrigation and mulch on phosphorus uptake by maize
[image:12.595.312.553.430.503.2] [image:12.595.102.255.496.645.2] [image:12.595.311.552.547.619.2]observed in treatment M15 and minimum 28.05 kg ha-1 was noted in treatment M0.
In case of interaction of irrigation and mulch, there was non significant effect on P uptake. The mean maximum value 34.17 kg ha-1 of P uptake by maize was observed in treatment combination I2 x M15 and minimum 27.58 kg ha-1 was observed in treatment combination I1 x M0 of control (Fig.18).
Figure 18. Effect of irrigation and mulch on phosphorus uptake by maize
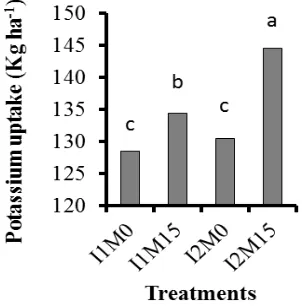
3.3.7. Effect of irrigation and mulch on potassium uptake by maize
The data presented in Table 11 and 12 revealed that both mulch and irrigation has significant effect on K uptake by maize crop and their interactions were also significant. As regard irrigation, the mean maximum value 137.58 kg ha-1 of K uptake by maize crop was observed in treatment I2 and minimum 131.48 kg ha-1 of K uptake by maize crop was in treatment I1. In case of mulch, the mean maximum value 139.53 kg ha-1 of K uptake by maize crop observed in case of treatment M15 and minimum 129.53 kg ha-1 was noted in treatment M0.
In case of interaction, the mean maximum value of K uptake was found in treatment combination I2 x M15 that was 144.61 kg ha-1 while treatment combinations I
1 x M0 and I2 x M0 showed 128.52 and 130.55 kg ha-1 (Fig. 19), respectively.
Figure 19. Effect of irrigation and mulch on potassium uptake by maize
4. Discussion
The height of maize plant was more where more irrigation depth and high mulch rates were applied because of improved availability of water contents for plant growth. These results were in agreement with those of Wicks [38] who concluded that with increasing the mulch levels the maize height enhanced. Similarly, Ahmad [39] noted that the plant height increased with increasing wheat straw rate from 1 to 4 t ha-1 compared with control. This showed that plant height was directly proportional to the mulching material.
Mulch enhanced the soil physical properties through aggregation. Our results are similar to those of Khurshid [42] who revealed that mulch had significantly affected the growth of crop and physical properties of soil. Similarly, Bhardwaj and Sindhwal [42] reported that the addition of mulch resulted in significant increase in soil water contents and reduced runoff. The increase in soil water was effective in ensuring better germination and higher yield.
Nutrients were available to plant roots in presence of moisture, leading to higher grain yield. Our results coincide with those of Liu [43] who reported that mulch increases the soil moisture and nutrients availability to plant roots, in turn, leading to higher grain yield. Also mulch increased grain yield by 17 % and above ground biomass by 19 % (Tolk et al
[44] Similarly, Chaudhary et al. [45] examined the effect of three rates of mulches, i.e. 2, 4 and 6 tones ha-1 and noted that mulch application appreciably improved the grain and straw yields.
Results are in line with those of Wajid [36] who reported that plant height, number of grains per cob, number of cobs per plant, grain yield, mean grain weight and harvest index were significantly affected by the irrigation levels and mulching materials.
The number of grains per row is increased with decreasing irrigation depth and mulch rates. These results were in agreement with those of Oktem et al. [37] who studied the influence of deficit irrigation on drip irrigated maize in 1998 and 1999. Water was applied to maize as 100, 90, 80 and 70 % evaporation from a Class A pan (Epan). Applied irrigation water was 610-816 mm and 715-879 mm in 1998 and 1999, respectively. Number of kernels per ear, ear length and single fresh ear weight values were the highest at 100 % Epan, whereas minimum was found at 70 % Epan in both the years.
[image:13.595.100.252.184.349.2] [image:13.595.103.254.582.736.2]both 1998 and 1999 years.
Due to presence of more moisture in higher irrigation depth and higher mulch rates and also their interaction, the size of grains increased so grain weight increased. Our results coincide with those of Khurshid et al. [42] who reported that mulch had significantly affected the physical properties of soil and growth of crop. The soil water contents and 1000-grain weight of maize were highest when mulch was applied at the rate of 12 Mg ha-1.
Similar findings were reported by Wajid [34] who reported that plant height, grains per cob, number of cobs per plant, grain yield, mean grain weight and harvest index were influenced significantly by the irrigation frequencies and mulching materials but had non significant effect on cob length. Similarly, Oktem et al.[35] who reported the influence of deficit irrigation on drip irrigated sweet corn in 1998 and 1999. Water was applied to sweet corn as 100, 90, 80 and 70 % evaporation from a Class A pan (Epan). Plant height, single fresh cob weight, ear length and number of kernels per ear values were the maximum at 100 % Epan, whereas lowest values were found at 70 % Epan, during the both 1998 and 1999 years.
Due to presence of more moisture in higher irrigation depth and higher mulch rates and also their interaction, the size of grains increased so grain weight increased. Our results coincide with those of Khurshid et al. [42] who reported that mulch had significantly affected the physical properties of soil and growth of crop. The soil water contents and 1000-grain weight of maize were highest when mulch was applied at the rate of 12 Mg ha-1.
The mulching materials on the soil surface act as a shade, serve as a barrier against moisture loss from the soil. By reducing the irrigation depth and application of mulch, the evaporation losses reduced so that WUE was increased. Our findings are in line with those of Oweis et al. [46]. They reported that the straw mulching reduced soil evaporation by 43 mm for maize and WUE was improved by over 10 %. These results indicate that the water use efficiency increased with the decrease in irrigation depth applied. Similarly, Mulumba and Lal [32] confirmed that mulch rates significantly increased available water use efficiency by 17-36 % and soil moisture retention at low suctions from 28 to 70 %. At high suctions, no differences in soil moisture content were observed between mulch levels.
These results confirm the findings of Gurpeet et al. [47] who reported that increased carbon content of the soil due to mulching increased the aggregation status and infiltration rate of soil. Moreover, mulches increased infiltration rate and water in the rhizosphere, improved macro-porosity and structure of soil along with reducing runoff and evaporation losses [48].
These results corroborate the findings of Canqui and Lal [49] who reported that mulching significantly impacted hydraulic conductivity properties of soil. Mulched treatment had Ksat 123 time’s greater and retained 40 to 60 % more water between 0 and -1500 kPa than the unmulched treatment.
Our findings are in line with those of Pervaiz et al. [50] who concluded that mulch increase soil organic matter and soil moisture contents but decreased soil strength and bulk density compared to control.
Mulching increased organic matter contents and soil moisture leading to appropriate environment for root penetration. Similarly, Ghuman et al [51] concluded that mulching decreases bulk density of the surface soil. Pervaiz
et al. [50] also concluded that mulch increased moisture contents (17 %) and soil organic matter (1.32 g kg-1), but decreased soil strength (464 kPa) and bulk density (1.35 Mg m-3) compared to control.
The SOC increased due to decomposition of applied mulch. Higher values of SOC concentration were observed at 0-10 cm than 10-20 cm and lowest at 20-30 cm soil depth. Our results are in line with those of Lal [32] and Khurshid et al. [57] who concluded that organic matter was significantly higher when more mulch was applied. Similarly Canqui and Canqui [53] conducted a study to assess the long term (10 years) impact of three levels (0, 8 and 16 Mg ha-1 on a dry matter basis) of wheat (Triticum aestivum L.) straw applied annually on SOC concentration and physical properties of a Crosby silt loam soil (fine, mixed, active, mesic Aeric Epiaqualfs). They reported that mulching increased SOC concentration, but did not significantly change cone index and shear strength.
Due to decomposition of mulch material, organic matter increased and enhanced soil nitrogen status. Our results are in line with those of Khurshid et al. [42] who conducted an experiment to investigate the methods to minimize erosion hazards, reduce the cost of cultivation and increase crop productivity. A strip of ground flora effective for the control of soil erosion was allowed to grow before it was cut and spread as mulch. The mulch (4.5-5.0 tones ha-1) contributed 75 kg N, 17 kg P and 144 kg K to soil and addition of mulch resulted in significant increase in infiltration rate and soil moisture and decrease in runoff. Similarly, Saroa and Lal [51] conducted a study to assess the role of aggregation to enhancing soil organic carbon (SOC) and total soil nitrogen (TSN) concentration for different mulch rates. Their results showed that mulch rates significantly increased the SOC and TSN concentration in the 0-5 cm soil layer only.
Our results are in line with those of Bhardwaj and Sindhwal [52] who conducted an experiment to investigate the methods to minimize soil erosion hazards, reduce the cost of cultivation and increase the crop productivity. A strip of ground flora for the control of soil erosion was allowed to grow before it was cut and spread as mulch. The mulch (4.5-5.0 tones ha-1) contributed 75 kg N, 17 kg P and 144 kg K to soil.
Due to mulching, water is conserved with in the soil and because of more water availability there was more uptake of nitrogen by crop. Plants uptake the nutrients through water and nitrogen is mobile in soil solution thus if there is more moisture within the soil then more nitrogen uptake by plants.
In the presence of water contents phosphorus availability enhanced due to more diffusion. Our results are in accordance with those of Pevaiz et al. [50] who reported that mulch and tillage significantly affected the N and P concentration in maize shoots, while its affect on K concentration was appreciable. Interactive effect of mulch and tillage was statistically significant in case of N (1.423 g kg-1) and P (0.156 g kg-1) concentration but non significant in case of K (1.767 g kg-1) concentration.
. During plants uptake, potassium moves through diffusion, so due to increase in mulch rates, more water is available for movement. Our results are in line with those of Pevaiz et al. (2009) who reported that greater plant height (2.59 m) and grain yield (10.6 M ha-1) were obtained from M2 and biological yield (20.7 Mg ha-1) from M1 in combination with deep tillage. Mulch and tillage significantly affected the N and P concentration in maize shoots, while its affect on K concentration was appreciable. Interactive effect of mulch and tillage was statistically significant in case of N (1.413 g kg-1) and P (0.157 g kg-1) concentration but non significant in case of K (1.768 g kg-1) concentration.
REFERENCES
[1] MinfaL. Agric. Statistics of Pakistan. Ministry of Food, Agriculture & Livestock, Economic Wing, Islamabad, 2013. [2] M. English. Deficit irrigation. Analytical framework. Journal
of Irrigation and Drainage, Vol.116, 399-412, 1990.
[3] H. Zhang, T. Oweis, S. Garabet, M. Pala. Water use efficiency and transpiration efficiency of wheat under rainfed conditions and sup rigation practices, Water Report No. 22, Rome, Italy.2000.
[4] A. Hess. A microcomputer plemental irrigation in a Mediterranean type environment. Plant Soil, Vol.201, 295–305, 1999.
[5] FAO. Deficit ir scheduling program for supplementary irrigation. In: Irrigation Scheduling: From theory to practice. Proc. ICID/FAO Workshop, Rome, Italy. 1996
[6] J. M. De Jager, J.A. Kennedy. Weather-based irrigation scheduling for various farms (commercial and small-scale). In: Irrigation Scheduling: From Theory to Practice. Proceedings ICID/FAO Workshop, Rome, Italy. 1996. [7] A. L. van der Westhuizen, J.G. Annandale, N. Benadé. 1996.
Encouraging irrigation scheduling: A cost-benefit approach. In: Irrigation Scheduling: From theory to practice. Proc.ICID/FAO Workshop, Rome, Italy. 1996.
[8] S. R. Reddy. Agronomy of field crops. 2nd Ed. Kalyani
Publishers, India. 2006.
[9] K. R. Paudyal, J.K. Ransom, N.P. Rajbhandari, K. Adhakari, R.V. Gerpacio, P.L. Pingali. 2001. Maize in Nepal: Production systems, constraints and priorities for research. Kathmandu: NARC, Nepal. 2001.
[10] R. K. Pandey, J.W. Maranville, M.M. Chetima. Deficit irrigation and nitrogen effects on maize in a Sahelian environment II. Shoot growth, nitrogen uptake and water extraction. Agriculture and Water Management, Vol.46, 15-27, 2000.
[11] C. M. T. Soler, G. Hoogenboom, P.C. Sentelhas, A.P. Duarte. 2007. Impact of water stress on maize grown off-season in a subtropical environment, Journal of Agronomy and Crop Sciences, Vol.193, 247- 261, 2007.
[12] M. M. Reymond, B. Leonardi, A. Charcosset, A. Tardieu. Combining quantitative trait loci analysis and an ecophysiological model to analyses the genetic variability of the response of leaf growth to temperature and water deficit. Plant Physiology, Vol.131, 664-675, 2003.
[13] H. V. Eck, Effects of water deficits on yield, yield components and water use efficiency of irrigated corn. Agronmy Journal, Vol.78, 1035-1040, 1985.
[14] S. B. Moser, B. Feil, S. Jampatong, P. Stamp. Effects of preanthesis drought, nitrogen fertilizer rate, and variety on grain yield, yield components, and harvest index of tropical maize. Agriculture and Water Management, Vol.81, 41-58, 2006.
[15] C. A. Grant, G.A. Peterson, C.A. Campbell. Nutrient considerations for diversified cropping systems in the northern great plains, Agronomy Journal Vol.94, 186-198, 2002.
[16] H. E. Igbadun, A.K. Tarimo, B.A. Salim, H.F. Mahoo. Evaluation of selected crop water production functions for an irrigated maize crop, Agriculture and Water Management. Vol.94, 1-10, 2007.
[17] I. J. Lorite, Mateos, F. Orgaz, E. Freres. Assessing deficit irrigation strategies at the level of an irrigation district. Agriculture and Water Management, Vol.91, 51-60, 2007. [18] M. A. Ali, A. A. Hoque, Hassan, A. Khair. Effects of deficit
irrigation on yield, water productivity and economic return of wheat. Agriculture and Water Management, Vol.92, 151-161, 2007.
[19] F. R. Lamm, D.H. Rogers, H.L. Manges. Irrigation scheduling with planned soil water depletion. Journal of Irrigation and Drainage. Vol.37, 1491-1497, 1994.
[20] C. A. Norwood. Water use and yield of limited-irrigated and dryland corn. Soil Science Society of American Journal, Vol.64, 365–370, 2000.
[21] R. C. Akir. Effect of water stress at different development stages on vegetative and reproductive growth of corn, Field Crops Research, Vol.89, 1-6, 2004.
[22] E. Fereres, M.A. Soriano. 2006. Deficit irrigation for reducing agricultural water use. Journal of Experimental Botany. Vol.58, 147-159, 2006.
Sparks and J. Hatfield (eds.). Encyclopedia of Soils in the Environment, Elsevier Publication, USA. 2005.A. A. Ramalan, C.U.
[24] Nwokeocha. 2000. Effects of furrow irrigation methods, mulching and soil water suction on the growth, yield and water use efficiency of tomato in the Nigerian Savanna. Agriculture and Water Management, Vol.45, 317-330, 2000. [25] R. L. Baumhardt, O.R. Jones. Residue management and
tillage effects on soil-water storage and grain yield of dryland wheat and sorghum for a clay loam in Texas, Soil and Tillage Research, Vol.68, 71-82, 2002.
[26] S. L. Zhang, L. Lövdahl, H. Grip, Y.A. Tong, X.Y. Yang , Q.J. Wang. Effects of mulching and catch cropping on soil temperature, soil moisture and wheat yield on the Loess Plateau of China. Soil and Tillage Research, Vol.102, 78-86,2009.
[27] R. E. Phillips, R.L. Blevins, G.W. Thamas, W.W. Frye, S.H. Phillips. No-tillage. Agricultural Science, Vol.208, 1108-1113, 1980.
[28] R. H. Hoefer, G.A. Wicks, O.C. Bumside. Grain yields, soil water shortage, weed growth in a winter wheat-corn-fallow rotation, Agronomy Journal, Vol,73, 1066-1071, 1981. [29] A. R. Chaudhary. Maize in Pakistan. Punjab Agricultural
Research Coordination Board, Pakistan, 1988.
[30] R. G. D. Steel, J.H. Torrie, D.A. Dicky. 1997. Principles and Procedures of Statistics- A Biometrical Approach 3rd Ed. McGraw Hill Book International Corporation, Singapore, 1997.
[31] U. S. Salinity Laboratory Staff. Diagnosis and improvement of saline and alkaline soils. USDA Hand Book No. USA. 1954
[32] R. E. Moodie, R.W. Smith, R.A. MacGreery. Laboratory Manual of Soil Fertility. State College Washington, USA. 1959.
[33] A. Walkley, I.A. Black. Estimation of soil organic carbon by chromic acid titration method. Soil Science, Vol.37, 29-38, 1934.
[34] G. R. Blake, K.H. Hartage. Bulk density. In: Methods of Soil Analysis, Part 1. Physical and Mineralogical Methods. A. Klute. (Ed.) Agronomy Monograph No. 9, USA. 1986. [35] S. A. Wajid. Effect of different mulching material and
irrigation levels on growth and grain yield of maize. M.Sc. (Hons.) Agri. Thesis. Deptt. Agron. Univ. Agri. Faislabad. 1990
[36] A. Oktem. Effects of deficit irrigation on some yield characteristics of sweet corn. Bangladesh Journal of Botany, Vol.37, 127-131, 2008.
[37] M. L. Jackson. Soil chemical analysis. Constable and Co. Ltd, London, UK. 1962.
[38] G. A. Wicks, D.A. Crutchfield, O.C. Burnside. Influence of wheat (Triticum aestivum) straw mulch and metolachlor on corn (Zea mays L.) growth and yield. Weed Science, Vol.42, 141-147, 1994.
[39] A. Ahmad, Hammad, H.M., F. Azhar, T. Khaliq, A. Wajid, W. Nasim, W. Farhad. Optimizing water and nitrogen requirement in maize (Zea mays L.) under semi arid conditions of Pakistan. Pakistan Journal of Botany, Vol.43, 2919-292, 2011.
[40] S. P. Bhardwaj, N.S. Sindhwal. Zero tillage and weed mulch for erosion control on sloping farmland in Doon Valley, Indian Journal of Soil Conservation, Vol.26, 81-85, 1998. [41] K. Khurshid, M. Iqbal, M.S. Arif, A. Nawaz. Effect of tillage
and mulch on soil physical properties and growth of maize, International Journal of Agriculture and Biology, Vol.8, 593-596, 2006.
[42] J. Liu, S.A. Xu, G.Y. Zhou, H.H. Lu. Effect of transplanting multi-cropping spring maize with plastic film mulching on the ecological effect, plant growth and grain yield, Journal of Hubei Agriculture College, Vol.2, 100-102, 2002.
[43] J. A. Tolk, T.A. Hawell, S.R. Evett. Effect of mulch, irrigation and soil type on water use and yield of maize, Soil and Tillage Research, Vol.50, 137-147, 1999.
[44] M. A, Chaudhary, S. Ali, I. Hussain. Effect of different rates of mulches, moisture conservation and yield of corn (Zea mays L.) under rain-fed condition in Rawalpindi. Pakistan Journal of Soil Science, Vol.9, 32-36, 1994.
[45] T. Oweis, M. Pala, J. Ryan. Stabilizing rainfed wheat yields with supplemental irrigation and nitrogen in a Mediteranean climate, Agronmy Journal, Vol.20, 672–681, 1998.
[46] S. Gurpeet, S.K. Jalota, S. Yadvinder. Manuring and residue management effects on physical properties of a soil under the rice-wheat system in Punjab, India. Soil and Tillage Research, Vol.94, 229-238, 2007.
[47] C. L. Acharya, C.L, O.C. Kapur. In situ soil moisture conservation for wheat through mulching in previous standing maize, Indian Journal of Agricultural Sciences, Vol.63, 462-466, 1993.
[48] B. H. Canqui, R. Lal. Impacts of long-term wheat straw management on soil hydraulic properties under no-tillage. Soil Science Society of American Journal, Vol.71, 1166-1173, 2007.
[49] M. A. Pervaiz, M. Iqbal, K. Shahzad, A. Hassan. Effect of mulch on soil physical properties and N, P, K concentration in maize (Zea mays L.) shoots under two tillage systems, International Journal of Agricultural Biology, Vol.11, 119–124, 2009.
[50] B. S. Ghuman, H.S. Sur. Tillage and residue management effects on soil properties and yields of rainfed maize and wheat in subhumid subtropical climate. Soil and Tillage Research, Vol.58, 1-10, 2001.
[51] G. S. Saroa, R. Lal. Soil restorative effects of mulching on aggregation and carbon sequestration in a Miamian soil in Central Ohio, Land Degradation and Development, Vol.14, 481-493, 2003.