© 2019, IRJET | Impact Factor value: 7.211 | ISO 9001:2008 Certified Journal | Page 7367
Brain Tumor Detection and Classification with Feed Forward Back
propagation Network
Neha K Mohanan
1, Akhila Gopal
2, Ayana Ajith
3, Aswathy M.R
41,2
PG Scholar, Department of Computer Science & Engineering, Vidya Academy of Science & Technology , Kerala,
India
3,4
Asst. Professor, Department of Computer Science & Engineering, Vidya Academy of Science & Technology,
Kerala, India
---***---Abstract -
Brain is an organ that controls activities of allthe parts of the body. Recognition of automated brain tumor in Magnetic resonance imaging (MRI) is a difficult task due to complexity of size and location variability. Previous methods for tumor are time consuming and less accurate. Detection of tumor can be done by MRI and CT scan. MRI give high quality images of the body parts and is often used while treating tumors. There are many methods to building completely mechanized computer aided diagnosis (CAD) framework to help therapeutic experts in recognizing and diagnosing brain tumor. Different stages in brain tumor detection are Image Acquisition, Image Preprocessing, Feature Extraction, Image Segmentation and Classification. Previous methods for tumor detection are time consuming and less accurate. In the present work, Recognize and model nonlinear relationships between data. In preprocessing, divides images into blocks using bounding box method. So we get large number of dataset from each image. Then Instead of a single image here every blocks of a image handled. Then Haar transform used to noise removal and smoothing with preserving edge information. Statistical analysis, GLCM, Morphological operations and edge are used for feature extraction. Extracting features from each blocks of an image. This method helps to identifying abnormal areas from images. Then Block matching technique with FFBP used for classification. Feed forward Back propagation neural network is a multilevel error feed-back network that reduces error rate. Well design and training of ANN make it qualified for decision making operations when it faced with new data. This method results high accuracy and less iterations detection which further reduces the consumption time. This automatic segmentation algorithm gives shape, size and location of the tumor more accurately. Classifying brain MRI into normal and abnormal cases. We used a benchmark dataset MRI brain images. The experimental results show that our approach achieves 98% classification accuracy using ANN.
Key Words: MRI; Brain tumor; feature extraction; Feed
Forward Back propagation network.
1. INTRODUCTION
Brain tumor is only any mass that outcomes from an anomalous and an uncontrolled growth of cells in the brain. Brain tumor is progressively reparable and treatable
whenever distinguished at beginning period; it can increase the intracranial pressure which can spoil the brain permanently. Brain tumor symptoms depend upon the size of tumor, location and its type. Its threat levels depend upon the combination of factors like the type of tumor, its position, its size and its state of growth. Brain tumors can be malignant (malignant) or non- malignant (benign). Benign brain tumors are a low grade and it is said to be non-cancerous brain tumors, which grows slowly and push aside normal tissue but do not invade the surrounding normal tissue. They are homogeneous, well defined and are known as non- metastatic tumors, as they do not form any secondary tumor. The malignant brain tumors are cancerous brain tumors, which grows rapidly and invade the surrounding normal tissue. Malignant brain tumors or cancerous brain tumors can be counted among the at most deadly diseases. Detection of tumor can be done by MRI and CT scan. Sometimes cancer diagnosis can be delayed or missed because of some symptoms. The principle aim of this paper is to analyze the best segmented method and classify them for a better performance. Here Feed-forward back propagation neural system is utilized to characterize the execution of tumors part of the image. Artificial Neural Networks (ANNs) consist of an interconnection of simple components referred to as neurons, which are programming constructs that mimic the properties of biological neurons. ANNs consist of one or more layers. Each layer has one or more neurons. The neuron (perceptron) can be defined simply as a device with many inputs, one output, and an activation function. This strategy results high exactness and less cycles recognition which additionally diminishes the utilization time.
1.1
MRI
© 2019, IRJET | Impact Factor value: 7.211 | ISO 9001:2008 Certified Journal | Page 7368
information that can be used in improving the quality ofdiagnosis and treatment of brain. MRI image texture contains a rich source of information such as characterize brightness, color, slope, size, and other features. Along these lines, it is required to figure the computerized image qualities to depict its texture properties numerically and this is called image feature extraction. Feature extraction are distinguishing applicable highlights prompts quicker, simpler, and better to get images. Feature extraction process influences essentially the nature of the classification process.
1.2 Automated System
Automated system(detection) of brain tumor through MRI is basically called Computer Aided Diagnosis (CAD) system. The CAD system can provide highly accurate reconstruction of the original image i.e. the valuable outlook and accuracy of earlier brain tumor detection. It consists of two or more stage. In the initial stage preprocessing has required after that stages post-processing i.e. segmentation are required. Then detection strategies and other information, feature extraction, feature selection, classification, and performance analysis are compared and studied. Pre-processing techniques are used to improvement of image quality and remove noise for the accurate detection of the undesired regions in MRI. Post-processing is used to segment with different strategy the brain tumor from the MRI of brain images.
2. RELATED WORK
In[1], the authors proposed Classification of MRI Brain Images using K-NN and k-means. The diagnosis based on the classification of magnetic resonance images(MRI).The Method consists of three stages. In the first stage the image is filtered using Discrete Wavelet Transform(DWT )and the features are extracted using Principal component analysis(PCA).In the second stage the segmentation of MRI images are done using K-mean clustering. In the last stage the k-nearest neighbor classifier is used to classify the MRI image as cancerous or non cancerous. Also the twelve properties of extracted features are calculated. Therefore this classification method becomes robust and effective .
In[7], Detection of brain tumor from MRI images involves different steps such as Magnetic Resonance image pre-processing, segmentation of image feature extraction. This paper describes about the methods that are used Histogram Thresholding, K-means clustering, and Fuzzy C-Means Support Vector Machine (SVM).Here includes several steps such as pre-processing; high frequency components and noise are removal RGB to gray conversion, global image threshold; which converts intensity image into binary image, erosion dilation of binary image to locate tumor position exactly, detecting the stage of the tumor whether primary Benign or last Malignant.
In[4], the authors proposed Brain tumor detection and segmentation by using thresholding and watershed algorithm. The main used was segmentation, which is done using a method based on threshold segmentation, watershed segmentation and morphological operators. Threshold segmentation is one of the simplest segmentation methods. The input gray scale image is converted into a binary format. The method is based on a threshold value which will convert gray scale image into a binary image format. The main logic is the selection of a threshold value. Some common methods used under this segmentation include maximum entropy method and k- means clustering method for segmentation. Watershed Segmentation is one of the best methods to group pixels of an image on the basis of their intensities. It is a good segmentation technique for dividing an image to separate a tumor from the image Watershed is a mathematical morphological operating tool. After converting the image in the binary format, some morphological operations are applied on the converted binary image. The purpose of the morphological operators is to separate the tumor part of the image. Now only the tumor portion of the image is visible, shown as white color. This portion has the highest intensity than other regions of the image.
3. METHODOLOGY
Our proposed methodology is composed of a set of stages starting from collecting MRI to classification as normal or abnormal. The main steps are shown in Fig. 1.
Fig 1: Block diagram of the proposed method
MRI dataset
© 2019, IRJET | Impact Factor value: 7.211 | ISO 9001:2008 Certified Journal | Page 7369
samples images for abnormal and normal brain: (A) - Normalbrain (B) - Tumor brain.
Image Preprocessing
Divides T2-Weighted MRI images into blocks with size 60*80 using bounding box method. So we get large number of dataset from each image.
Then Instead of a single image here every blocks of a image handled.
noise removal and smoothing with preserving edge information.
Feature Extraction
Feature selection is the strategy of choosing a subset of applicable features for structure powerful learning models by evacuating most unimportant and excess features from the data. The characteristic features of the image can provide a helpful hand to the detection of tumor. Feature extraction involves the process of collecting information such as shape, color, texture, gray level, contrast, etc . Texture analysis gives an idea of the image . Moreover, statistical features can be employed to have an overview of the given MRI image.
Features for Brain Tumor Detection:
A. Statistical Analysis
Statistical features the pixels or the gray level values of the image gives spatial features and can be used in bio-medical applications to study the image characteristics. Statistical features include mean, variance and standard deviation, which are briefly stated as below:
Mean: Mean of an image depends upon the homogeneity of brightness of the MRI image. Mean will have high value if the image is persistently bright. Mean is defined as the sum of all pixel values divided by total number of pixels. It gives the average distribution of the intensity values of an image.
Variance: Variance characterizes distribution of calculated gray levels. If there is difference between gray level values of means then the variance will be increased. Variance gives a measure of
how each pixel differ from the mean value. It is given as the average of square of the difference between mean and individual pixel.
Standard deviation: Standard deviation defines the difference in set of data values from the mean. It can be expressed as the square root of variance.
B. Gray-level co-occurrence matrix (GLCM)
The GLCM functions characterize the texture of an image by calculating how often pairs of pixel with specific values and in a specified spatial relationship occur in an image. Gray Level Cooccurence Matrix is one of the most widely used image analysis application which can be employed to extract textural features [8]. Feature extraction from therapeutic images should be possible by following two stages utilizing this strategy. The initial step gives GLCM calculation. Texture highlights dependent on GLCM is determined in second step [8]. GLCM takes gray levels as input. Hence, the given image is checked for a gray scale image. If it is not, RGB image will be converted into gray scale image to take gray levels as input. Textural findings and analysis helps in assessment and diagnosis of tumor and its stages. Using this matrix can measure energy, contrast, homogeneity, Entropy and IDM.
Energy: Energy is a portion which claims picture similarity. It mirrors pixel pair replications. Gray level is the fundamental unit of each image. Energy is given as the sum of square of all gray levels or the pixel values.
Contrast: Contrast of an image returns the change in the measure of intensity values between a pixel and its neighbouring pixel. If there are many variation in adjacent gray level alterations, it implies high level of dissimilarity.
Homogeneity: Homogeneity gives a measure of value that measures the closeness o distribution of elements in the GLCM to the GLCM diagonal.
Entropy: Entropy is used to calculate dissimilarity in MRI image or in the Region of interest (ROI). Entropy is the statistical measure of randomness that can be used to characterize texture of an image.
IDM: Inverse Difference Moment is the local homogeneity. It is high when local grey level is uniform.
C. Morphological Operation
© 2019, IRJET | Impact Factor value: 7.211 | ISO 9001:2008 Certified Journal | Page 7370
Erosion : Morphological erosion removes islandsand small objects so that only substantive objects remain.
Dilation : Morphological dilation makes objects more visible and fills in small holes in objects.
D. Edge
This is also essential feature required and since the inherent nature of the brain tissues is such it not easy to find the sharp boundaries of the tumor, this nature and pixel arrangement of the edges is considered for detection of the brain tumor. An edge happens when there is an sudden and unexpected intensity modification of the image. Whenever it is detected an abrupt modification or a change in the intensity of a certain image, the associated pixel would be treated as an edge pixel.
Classification
Normal and abnormal MRI are classified by taking the output of feature extraction. Block matching technique with FFBP used for training and testing. Using bounding box method required less no of MRI images for training. Using stride get huge dataset from each image. Also gives correct classification and abnormal areas from images through training with FFBP. Abnormal areas identified by bounding box. Find the most dissimilar region mention it as Region of Interest (ROI). Finally classifying both normal and abnormal MRI images and gives area and location of tumor from abnormal images.
Feed-Forward Back-Propagation(FFBP) Neural Network
Feed-Forward Neural Network.
In feed-forward neural network, the neurons are arranged in layers and they have unidirectional connections between them. They produce only one set of output values. They are called as static network because in this the output values are produced only based on current input. The output values does not depend on previous input values. They are also called as memory less network. In feedback network, the neurons have bidirectional connections between them. Feedback or Recurrent networks produce a set of values which depends on the previous input values. Feedback network is also known as dynamic network because the output values always depend on the previous input values.
BPNN(Back-Propagation Neural Network)
BP neural network architecture with one hidden layer operating on log sigmoid transfer function has been employed for the classification of normal and abnormal tumour. There is a full connectivity between the upper and lower layers and no connections between neurons in each
layer. The weights on these connections encode the knowledge of a network. The data enters at the input and passes through the network, layer by layer, until it arrives at the output. The parameters of a network were adjusted by training the network on a set of reference data, called training set. The training of the network was performed under back propagation of the error. The trained networks were then be used to predict labels of the new data. Algorithm stages for BPNN
1. Initialization of weights 2. Feed forward
3. Back propagation of Error 4. Updation of weights and biases
4. EXPERIMENTAL RESULTS
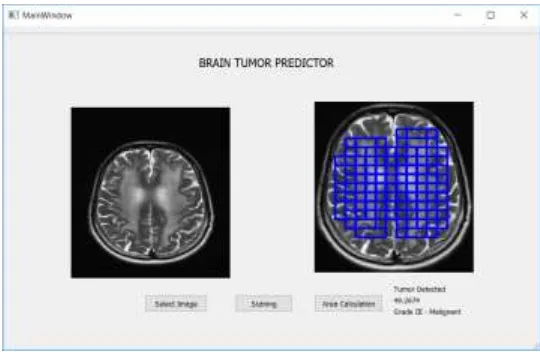
ABNORMAL BRAIN IMAGE:
At the point when gives abnormal image as input then get right classification (Tumor Detected), also predict area and size of tumor. It gives Grade of tumor in regards to the size. If tumor size less than 20, at that point that one in grade I, else on the off chance that tumor size greater than 34, at that point that one in grade III, else that kind of tumor in grade II class.
Types of tumor:
[image:4.595.307.577.485.661.2]Grade I includes : Benign Grade II includes : Glioblastoma Grade III includes : Malignant
Fig 2: Results of abnormal brain image as input
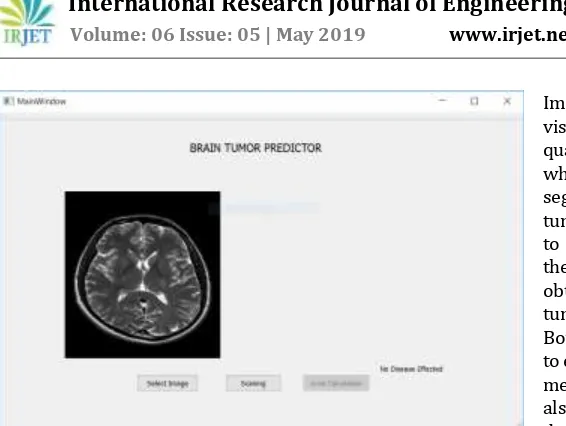
NORMAL BRAIN IMAGE:
© 2019, IRJET | Impact Factor value: 7.211 | ISO 9001:2008 Certified Journal | Page 7371
Fig 3: Results of normal brain image as input
V. PERFORMANCE EVALUATION
Performance of proposed method is evaluated using confusion matrix. The table shows the confusion matrix for following data.
[image:5.595.37.320.54.267.2]
Total Images=600 Actual Abnormal Images=300 Actual Normal Images =300
Table I : Confusion Matrix
[image:5.595.40.284.449.582.2]
Table II : Parameter Analysis
5. CONCLUSION
Medical images are amongst important data sources, since these images are usually used by physicians to detect the diseases that harm the human brain. Magnetic Resonance
Imaging (MRI) is a medical imaging technique used to visualize the internal structure of the body and provide high quality images. MRI contains useful and fine information which is used to improve diagnosis accuracy. This automatic segmentation algorithm gives shape, size and location of the tumor more accurately. It gives a less demanding approach to analyze the tumor and encourages specialists to design the careful methodology. Information of images can be obtained by Statistical analysis, where the possibility of tumor is highest by using mean, entropy and GLCM. Bounding Box technique used to locating tumor areas. Easy to extract features like size and location. Using bounding box method less number of MRI images required for training and also extracting features from each blocks.Which helps to fast detection of abnormal areas. Block matching technique with FFBP used to classification. Feed forward Back propagation neural network is a multi-level error feed-back network that reduces error rate. We have tested the proposed approach using a benchmark dataset of MRI brain images. The experimental results show that our approach achieved was 98 % classification accuracy achieved by ANN.
REFERENCES
[1] V. S. Takate P . S. Vikhe. ”Classification of MRI Brain Images using KNN and k-means”, International Journal on Advanced Computer Theory and Engineering (IJACTE), 2014
[2] S.N.Deepa B.Aruna Devi. ”Artificial Neural Networks design for Classification of Brain Tumor”, 2012 International Conference on Computer Communication and Informatics , 2012
[3] N Muhammad Aqeel Aslam, Daxiang Cui. ” Brain tumor detection and segmentation by using thresh-olding and watershed algorithm”, ,Nano Biomed. Eng., 2017
[4] Kanupriya Parveen, Amritpal Singh. ” BraTS: Brain
Tumor Segmentation
SomeContempo-raryApproaches”,IEEEInternationalConferenceonSignal Processing and Integrated Networks (SPIN), pg. no. 98-102, 2015
[5] Marjia Mandhir Kaur and Dr. Rinkesh Mittal. ”Survey of Intelligent Methods for Brain Tumor Detection”, International Journal of Computer Science Issues, Vol. 11, Issue 5, No 1, September 2014.
[6] K.V. Anitha and S. Murugavalli. ”Brain tumour classification using twotier classifier with adaptive segmentation technique”, IET Computer Vision, 2016, vol.10(1), pp. 9-17.
[7] Hari Babu Nandpuru, Dr. S. S. Salankar, Prof. V. R. Bora. MRI Brain Cancer Classifi-cation Using Support Vector Machine, IEEE International Conference on Electrical, Electronics and Computer Science, Pg. No. 1-6, 1-2 March 2014.
[8] A.R. Kavitha, Dr. C.Chellamuthu, Ms. Kavin Rupa. An Efficient Approach for Brain Tumour Detection Based on Modified Region
© 2019, IRJET | Impact Factor value: 7.211 | ISO 9001:2008 Certified Journal | Page 7372
[10] Deepa, et al. and B.A. Devi, `` Neural Networksdesign for Classification of Brain Tumor”, The international Conference on Computer Communication and Informatics, Coimbatore, pp-568-573, 2012. [11] M. Mohamed Fathima, D.Manimegalai, D.; Thaiyalnayaki, S., "Automatic detection of tumor subtype in mammographs based on GLCM and DWT features using SVM," Information Communication and Embedded Systems, International Conference on , vol., no., pp.809,813, 21-22 Feb. 2013
[12] N. M. Saad, S.A.R Abu-Bakar, S. Muda, N..M Mokji, L. Salahuddin, "Brain lesion segmentation of Diffusionweighted MRI using gray level co-occurrence matrix," In International Conference on Imaging Systems and Techniques , pp. 284-289, 17-18 May 2011 [13] Heena Hooda, Om Prakash Verma, Tripti Singhal , “Brain Tumor Segmentation: A Performance Analysis using K-Means, Fuzzy C-Means and Region Growing Algorithm”, IEEE International Conference on Advanced Communication Control and Computing Technologies , pg. no. 1621-1626, 2014