MASTER THESIS
Towards an Extended
Science-Based
Multi-Dimensional Scan for
assessing Smart Industry
Maturity
Lucas Vincent Ungerer
–
S1698974
MSc. Business Administration
–
Strategic Marketing & Digital
Business
First supervisor:
Dr. R.P.A. Loohuis
Second supervisor:
Dr. Ariane von Raesfeld Meijer
Acknowledgements
Throughout the process of designing the extended scan and writing my master thesis I
got valuable support from a number of people. Without these people I wouldn’t be able
to hand in the research as it stands right now. I would like to acknowledge the people that supported me throughout my research.
First, I would like to thank all specialists to agree to provide me with their interesting insights and feedback on the measurement questions. These specialists took time off to help me out making the measurement questions more valid and reliable. I really appreciate them doing this for me.
Next, I would like to thank my family, my close friends and my girlfriend for supporting me throughout the process, next to this they provided me with interesting insights as well.
A special gratitude goes to Paul Höppener, who supported me throughout the research. We already worked together for my bachelor thesis and throughout the last one and a half years he provided me with new contacts, interesting insights and valuable input. Next to this, he helped me find specialists within his network that could provide me with feedback on the measurement questions.
I am also very grateful for having had Raymond Loohuis as my first supervisor. I was always able to contact him whenever facing issues. We had regular meetings in order to discuss my process and Raymond Loohuis also provided me with valuable insights throughout the process of designing the extended scan.
Lastly, I would like to thank Ariane von Raesfeld Meijer for agreeing to be my second supervisor.
Thank you everyone for your support and time.
Abstract
Industry 4.0 or in other words smart industry is becoming increasingly important for organisations. Specifically manufacturing firms are naming industry 4.0 as a top investment priority and are actively investing in the implementation of it in order to stay competitive. Therefore, these manufacturing firms could substantially benefit from a comprehensive overview on the maturity of industry 4.0 implementation. In this research an extended science-based multi-dimensional scan for assessing industry 4.0 maturity is created, here and after known as the “extended scan”. This scan measures industry 4.0 maturity on different business aspects throughout the firm. A design research is chosen consisting of steps that were taken to draft and evaluate the extended scan. It started with an extensive literature review towards industry 4.0 maturity and its influence on different business aspects. This was followed up by an exploration of
existing industry 4.0 scans including the “multi dimensional smart industry scan” that
Table of content
Acknowledgements ___________________________________________________________________ 2
Abstract _________________________________________________________________________________ 3
List of tables and figures _____________________________________________________________ 6
Introduction ____________________________________________________________________________ 7
Step 1: selecting existing Smart Industry Scans __________________________________ 9 1.1 Exploring existing smart industry scans __________________________________________________ 9 1.2 Assessing and selecting existing smart industry scans ________________________________ 10 1.3 Enumeration of the features of selected scans _________________________________________ 12 1.4 Designing extended scan _________________________________________________________________ 14 Step 2: The Aspects __________________________________________________________________ 15 2.1 Introducing the aspects __________________________________________________________________ 15 2.2 Using literature to provide the argumentation for using each aspect ________________ 16 2.2.1 Strategy _________________________________________________________________________________________ 16 2.2.2 Employees ______________________________________________________________________________________ 17 2.2.3 Management & leadership _____________________________________________________________________ 18 2.2.4 Organisational culture & Knowledge management __________________________________________ 18 2.2.5 Marketing & sales ______________________________________________________________________________ 19 2.2.6 Customer services ______________________________________________________________________________ 20 2.2.7 Channels ________________________________________________________________________________________ 21 2.2.8 Institutional awareness ________________________________________________________________________ 22 2.2.9 Sustainability ___________________________________________________________________________________ 23 2.2.10 Inbound logistics activities & outbound logistics activities _________________________________ 23 2.2.11 Products & services ___________________________________________________________________________ 24 2.2.12 Production & process _________________________________________________________________________ 25 2.2.13 IT management & Industry 4.0 technologies ________________________________________________ 26
Step 6: Making it fit for use - providing information for consultancy and practitioners _________________________________________________________________________ 48 6.1 Added value extended scan ______________________________________________________________ 48 6.2 Conducting the scan using an online tool _______________________________________________ 48 6.3 The results sheets of the online tool ____________________________________________________ 49 Step 7: Providing limitations and possibilities for future research _________ 51
Step 8: Summarizing the Design Research ______________________________________ 52
Step 9: Reference list ________________________________________________________________ 53
List of tables and figures
Introduction
During the 18th century, the steam engine was introduced, which meant the introduction of the new manufacturing process. It led to a complete transition of the textile industry and the factories that were established led to the development of industrial cities. This period was later referred to as the first industrial revolution. Roughly 150 years later, the invention of the internal combustion engine introduced the second industrial revolution. This invention led to the usage of oil and electricity, which led to rapid industrialization featured by mass production using the assembly line. The third industrial revolution started in 1960 and introduced electronics in order to automate production (Xu, David & Kim, 2016). This period was featured by a shift from mechanical and analogue electronic technology to digital electronics. Currently, we are in, what is called the fourth industrial revolution, which is also called the digital revolution (Vale, 2016). It is featured by technology in the cyber-physical, biological and digital spheres (Xu, David & Kim, 2016).
Part of the fourth industrial revolution is industry 4.0 or in other words smart industry.
Industry 4.0 is becoming increasingly important in manufacturing firms. “While in 2015,
only half the manufacturing executives interviewed cited digitalization and automation of business processes as a top IT priority, in 2016 more than 90% are investing in these
areas (CGI, 2017).” Industry 4.0 and smart factory are terms that are closely related to
each other. In a smart factory, smart tools, such as machines, are interconnected and processes are automated. Supply and demand can be seen as an example of an automated process. Smart instruments can notice a possible shortage of supply or demand from customers and increase or decrease the amount of incoming deliveries from the suppliers, to keep the inventory within the organisation stable. One of the main outcomes of a smart factory is the increase of efficiency in the process (Vuksanovic et al, 2016). As mentioned before, within two years there has been an increase from 5/10 to 9/10 of the manufacturing executive stating industry 4.0 practices as a top priority. This increase shows the importance of industry 4.0 implementation. In order for firms to stay competitive the concept of industry 4.0 should be implemented in ones firm (CGI, 2017).
All of this once again shows the importance within this field for a well-organized maturity model for measuring industry 4.0 maturity on different aspects. Maturity models can help an organisation to find out the current status quo of something and can help to figure out what can be improved in order to improve the performance (Fowler, 2014). Schumacher et al. (2016, p162) also state “maturity models are commonly used as an instrument to conceptualize and measure maturity of an organisation or a process
The argumentation behind designing this extended scan is to give a very detailed overview of the implementation of industry 4.0 practices in different business aspects within an organisation, or in other words, display the industry 4.0 maturity of an organisation. The scan is an extension on the more generally oriented “multi
dimensional smart industry scan”, also referred to as “quick scan” that was designed
earlier, in the pursuit of a bachelor thesis assignment (Ungerer, 2018).
The extended scan was created by splitting up the general aspects of the quick scan into multiple aspects. To give an example, value chain was one of the aspects in the quick scan. The extended scan also provided the aspect value chain, however it is now split up into five different aspects, which means that this aspect is assessed in more detail in the extended scan. Next to splitting up the aspects from the quick scan, the extended scan also consists of new aspects that were gathered from an extensive literature review of industry 4.0 implementation and an exploration of existing smart industry maturity scans. This extensive literature review provided a detailed insight into possible input for the measurement questions and aspects. The combination of this extensive literature review and reviewing the existing scans was the foundation of the extended scan.
In this design research, three research questions will be answered:
I. How are the aspects designed, and what argumentation is used in order to design them?
II. How are the measurement questions designed, and what theory is used to design them?
III. How are the maturity levels and maturity types designed?
Step 1: selecting existing Smart Industry Scans
1.1 Exploring existing smart industry scans
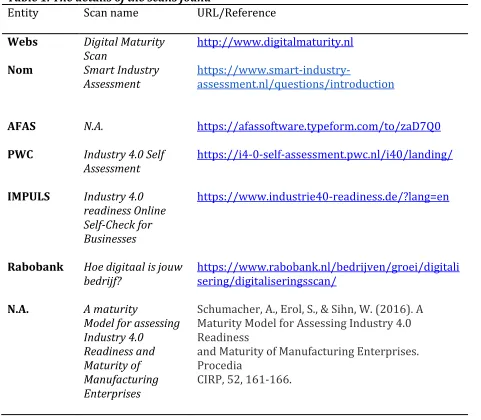
[image:9.595.64.545.345.765.2]In order to draft the extended scan the first step was to conduct an exploration on existing smart industry scans. In the research of Ungerer (2018) four existing scans were reviewed. This theory expands to a total of eleven existing scans. The criterion for selecting them is provided in table 2 in the next paragraph. It provided a greater insight into the existing aspects and measurement questions. These eleven scans consisted of 57 aspects, 402 measurement questions and 37 maturity levels.Table 1 provides a table that shows the foundation of the extended scan. In this figure one can see the different scans that were found when exploring existing smart industry scans. First, the entity that provided the scan is given, followed up by the name of the scan, and lastly the URL or reference of the scan is provided.
Table 1. The details of the scans found
Entity Scan name URL/Reference
Webs Digital Maturity Scan
http://www.digitalmaturity.nl
Nom Smart Industry Assessment
https://www.smart-industry-assessment.nl/questions/introduction
AFAS N.A. https://afassoftware.typeform.com/to/zaD7Q0
PWC Industry 4.0 Self Assessment
https://i4-0-self-assessment.pwc.nl/i40/landing/
IMPULS Industry 4.0 readiness Online Self-Check for Businesses
https://www.industrie40-readiness.de/?lang=en
Rabobank Hoe digitaal is jouw bedrijf?
https://www.rabobank.nl/bedrijven/groei/digitali sering/digitaliseringsscan/
N.A. A maturity
Model for assessing Industry 4.0
Readiness and Maturity of Manufacturing Enterprises
Schumacher, A., Erol, S., & Sihn, W. (2016). A Maturity Model for Assessing Industry 4.0 Readiness
and Maturity of Manufacturing Enterprises. Procedia
Future Industries/ Paul
Höppener
IIC
I4 maturity tool
IIoT Maturity Assessment
N.A.
https://www.smartindustry.com/industrynews/iic -launches-the-iiot-maturity-assessment-explorer/
MITsloan 2016 Digital Business Global Executive Survey
Kane, G. C., Palmer, D., Phillips, A. N., Kiron, D., & Buckley, N. (2017). Achieving digital maturity: Adapting your company to a changing world. Retrieved May 20, 2018. Deloitte university press, 1-19.
Ungerer (2018)
Multi Dimensional Smart Industry Scan
Ungerer, L., V., (2018) Constructing A Multi-Dimensional Smart Industry Scan, Retrieved from https://essay.utwente.nl/75362/1/Ungerer_IBA_B MS.pdf
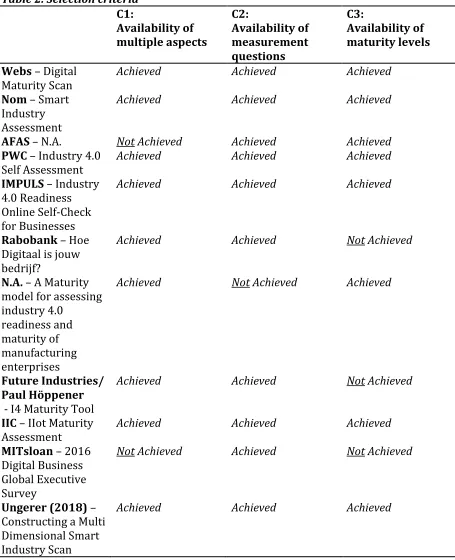
1.2 Assessing and selecting existing smart industry scans
Table 2. Selection criteria C1: Availability of multiple aspects C2: Availability of measurement questions C3: Availability of maturity levels
Webs – Digital Maturity Scan
Achieved Achieved Achieved
Nom – Smart Industry Assessment
Achieved Achieved Achieved
AFAS – N.A. Not Achieved Achieved Achieved
PWC – Industry 4.0 Self Assessment
Achieved Achieved Achieved
IMPULS – Industry 4.0 Readiness Online Self-Check for Businesses
Achieved Achieved Achieved
Rabobank – Hoe Digitaal is jouw bedrijf?
Achieved Achieved Not Achieved
N.A. – A Maturity model for assessing industry 4.0
readiness and maturity of manufacturing enterprises
Achieved Not Achieved Achieved
Future Industries/ Paul Höppener
- I4 Maturity Tool
Achieved Achieved Not Achieved
IIC – IIot Maturity Assessment
Achieved Achieved Achieved
MITsloan – 2016 Digital Business Global Executive Survey
Not Achieved Achieved Not Achieved
Ungerer (2018) –
Constructing a Multi Dimensional Smart Industry Scan
Achieved Achieved Achieved
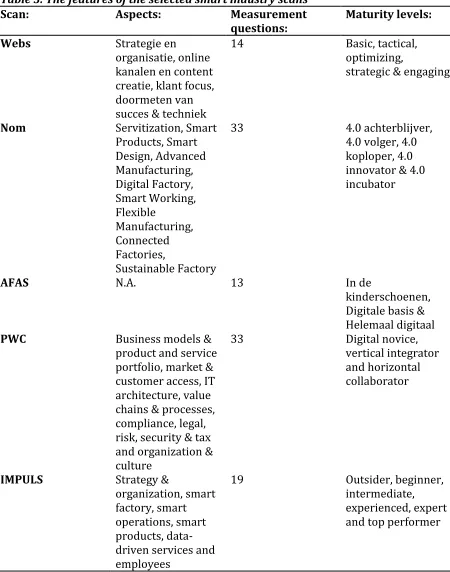
1.3 Enumeration of the features of selected scans
[image:12.595.71.521.199.771.2]In table 3one can see the features of the existing scans that were used for this design research. To summarize, all scans together consisted of 57 aspects, 402 measurement questions and 37 maturity levels. This, in combination with an extensive literature review on industry 4.0 implementation was the basis for the extended scan.
Table 3. The features of the selected smart industry scans
Scan: Aspects: Measurement
questions:
Maturity levels:
Webs Strategie en
organisatie, online kanalen en content creatie, klant focus, doormeten van succes & techniek
14 Basic, tactical,
optimizing,
strategic & engaging
Nom Servitization, Smart
Products, Smart Design, Advanced Manufacturing, Digital Factory, Smart Working, Flexible Manufacturing, Connected Factories, Sustainable Factory
33 4.0 achterblijver,
4.0 volger, 4.0 koploper, 4.0 innovator & 4.0 incubator
AFAS N.A. 13 In de
kinderschoenen, Digitale basis & Helemaal digitaal
PWC Business models &
product and service portfolio, market & customer access, IT architecture, value chains & processes, compliance, legal, risk, security & tax and organization & culture
33 Digital novice,
vertical integrator and horizontal collaborator
IMPULS Strategy &
organization, smart factory, smart operations, smart products, data-driven services and employees
19 Outsider, beginner,
Rabobank Kosten besparen, Omzet verhogen,
8 N.A
N.A. Strategy,
leadership,
customer, products, operations, culture, people, governance and technology
N.A. 1 to 5 in which 1
describes a complete lack of attributes
supporting industry 4.0 and level 5 represents the state-of-the-art of required attributes
Future Industries/ Paul Höppener
Vision & direction & business model, people & organisation, marketing & customer access, product, product development, production process & production control, production automation, performance management, big data analytics
175 N.A.
IIC Business strategy,
Business solution lifecycle,
Technology & Security
20 Establishing,
Emerging, Developing, Comprehensive & Best practice
MITsloan N.A. 52 N.A.
Ungerer (2018) Strategy & Organisation, People & Organisational culture, Products & Customer Services, Customer
Interfaces, Value Chain, Technology & IT management, Institutional awareness
35 Poor
1.4 Designing the extended scan
Step 2: The Aspects
2.1 Introducing the aspects
The extended scan consists of 15 different aspects. Ranging from “strategy” to “IT
management” and from “inbound logistics activities” to “outbound logistics activities”.
According to (Pereira & Romero, 2017) the march of industry 4.0 is affecting the whole supply chain, from product development to outbound logistics. The aspects of this scan will provide one with a deep insight of the status quo of implementation of industry 4.0 practices per aspect. By filling in all the aspects the respondent will get a good overview of the current implementation of industry 4.0 practices, and on top of that, the respondent will be provided with results that show on what aspects improvements can be made. This will contribute to finding the weak spots and eventually growing to a stronger digitized organisation. In figure 1one can see all fifteen aspects. Note: OC & KM indicates Organisational Culture & Knowledge Management.
The Extended Scan
Strategy
Employe es
Manage ment & Leaders
hip
OC & KM
Marketi ng & Sales
Custome r Services
Channel s Instituti
onal Awarene
ss Inbound
Logistics Activitie
s Outboun
d Logistics
Activitie s Products
& Services Producti on & Process
IT Manage
ment
Industry 4.0 Technol
[image:15.595.73.463.341.738.2]ogies
2.2 Using literature to provide the argumentation for using each aspect
The next chapter will first provide the argumentation of using these 15 aspects. Every aspect has its own argumentation. The argumentation consists of the essence of asking the aspect and why digitization is important within this aspect. Moreover, the aspects are connected to the literature about the aspects. Next to this, the variables that are of major importance will be discussed. After reading this chapter, one will have sufficient knowledge about the argumentation for using the 15 aspects.
2.2.1 Strategy
Strategy is a very broad term, which exists of many things and should be included as an aspect in this scan. Without a well-formulated strategy, there are no clear goals set in order to let an organisation move forward. An organisation will not know its position in the market, and will have a hard time gaining a competitive advantage (liferay, 2019). In this scan, the strategy is assessed based on its focus on industry 4.0 practices.
Recently, traditional strategies are increasingly replaced by digital strategies in which the focus lies on using technology to improve business performance. It indicates the direction and goals that an organization is taking in order to create a competitive advantage with technology. A digital strategy usually indicates changes to business models (Liferay, 2019).
As mentioned before, strategy is a very broad term and exists of many things. To many things to all include in the scan, that’s why a selection of subjects is made that were considered important to assess the digital strategy of an organisation. First of all, the questions will assess the current state of industry 4.0 implementation and to what extent it contributes to the success of the organisation. Next this, the questions are related to investments and if there is a dedicated budget to invest in industry 4.0 practices. Furthermore, the use of data and industry 4.0 technologies is assessed. Lastly,
of course the vision can’t be forgotten.
2.2.2 Employees
The working environment is changing; Industry 4.0 is transforming jobs and required skills to do these jobs. One of the greatest challenges is to avoid technological unemployment, so redefining current jobs and taking measures to adapt the workforce for the new jobs that will be created (Pereira & Romero, 2017). Processes are becoming more complex, which results in a demand for a higher qualified workforce and new competences. This workforce could be selected in the application process, but can also be formed by educating the existing workforce (Hecklau et al, 2016). Next to the complexity, future-working pursuits will also demand new skills and competences from the workforce. For example, industry 4.0 will lead to the increase in automation of tasks, which means that workers should be prepared for performing different tasks (Pereira & Romero, 2017).
On the other hand, according to the research of Müller et al (2017) several companies indicate that industry 4.0 is countering the increasing lack of highly qualified employees to do highly skilled manual work in the technical field. Next to this industry 4.0 is helping employees to ease assignments. To give two examples Muller et al (2017) mention employees using smartphone apps to quickly inform about their availability. Next to this, industry 4.0 facilitates the lower qualified workforce, while machines can explain the remaining steps and guide the low qualified workforce through processes (Müller et al, 2017). However, working positions of employees are going to change. That is why employees should be provided with opportunities to gain these skills and competences in order to be able to overcome these challenges of industry 4.0 implementation. That is one of the reasons that skills development is very important. It will lead to social changes and is one of the important key factors for a successful adoption and implementation of industry 4.0 (Pereira & Romero, 2017).
Next to this, (Heathfield, 2019) mention that good communication is essential during changes like industry 4.0 implementation. Employees should be aware of what is happening, and companies should be transparent towards their employees about the
changes. “You cannot over-communicate when you are asking your organization to change (Heathfield, 2019)”.
2.2.3 Management & leadership
“The implementation of the concept industry 4.0 necessitates involvement from top management promoting comprehensive change management activities and processes for arranging organization and production structures according to the needs of the connected value creation (Mohelska & Sokolova, 2018, p2237)”. Managers should have the motivation to convince employees of the benefits of industry 4.0 and openly address their actions. On the other hand, managers should be convinced of the beneficial nature of industry 4.0 implementation, and this can only be achieved by increasing their own awareness and knowledge related to the topic (Mohelska & Sokolova, 2018).
According to Westerman et al (2014, p95) “leadership capabilities are essential to achieve true digital transformation; they turn digital investment into digital advantage”. For companies to start the digital journey, the top management should be capable to move the whole company in the same direction. Westerman et al (2014) describe four key capabilities of leadership: (1) crafting your digital vision, (2) engaging the organization at scale, (3) governing the transformation and (4) building technology leadership capabilities. The first step is rather self-explanatory in the sense that it is about familiarizing yourself with digital practices, identifying the risks and bottlenecks, crafting the digital visions and make it precise enough to give your employees a clear direction. The second step is a sequel on giving the employees a clear direction. The employees need to be energized by management. Management should be open and transparent and employees should be given a voice in decision making of the digital transformation. Step 3 is about the digital governance and entails consideration of decision-making, the persons that are in charge of leading the digital transformation and identifying governance mechanisms. Lastly, step 4 is about the quality of skills and competences, management should be capable to assess ability of employees and departments. Management should focus on initial investments and consider the feasibility of the digital transformation (Westerman, 2014).
Mohelska & Sokolova (2018) state that the management should have the right skills and competences to lead the company into the digital transformation. To increase these skills and competences one can plan extensive trainings and workshops towards industry 4.0 specific knowledge and skills, such as for example data management, analytics and human-machine interaction.
2.2.4 Organisational culture & Knowledge management
“Organisational culture is the pattern of values, norms, beliefs, attitudes and assumptions that may not have been articulated, but shape the ways in which people in organisations behave and get things done. Values refer to what is believed to be important about how people and organisations behave. Norms are unwritten rules of
The organisational culture should be set up in such a way that it allows the implementation of industry 4.0. Mohelska & Sokolova (2018) argue that the culture should promote innovation in order to let the organisation grow into a higher level of digitalization. The importance of organisational culture should not be underestimated and this aspect can be seen of one of the most important building blocks for creating a digital atmosphere.
According to Mohelska & Sokolova (2018) the implementation of industry 4.0 requires continuous innovation and education, which is featured by an adhocracy style of culture. Mohelska & Sokolova (2018) are using the theory of Cameron, Quinn & Wallach (2010) about organisation culture types. According to this theory an Adhocracy is featured by a culture style that allows innovation within the organisation. This style is famous for allowing personal creative freedom, orientation towards change and innovation. A digital organisation needs a culture that bolsters creativity and also rewards employees who are willing to learn and try out new things. The organisation should promote new ideas and not be afraid to take a risk and make a mistake. In this case the internal knowledge and creativity of employees can be used to try out new ideas on a regular base (Mohelska & Sokolova, 2018)
In order to make the digital transformation skills and competences of employees can be of great importance. However, knowledge within the organisation is essential. The paper of Müller et al (2017) argues that organisations need more extensive employee trainings in order to increase skills, competences and knowledge, because the implementation of industry 4.0 asks for completely new ways that are, for example, required with human intervention in case of machine failures.
2.2.5 Marketing & sales
Leeflang et al (2014, p1) state that Wharton Professor George Day “identified the widening gap between the accelerating complexity of market and the capacity of most
marketing organizations to comprehend and cope with this complexity”. It is believed
that the rapid growth of Internet usage is the cause for this widening gap. Over the last years the Internet has become one of the most important tools for transactions. Leeflang et al (2014) provide an example of Amazon to show the magnitude of online selling. On
Amazon’s peak day, they sell up to 320 products per second, which comes down to more
than 27 million products sold on this day. Next to this, social media marketing is increasingly efficient. With billions of users worldwide social media is an amazing way to promote products or services (Leeflang et al, 2014).
competitors. As written before the Internet usage of people is increasing rapidly. A growing amount of people is becoming digital and this is becoming an increasingly important source of competitive advantage for organisations (Leeflang et al, 2014). A new way of marketing is emerging which is called digital marketing that is replacing traditional marketing. This transformation is influencing the marketing and sales department drastically.
According to Strandberry (2018) the marketing and sales activities for firms are changing and instead of activities to reach out customers through magazines, newspapers, radio commercials, postcards, telemarketing and billboards, the new activities consist of search engine optimization, content marketing, social media marketing, pay per click, marketing automation and email marketing for example. Purchases are more and more done online so online customer behaviour is getting very important for marketing & sales departments, because in some industries sales are set even without face-to-face contact (Strandberry, 2018).
Strandberry (2018) state that the marketing & sales department has a very important role in order to make a digital transformation. This department should be in line with the developments happening in the marketplace. The digital atmosphere is changing marketing and sales pursuits rapidly and it is up to organisation to keep up with these changes and keep developing. In this aspect, the respondents are asked to rate their knowledge related to the online behaviour of customers. Next to this, the website and online marketing techniques are analysed.
2.2.6 Customer services
Customer services are one of the aspects that were added to the extended scan. Customer services are understood as “the support you offer your customers – both before and after they buy and use your product or service – that help them to have an easy and enjoyable experience with you (SalesForce, 2019).” Excelling in customer services can help an organisation to keep customers satisfied and retain them. Satisfied customers can spread their satisfaction, which can result in new customers that can ultimately help your company to grow and gain revenue.
Customer services are essential to keep customers satisfied and to build a good reputation for possible other customers. Satisfied customers can quickly share their satisfaction online and reach a large amount of potential customers, but this is also applicable the other way around, in which unsatisfied customers share their experiences online. You don’t want this to happen, because it can damage you reputation severely. It is also one of the reasons why customer satisfaction is very important.
Today’s customer services goes far beyond traditional customer services, such as a
communication purpose with customers, today’s communication tools have expanded to
also entail social media, text messages, email communication and self-service possibilities via the website (SalesForce, 2019). Moreover, customer services consists of more than only communication tools to reach out to the organisation. Customer services can also be done by using sensors in the offered products, which is not applicable for all organisations, but definitely the case for manufacturing companies.
In the questions related to this aspect, we will of course ask about the customer services that are related to communicating with the organisation. However, we go one step further and will also ask about the extent to which sensors are used in products to indicate the performance and when maintenance has to be done for products. Next to this, a question is related to automatic notifications of customers on information regarding, for example, their orders. This aspect gives a good overview of the amount of automation and digitization in customer services for the organisation.
2.2.7 Channels
According to Heinonen & Michelsson (2010) channels can be seen as the set of activities, people and distributors that are vital in bringing the product or service from the place of production to the place of consumption, in other words: the customer.The products or services that are distributed to the end-customer are distributed through the channels of the organisation. Channels help organizations to reach out or expand their scope, and could ultimately assist to increase revenue. There are different channels, and each channel will obviously have its own benefits and drawbacks. From all channels, the online channels are fast gaining more ground. The usage and advantages of online channels has gained increasing attention in recent years (Heinonen & Michelsson, 2010).
It is essential for organisation to improve their channels continuously. As mentioned before, in recent years the usage of online channels has gained increasing attention (Heinonen & Michelsson, 2010). It is the task of organization to keep up their channels up to date and expand their online channels in such a way that customer can reach out to the organisation in multiple ways in this digital era.
These are some examples of online channels that can be used to reach out to customers. In the questions that are related to this topic the channels are tested. The questions are about the amount of channels, so if multiple digital channels are used. Moreover, the extent to which channels are monitored by data in order to track their performance is tested and to improve them in case of non-performance.
2.2.8 Institutional awareness
Institutional awareness is a collective term that is used for a couple of important subjects. The aspect consists of five different questions that all have to do with the institution and that’s why these questions are situated in this aspect. The questions are related to the digital policy, intellectual property, security, taxes and privacy laws.
Digital policy entails the awareness of regulations of digital or electronic communications. It is a very broad term, because it also has to do with information security and network security. Besides, lee & Cole (2003) argue that intellectual property entails the ownership of the knowledge for a product or service. The ownership of this knowledge is owned by a certain organisation. It is very important that this knowledge is owned by the organisation and no one else can just use it without permission. Some organisations use the crowd to promote knowledge creation, called community based knowledge creation, which is also promoted by the digital era (Lee & Cole, 2003). This question can create a useful insight and starting point for a discussion.
One of the most important concerns in institutional awareness is the protection of privacy, because in the digital era data will be collected throughout the organisation. The new European privacy legislation (GDPR) promotes the privacy of customers. A certified data protection officer informed me about this topic during a meeting. To summarize, customers can ask to delete or adjust their personal data from an
organisation’s database. These requests need to be dealt with within one month, so to safe out time, especially in big organisation, these requests could be dealt with automatically. Next to privacy concerns security concerns are important as well. Müller et al (2017) state that cyber criminality is a very important concern, which is related to becoming a digital organisation. In order to counter cyber criminality, companies should know how to cope with their own data security, but also with the data security of partners within the supply chain. Employees should be aware of the fact that implementing industry 4.0 technologies introduces new privacy and security risk (Müller et al, 2017).
Lastly, taxes are very important to consider whenever businesses are considering industry 4.0 driven opportunities. According to Pritchard et al (2017) many organisation experience taxes as a “hidden costs” that can create unexpected costs. Next to only the costs, a changed tax position can result into a change in tax obligations, which
to apply industry 4.0 technologies are likely to increase capital expenditures, in order to create a valid return on investment the organisation has to look into possible tax costs (Pritchard et al, 2017).
2.2.9 Sustainability
“In manufacturing, sustainability refers to the creation of manufactured products through economically-sound processes that minimize negative environmental impacts while conserving energy and natural resources (Meng et al, p5, 2018)”. In order to minimize negative environmental impacts and conserve energy and natural resources, the concept of sustainable manufacturing has been introduced. Sustainable manufacturing aims to change the traditional way of manufacturing and make manufacturing more environmental friendly. Many countries have already introduced policies to promote sustainable manufacturing, such as restricting emissions of factories and promoting renewable energy (Meng et al, 2018).
There are multiple smart techniques that can be used in sustainable manufacturing. Meng et al (2018) name the following smart techniques: deep learning, smart grid, smart metering, radio-frequency identification (RFID), big data analytics, data mining, cloud computing and additive manufacturing. Introducing smart techniques to an organisation can help to work more efficient and thus reduce emissions and the use of raw materials (Meng et al, 2018).
In this aspect, the questions are related to industry 4.0 technologies used to increase environmental sustainability and if industry 4.0 technologies have helped to introduce sustainability to the organisation. Moreover, the questions are related to the monitoring of emissions from machines and products.
2.2.10 Inbound logistics activities & outbound logistics activities
In this part the two aspects inbound logistics activities and outbound logistics activities are explained together. However, in the scan these are two separate aspects both consisting of five different questions.
Logistics is the general term, which consists of both inbound and outbound logistic
activities. First, let’s separate the term and give a small introduction to the meaning of both. “Inbound logistics refers to the transport, storage and delivery of good coming into
The general idea of combining industry 4.0 and logistics is not to replace human work. Its idea is to avoid inaccuracies in the processes and promote a more efficient and faster process in which real time information can be accessed at all time (Barreto, Amaral & Pereira, 2017). Smart technologies such as sensors can help to indicate deviations in the processes. Hecklau et al (2016) provide an example, in which one could think of an incoming delivery that is delayed, because of bad weather. When sensors are implemented into the incoming delivery, the organisation can be notified automatically and could adjust their pursuits accordingly. However, to achieve this, cooperation of both the suppliers and the organisation and on the other hand the customers is needed.
That’s why Logistics 4.0 increases the need for collaboration. As previously mentioned organisation must align with their suppliers in order to stay competitive. This could lead to more complexity in the processes (Hecklau et al, 2016). If used correctly, the implementation of industry 4.0 in logistics activities can enhance flexibility, efficiency and improve customer satisfaction. If the logistics department is automatically notified of incoming and outgoing deliveries, they can situate the warehouse accordingly, which decreases storage costs.
As previously mentioned, the scan consists of both inbound and outbound logistics. Inbound logistics will contain questions related to collaboration between organisation and suppliers and to what extent smart technologies are used in this collaboration. Moreover, the respondent is asked to what extent smart technologies, such as warehouse management systems are used in the warehouse. A warehouse management system is an intelligent system that is able to select a docking slot for incoming deliveries, which optimizes just-in-time delivery (Barreto, Amaral & Pereira, 2017). The outbound logistics part is related to collaboration and connections with customers. Next to this, if transported products are monitored and kept track on.
2.2.11 Products & services
In this part the argumentation for using both products and services is provided. Their importance with regards to industry 4.0 implementation is discussed and the reasoning behind the subjects for the measurement questions is given.
organisation is dependent on their own skills, but also on the willingness of partners and customers. Smart connected products require a whole new infrastructure in which products provide real time data to customers. If implemented in the right way, smart connected products provide new capabilities. They can monitor and report at all time, providing useable insights. They can be controlled by the user, which provides the user more flexibility in functions and performance. Thirdly, the combination of monitoring and control provides data that can be used for product optimization, such as performance and utilization optimization. Lastly, the above-mentioned capabilities can
support algorithms to become autonomous and learn from the user’s environment and
preferences (porter & Heppelmann, 2015).
Next to smart connected products, services can also benefit from industry 4.0 implementation. Many service industries rely on products that can become smart and connected. Porter & Heppelmann (2015) provide an example in which an airline with smart and connected airplanes can reach higher efficiency. By implementing smart and connected product in airplanes maintenance issues can be detected in flight and the needed work or parts can be waiting on the plane when it lands (Porter & Heppelmann, 2015). Resulting into better services, which also introduce the topic of servitisation.
According to Müller et al (2017) servitisation allows new forms of value captures. They mention that companies that introduce services in their value offers are the organisations that are most likely to the profit the most from industry 4.0. Servitisation represents a switch from having a business model that is product-based to being demand-oriented. This switch allows companies to target new customers, but also to switch from payment per product to payment per feature or payment per use. Organisations can provide their customers with repairs and maintenance, and the products are real time followed by the use of sensors (Müller et al, 2017).
This aspect consists of measurement questions that analyse the industry 4.0 implementation in an organisation’s products and services. These measurement questions are related to e.g. tracking, monitoring, the product line and servitisation.
2.2.12 Production & process
share production related data with its partners within the supply chain. This sharing of production data is beneficial for all parties and is one of the things that are tested in the extended scan. The measurement questions related to production in the scan will give a status quo of the maturity of industry 4.0 implementation in this field.
Processes will also be affected by the increasing implementation of industry 4.0. Processes are becoming more complex, which leads to an increasing demand for higher qualified jobs, therefore organisation need to qualify their employees to do these jobs (Hecklau et al, 2016). Smart connected machines and optimized production will be far more productive and processes throughout the organisation should be adapted to this. An increasing amount of processes can be automated and optimized in order to reach a higher efficiency throughout the process. This efficiency result in money savings and savings in time for example (Porter & Heppelmann, 2015). In order to find out the industry 4.0 implementation in the field of processes measurement questions are constructed.
The measurement questions in this aspect is related to for example automated processes, implementation of industry 4.0 techniques and to what extent the production equipment, such as machines are interconnected.
2.2.13 IT management & Industry 4.0 technologies
In this part both the aspects IT management and Industry 4.0 technologies are discussed. It management contains measurement questions that have to do with the implementation of industry 4.0 technologies. The measurement questions in the extended scan are related to data gathering, IT collaborations, data exchange, data storage, ERP/MRP decisions, applying industry 4.0 technologies, IT security measures and general IT management.
Resulting from the growth of technology usage throughout organisations, the organisation should be able to deal with huge amount of data in an efficient manner. According to Hecklau (2016) an organisation can deal with this “big data”, by looking into implementing IT infrastructures. Moreover, it is necessary to collaborate with partners to operate together on different platforms. Big data also raises the concern of cyber security, as data should be protected. However this was discussed in the institutional awareness aspect, so no need to discuss this anymore (Hecklau, 2016). In
order to find out if the organisation’s IT management is as advanced to deal with e.g.
these huge amount of data, the measurement questions can be filled out to find out their maturity in this field.
Step 3: The Measurement Questions
The scan consists of 86 measurement questions divided across 15 business aspects as discussed in the second step. In the previous chapter, the aspects were explained in detail. This chapter contains the argumentation for drafting the measurement questions as they are. The literature used in order to draft the measurement questions and formulate the answer options are provided in this chapter.
3.1 Using literature to draft the measurement questions
“Constructing a questionnaire involves many decisions about the wording and ordering
of questions, selection and wording of response categories and formatting and mode of administration of the questionnaire (Martin, p3, 2006).”
As mentioned before, the extended scan consists of 86 measurement questions. These measurement questions were drafted by conducting an extensive literature review into the topic of questionnaire construction and by assessing existing scans. Table 1 provides information about the different scans that were used in order to come up with the content for the measurement questions. Next to this, the reference list contains a lot of references that were used to gain knowledge related to the importance of certain subjects for the measurement questions.
During the literature review, several papers were selected that mentioned different requirement for constructing questionnaires. These requirements ranged from avoiding double-barrelled questions to avoiding ambiguity. In table 4 one can see a display of these requirement. This chapter will provide clear explanations of these requirements and their influences on the measurement questions.
single construct as this negatively affect uni-dimensionality. Nemoto & Beglar (2014) state that uni-dimensionality is the idea that a question should not measure different constructs, because it is otherwise difficult to interpret the results from the respondent. Measurement questions should be written in one direction, and preferably in a positively worded way. Next to this, Nemoto & Beglar (2014) state that questions should be written in a language that the respondent understands well. For now the questionnaire is written in English, because English is understood by a majority of people. However, in the future it is intended to translate it in Dutch and German as well.
Moreover, according to Martin (2006) and Malhotra (2006) it is necessary to avoid ambiguity and complexity in the measurement questions for a questionnaire. In short, ambiguity is a phrase that indicates that language can have different meanings. Different
respondents interpret simple words like “you”, “children” and “work” very differently.
According to Martin (2006) ambiguity and complexity in measurement questions can lead to cognitive overload, which could results in parts of measurement questions being lost and forgotten. Because of this, measurement questions can be partially understood or misinterpreted leading to biased answers by respondents. Being very specific and consistent in wording measurement questions could avoid these misinterpretations and could significantly increase the reliability and validity of the results. “Simple, ordinary words that match the vocabulary level of the respondents should be used in a
questionnaire (Malhotra, p190, 2006)”. Fanning (2005) state that questionnaires should be consistent and to ensure consistency, questions should be consistent in appearance, including font, font size, but also in wording. Try to use the same words all over again to reach a higher level of consistency. Next to this, Martin (2006) argues that is essential to exclude presuppositions in the questionnaire. By including presuppositions in the measurement questions, respondents may be led to provide an answer even though the
presupposition is false. As an example, Martin (2006) states the question: “what are your usual hours of work”. This question presupposes that the respondent works, and that his hours of work are regular and the same most of the time. Try to exclude presuppositions and make the questions accessible for all you respondents by including or excluding parts in the measurement questions (Martin, 2006).
Next to this, multiple papers mention the length of measurement questions. Measurement questions should be short and specific in order to get the full attention of respondents. Measurement questions that are too long will distract the attention of respondents and this could cause biased answers. Try to avoid questions that are too time consuming and try to make these questions shorter or split them up into two questions. As a guideline, measurement questions should not be longer than 25 words (Siniscalso & Auriat, 2005) (Taylor-powell, 1998) (van den Berg & van der Kolk, 2014). Moreover, van den Berg & van der Kolk (2014) & Malhotra (2006) mention that a good questionnaire does not contain biased words or phrases. Keep in mind that some words can be emotionally charged and influence the responses from respondents. They provide the example about people that have just gone through a diet program. Words like fat and heavy should be excluded from the measurement questions, because they can have an emotional load to it. However, the topic that is discussed in the extended scan is practical, so this requirement doesn’t apply, but it was kept in mind when formulating the measurement questions (van den Berg & van der Kolk, 2014).
Table 4. The requirements for constructing measurement questions
Papers: Requirements:
Nemoto, T. & Beglar, D. (2014), Taylor-Powell, E. (1998), Siniscalso, M. & Auriat, N. (2005), van den Berg, S. & van der Kolk, H. (2014)
Avoid double-barrelled questions (words like: and, or and but).
Nemoto, T. & Beglar, D. (2014) Avoid positively and negatively worded items to measure one single construct (negatively affects uni-dimensionality). Nemoto, T. & Beglar, D. (2014) Questions should be written in a language
that someone understands well.
Martin, E. (2006) Malhotra, N. (2006) Avoid ambiguity (simple words may have different meanings).
Martin, E. (2006) Malhotra, N. (2006) Avoid complexity by not making multiple variables in one question.
Martin, E. (2006) Avoid presuppositions (presuppose something in the question)
Siniscalso, M. & Auriat, N. (2005), Taylor-Powell, E. (1998), van den Berg, S. & van der Kolk, H. (2014)
Use simple and clear wording by avoiding the use of abbreviations, jargon, acronyms, technical terms and foreign phrases. Taylor-Powell, E. (1998) Be specific and include all necessary
information. Siniscalso, M. & Auriat, N. (2005),
Taylor-Powell, E. (1998), van den Berg, S. & van der Kolk, H. (2014)
Avoid questions that are too time consuming, keep questions short or otherwise break them up (<25 words). Siniscalso, M. & Auriat, N. (2005),
Taylor-Powell, E. (1998).
Make sure that only one answer option is possible and the answer options should be mutually exclusive and clear.
Siniscalso, M. & Auriat, N. (2005) Avoid hypothetical questions
Fanning, E. (2005) The questions should be clear, logical and consistent
Taylor-Powell, E. (1998), van den Berg, S. & van der Kolk, H. (2014) Malhotra, N. (2006)
3.2 Using literature to draft the answer options
For the answer options it is chosen to make use of the Likert Scale. The answer options are the same for each measurement question except the measurement questions for aspect 15. The Likert scale is named after Rensis Likert who first used it in 1932. Nemoto & Beglar (2014) state some advantages of using a likert-scale questionnaire. Firstly, data can be gathered rather quickly from a big number or respondents. Next to this, Likert-scale questionnaires can provide highly reliable ability estimates and provide the validity of the interpretations made from the data through different means. The data can easily be compared and combined with qualitative data-gathering techniques, such as open-ended questions. Next to this, according to Malhotra (2006) it is also very easy for a researcher to construct. For the extended scan, a five-point scale is
used. “Traditional guidelines suggest that the appropriate number of categories should be seven plus or minus two: between five and nine (Malhotra, p187, 2006)”. Next to this a five-point scale happened to be very convenient in combination with radar charts that provide a clear overview of scores. This interval way of scaling the answers gives the researcher the highest possibility of actually using the results. It provided an easier entrance for using powerful statistical techniques such as correlation analysis. Burns & Bush (2005) state on page 280 that by giving the response options on a scale with equal interval in between them a researcher could attain a higher level of measurement than it should have with ratio, ordinal or nominal measurement.
The measurement questions can all be answered by giving an answer by providing a
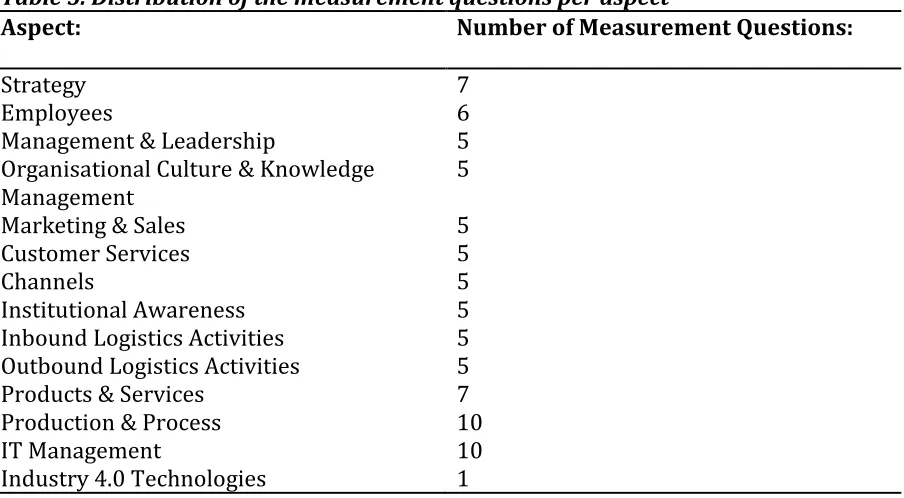
3.3 Distribution of the measurement questions for the aspects
[image:33.595.71.523.232.481.2]Figure 5shows the distribution of the measurement questions amongst the aspects. The measurement questions are not equally distributed amongst the aspects. One can see that eight of the fifteen aspects contain five measurement questions and that there are two aspects that contain ten measurement questions. Some aspects are broader than other aspects when combined with industry 4.0. That is the main reason why the measurement questions are not equally distributed amongst the aspects.
Table 5. Distribution of the measurement questions per aspect
Aspect: Number of Measurement Questions:
Strategy 7
Employees 6
Management & Leadership 5
Organisational Culture & Knowledge Management
5
Marketing & Sales 5
Customer Services 5
Channels 5
Institutional Awareness 5
Inbound Logistics Activities 5 Outbound Logistics Activities 5
Products & Services 7
Production & Process 10
IT Management 10
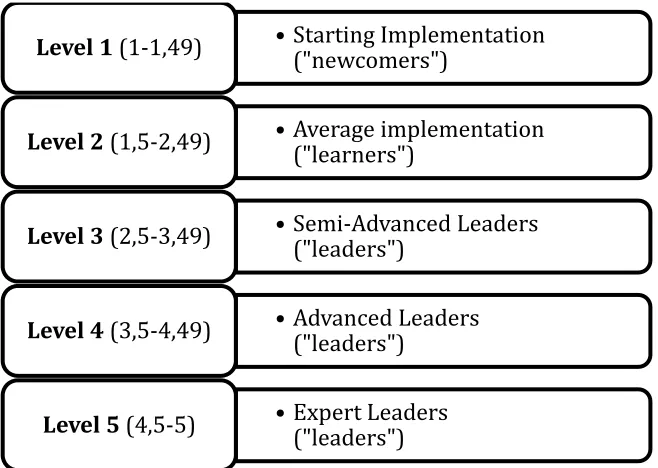
Step 4: The maturity levels & types
Maturity levels and maturity types were created in order to present respondents a level of maturity based on industry 4.0 implementation. These levels are based on the average score for the all aspects, so in other words, the average score of all 86 measurement questions. Five maturity levels have been drafted and next to them, three maturity types have been added.
4.1 Introducing the maturity levels and providing argumentation for
using them
As one can see in table 3the exploration of literature and existing scans resulted in 37 different maturity levels, which were all analysed in order to construct the maturity levels of this paper. In order to construct the maturity levels, the paper of Leyh et al (2016) was used. They propose different stages of industry 4.0 implementation. To give a general overview, the most important features of the stages are mentioned. The first stage that they propose is the basic digitization level in which the company has not addressed industry 4.0. The second stage is called cross-departmental digitization in which the company is actively engaged in industry 4.0 topics and digitization is implemented across departments. The third stage is called horizontal and vertical digitization in which the company is horizontally and vertically digitized. Stage 4 is called full digitization in which the company has been completely digitized. Stage 5 is called optimized full digitization in which the company is not only digitized itself, but the collaborations with business partners is also digitized (Leyh et al, 2016).
Based on the paper of Leyh et al (2016) the maturity levels for the extended scan also
consist of five maturity levels. In the paper of Ungerer (2018) “constructing a multi dimensional smart industry scan” five maturity levels are provided as well. Level 1 is called poor implementation in which the respondents with an average in between 1 and 1.49 were placed. Level 2 is called moderate implementation in which the respondents with an average of in between 1.5 and 2.49 were situated. The next maturity level is called advanced implementation with an average score of in between 2.5 and 3.49. The fourth maturity level is called semi-advanced implementation with an average score of in between 3.5 and 4.49. Lastly, maturity level five is called full implementation with an average score of in between 4.5 and 5.
used the whole scan including maturity levels for educational purposes at different organisations. A lot of feedback was received, and one of the main points of attention were the maturity levels. The score distribution was very clear, so that is why these
haven’t been changed. However the maturity levels have changed. In the next paragraph,
the maturity levels for the extended scan are shown and the difference between Ungerer (2018) and the proposed maturity levels are provided.
Maturity level 1 was called poor implementation, however it was changed to starting implementation. A specialist in digital transformation proposed this change and stated
the negative tone of the word “poor”. In his opinion, organisations that see poor
implementation can be offended by the word instead of triggered to improve. In his
opinion “starting implementation” was a better alternative. The same scenario was also
the case for maturity level 2. Maturity level 2 was called moderate implementation, in which the word moderate can easily be seen as a negative word. Therefore, it was
changed to “average implementation”. For maturity levels 3 and 4 not much has
changed. However, maturity levels 3 and 4 are switched around. In the paper of Ungerer (2018), maturity level 3 was called advanced implementation and level 4 was called semi-advanced implementation, however it should be switched. On top of that, both maturity levels are now more closely related to the maturity types proposed by IMPULS (2015). From being called semi-advanced and advanced implementation they are now called semi-advanced and advanced leaders. To finish it off, maturity level 5 has changed
from full implementation to “expert leaders”. This was a suggestion of one of the
specialists that looked through the maturity levels proposed in Ungerer (2018); this specialist proposed expert implementation instead of full implementation. In combination with the previously mentioned switch from implementation to leaders, the
maturity level is now called “expert leaders”.
4.2 Introducing the maturity types and providing argumentation for
using them
The maturity types are constructed in accordance with IMPULS (2015). In their study, three maturity types are proposed and referred to as the following: newcomers, learners
and leaders. Newcomers are defined as “companies that have never initialized first projects related to industry 4.0.” The learners did initialize some first projects related to industry 4.0. Leaders are ahead of other companies in their industry 4.0
implementation. “Newcomers” are added to maturity level 1, “learners” are added to
level 2 and “leaders” are added to maturity levels 3,4 and 5.
Figure 2. Maturity Levels and Maturity Types
4.3 The added value of implementing Radar Charts
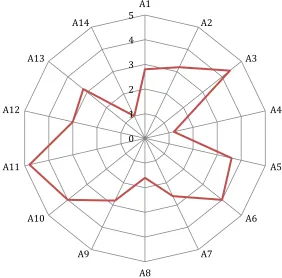
As previously stated, all measurement questions have five possible answer options. These answer options have been drafted in accordance with the ideas of Rensis Likert and reach from (1) not at all to (5) fully. The measurement questions are drawn up in such a way that (1) not at all is always the least favourable outcome and (5) fully is always the most favourable outcome. To give a graphic display of the scores for a respondent, radar charts are set up. A radar chart is a good way to visualize multivariate data to the respondent and it represents an easy visualization of the attributes, including visualisation of comparisons and differences in between aspects and measurement questions (Nowicki & Merenstein, 2016). One respondent will be provided with a radar chart for every aspect showing the average for the measurement questions of that aspect as shown in figure 3.Next to this the respondent will be provided with one radar chart for the average scores of all 14 aspects together as shown in figure 4. Thus a total of 15 radar charts are provided to the respondents that will be generated automatically by a tool that is explained in more detail in chapter 6.
An example is given on how to use the radar charts by using figure 3 and 4. In figure 3 one can see the scores of the measurement questions related to aspect 8. One can directly see that aspect 8 has five measurement questions shown as Q1-Q5. One can also directly see that Q4 is closer to the outside of the radar chart meaning that the respondent scores high on this measurement question. The average score of these five measurement questions is 2,8 ((3+3+1+5+2)/5)) meaning that aspect 8 has an average score of 2.8. The averages for all aspects are shown in figure 4. When we take the average scores of all 14 aspects and add them up one will get to an average of the whole
• Starting Implementation ("newcomers")
Level 1 (1-1,49)
• Average implementation ("learners")
Level 2 (1,5-2,49)
• Semi-Advanced Leaders ("leaders")
Level 3 (2,5-3,49)
• Advanced Leaders ("leaders")
Level 4 (3,5-4,49)
• Expert Leaders ("leaders")
scan, in other words all measurement questions. This average is used to put the respondent in one of the five maturity levels, which were already discussed previously.
0 1 2 3 4 5
Q1
Q2
Q3 Q4
Q5
Question scores
0 1 2 3 4 5
A1
A2
A3
A4
A5
A6
A7
A8 A9
A10 A11 A12
A13
A14
[image:37.595.65.337.120.379.2]Average score
Figure 3. Radar chart of the measurement questions of one aspect
[image:37.595.76.358.455.733.2]Step 5: Assessing the pre-designed scan through the
eyes of specialists
5.1 Introduction of the specialists
The following step in drafting the extended scan is to look at the pre-designed scan through the eyes of the experts. Until now, fifteen aspects have been constructed that measure industry 4.0 implementation in a wide range of business aspects. All of these business aspects contain measurement questions, which, if added up, totals 86 measurement questions. As mentioned before, the business aspects were all constructed from literature and an online exploration of existing scans. This means, that the business aspects that were constructed can be seen as reliable and valid to some extent, however a greater validity and reliability is aimed for. The same applies to the measurement questions, the maturity levels and the maturity types. The measurement questions were constructed based on the same exploration of existing scans. In total eleven existing scans were analysed, which had a total of 402 tested measurement questions that were used as inspiration for creating the measurement questions for the extended scan. Next to this, the measurement questions in the extended scan all meet the requirements that were formulated by seven papers that were found. This means that the measurement questions were constructed in the right way, which increases its validity and reliability. The maturity levels and maturity types were also constructed with the help of recognized sources.
In order to improve the reliability and validity of the pre-designed scan the expertise of multiple specialists was used. Multiple specialists were asked to look at parts of the pre-designed scan. A file was created in which an explanation was given of what kind of feedback was expected from them followed up by the aspects that the assessed. One can see the cover sheet with the explanation on it in appendix 2. Next to this, there was also a possibility to provide general feedback. All of this can be found in appendix 1, in which the specific feedback of the specialist per measurement question is written down. Next to this, one can see if the feedback has been implemented, partly implemented or rejected.