ORIGINAL RESEARCH
ADULT BRAIN
Accuracy of the Compressed Sensing Accelerated 3D-FLAIR
Sequence for the Detection of MS Plaques at 3T
X S. Toledano-Massiah,XA. Sayadi,X R. de Boer,XJ. Gelderblom,XR. Mahdjoub,XS. Gerber,XM. Zuber,XM. Zins, andXJ. Hodel
ABSTRACT
BACKGROUND AND PURPOSE:The use of 3D FLAIR improves the detection of brain lesions in MS patients, but requires long acquisition times. Compressed sensing reduces acquisition time by using the sparsity of MR images to randomly undersample the k-space. Our aim was to compare the image quality and diagnostic performance of 3D-FLAIR with and without compressed sensing for the detection of multiple sclerosis lesions at 3T.
MATERIALS AND METHODS: Twenty-three patients with relapsing-remitting MS underwent both conventional 3D-FLAIR and com-pressed sensing 3D-FLAIR on a 3T scanner (reduction in scan time 1 minute 25 seconds, 27%; comcom-pressed sensing factor of 1.3). Two blinded readers independently evaluated both conventional and compressed sensing FLAIR for image quality (SNR and contrast-to-noise ratio) and the number of MS lesions visible in the periventricular, intra-juxtacortical, infratentorial, and optic nerve regions. The volume of white matter lesions was measured with automatic postprocessing segmentation software for each FLAIR sequence.
RESULTS:Image quality and the number of MS lesions detected by the readers were similar between the 2 FLAIR acquisitions (P⫽.74 andP⫽ .094, respectively). Almost perfect agreement was found between both FLAIR acquisitions for total MS lesion count (Lin concordance correlation coefficient⫽0.99). Agreement between conventional and compressed sensing FLAIR was almost perfect for periventricular and infratentorial lesions and substantial for intrajuxtacortical and optic nerve lesions. Postprocessing with the segmentation software did not reveal a significant difference between conventional and compressed sensing FLAIR in total MS lesion volume (P⫽.63) or the number of MS lesions (P⫽.15).
CONCLUSIONS: With a compressed sensing factor of 1.3, 3D-FLAIR is 27% faster and preserves diagnostic performance for the detection of MS plaques at 3T.
ABBREVIATIONS:CNR⫽contrast-to-noise ratio; CS⫽compressed sensing; MAGNIMS⫽Magnetic Resonance Imaging in Multiple Sclerosis; PI⫽parallel imaging
T
he diagnosis of MS relies on the demonstration of the dissem-ination of white matter hyperintensities in space and time with MR imaging.1The FLAIR sequence plays a pivotal role inpatients with MS because it shows white matter lesions in specific locations (subtentorial, optic nerve,2juxtacortical,
periventricu-lar).1,3In its 3D implementation, FLAIR also improves the
detec-tion of small demyelinating lesions, resulting in better clinical-radiologic correlation.4
Despite the proved diagnostic advantage of 3D-FLAIR versus
2D-FLAIR, the longer scan time of the 3D version has so far hin-dered its adoption.
Compressed sensing (CS) is an acceleration technique newly available in MR imaging clinical routine. It uses the sparsity of MR images to randomly undersample thek-space, thus saving scan time.5-9Contrary to parallel imaging (PI), CS is insensitive to the
coil configuration. Because each acceleration technique imposes independent constraints on the image reconstruction, CS and PI can be used concurrently.10The combination of PI and CS we use
is serial. This feature makes the 2 acceleration techniques inde-pendent of one another; therefore, the PI sensitivity to coil con-figuration does not impact CS.11
There is no study yet regarding the effect of CS on diagnos-tic performance when applied to accelerate 3D-FLAIR acqui-sitions in patients with MS, to our knowledge. The aim of this study was to compare both image quality and diagnostic per-formance of 3D-FLAIR with and without CS in the clinical setting of MS.
Received September 3, 2017; accepted after revision November 3.
From the Departments of Radiology (S.T.-M., A.S., S.G., M.Zins) and Neurology (M.Zuber), Fondation Hoˆpital Saint-Joseph, Paris, France; Quantib B.V. (R.d.B., J.G.), Rot-terdam, the Netherlands; GE Healthcare (R.M.), Buc, France; and Department of Neuro-radiology (J.H.), AP-HP, Hoˆpitaux Universitaires Henri Mondor, Universite´ Paris est, Cre ´-teil, France.
Please address correspondence to Sarah Toledano-Massiah, MD, Department of Radiology, Fondation Hoˆpital Saint-Joseph, 185 rue Raymond Losserand, 75014 Paris, France; e-mail: [email protected]
MATERIALS AND METHODS
Patients and MR ImagingThis study was approved by our institutional review board, at Fondation Hôpital Saint Joseph. Informed consent was ob-tained from all patients. From January 2017 to April 2017, twenty-three consecutive patients with relapsing-remitting MS according to the revised McDonald criteria1(14 women; mean
age, 47 years; range, 21–77 years) underwent MR imaging for their routine follow-up (3T Discovery MR750; GE Healthcare, Milwaukee, Wisconsin) using a 32-channel head coil.
MR imaging protocol included DWI, 3D gradient-echo magnetization-prepared T1-weighted BRAVO (GE Health-care; isotropic voxel, 0.9 mm), T2WI, and 3D-FLAIR imaging, without administration of contrast agent. The 3D-FLAIR se-quence was performed twice with and without the addition of CS. A CS acceleration factor of 1.3 was used, leading to a 27% reduction in scan time (1 minute 25 seconds). Both FLAIR sequences were strictly identical except for the addition of CS. All 3D-FLAIR, with and without CS, were acquired in the sag-ittal plane with a PI acceleration auto-calibrating reconstruc-tion for Cartesian imaging factor of 2.
Imaging parameters are summarized inTable 1.
Preliminary Study in Healthy Volunteers
To identify the most suitable CS acceleration factor, we per-formed 3D-FLAIR acquisitions, 1 without CS, and 4 with differ-ent CS factors (1.2, 1.3, 1.4, 1.5) on 5 healthy volunteers.
The FLAIR acquisitions were all identical except for the CS acceleration factor and the related scan time.
For each FLAIR acquisition, image quality was rated on a 3-point scale: 1, “poor” (image quality insufficient for diagnos-tic purposes); 2, “good” (minor artifacts not impairing diag-nosis); and 3, “excellent” (no artifacts). We based the image-quality rating on 3 criteria: delineation of deep brain nuclei and the cortical gray-white matter junction, suppression of CSF, and blurring.
The purpose of this preliminary study in healthy volunteers was to identify the highest scan time reduction of 3D-FLAIR with CS compatible with an image quality score of at least 2 for all 3 criteria.
Image Analysis
Qualitative Analysis in Patients with MS. All FLAIR images were first anonymized and randomly interpreted. Then, all images were blindly and independently assessed by 2 neuroradiologists (S.T.-M. and A.S., with 9 and 4 years of experience, respectively) on the available workstation (Advantage Workstation 4.6; GE Healthcare). Each patient was analyzed only once per session, with either conventional FLAIR or CS FLAIR. The 2 independent blinded readings took place 2 weeks apart to avoid recall bias. Image quality was rated on the same 3-level scale used in the preliminary study. We also evaluated CSF suppression, delinea-tion of deep brain nuclei, and the gray-white matter juncdelinea-tion on the same scale.
For each FLAIR acquisition, the readers counted the number of visible MS lesions involving periventricular, intra-juxtacorti-cal, infratentorial, and optic nerve regions (as used to assess spa-tial dissemination using the McDonald revised or Magnetic Res-onance Imaging in Multiple Sclerosis criteria [MAGNIMS]3). A
lesion was defined as a focal T2-weighted hyperintensity sur-rounded by normal isointense white matter. Only lesions of⬎3 mm along the longest axis were considered. Confluent lesions without precise delineation were considered a single lesion.
Finally, discrepancies between the reviewers as to whether a lesion was present were resolved in consensus with a third rater with 15 years of experience (J.H.). Statistical analysis was based on postconsensus lesion counts (consensus reading inTable 2).
Quantitative Analysis in Patients with MS. Contrast-to-noise ra-tio (CNR) and SNR analyses were performed by 1 neuroradiolo-gist (S.T.-M.). For each patient and each FLAIR acquisition, ROIs were drawn on axial reformatted views, within the following: 1) an MS lesion, 2) normal-appearing white matter, and 3) back-ground noise. Care was taken to avoid lesion borders. SNR and CNR were calculated as follows: SNR⫽SI/SDnoiseand CNR⫽
(SIlesion⫺SIWM)/SDnoise,where SI is the average signal intensity
of the lesion or the WM and SDnoiseis the SD of the noise.
An automatic postprocessing was additionally performed with Quantib Brain 1.2 software (Quantib, Rotterdam, Netherlands) based on de Boer et al.12We analyzed 2 sets of series: 1) the
[image:2.594.300.528.51.162.2]BRAVO T1-weighted scan in combination with the conventional FLAIR scan, and 2) the BRAVO T1-weighted scan in combination with CS FLAIR scan. We used Quantib Brain to quantify the vol-ume and the total number of brain MS lesions visible on both FLAIR sequences, based on the automatic segmentation of white
Table 1: Imaging parameters for the CS and conventional 3D-FLAIRa
Parameters CS 3D-FLAIR
TE/TI/TR (ms) 140/2064/8000
ETL 220
FOV (frequency⫻phase) (mm) 260⫻221
Slice thickness (mm) 1.2 mm
Matrix (frequency⫻phase) 288⫻256
NEX 1
Bandwidth (Hz/pixel) 347.2
ARC factor (phase⫻slice) 2.0⫻2.0 CS 3D-FLAIR/conventional 3D-FLAIR
CS factor 1.3 NA
Scan time (min:sec) 3:50 (⫺27%) 5:15
Note:—ETL indicates echo-train length; ARC, auto-calibrating reconstruction for Cartesian imaging (acceleration using parallel imaging technique); NA, not applicable.
a
CS allowed a 27% reduction in scan time of the 3D-FLAIR sequence.
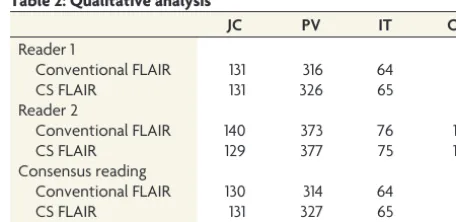
Table 2: Qualitative analysisa
JC PV IT ON
Reader 1
Conventional FLAIR 131 316 64 8
CS FLAIR 131 326 65 8
Reader 2
Conventional FLAIR 140 373 76 10
CS FLAIR 129 377 75 10
Consensus reading
Conventional FLAIR 130 314 64 8
CS FLAIR 131 327 65 8
Note:—JC indicates juxtacortical; PV, periventricular; IT, infratentorial; ON, optic nerve.
a
matter hyperintensities. Using such postprocessing, we took all the MS lesions into account, including those involving the deep white matter.
Statistical Analysis
The Lin concordance correlation coefficient was used to assess interrater agreement and intrareader agreement for total MS le-sion count and was interpreted as follows: poor agreement (⬍0.90), moderate agreement (0.90 to⬍0.95), substantial agree-ment (0.95 to⬍0.99), and almost perfect agreement (ⱖ0.99).13
The Studentttest was used to compare image-quality scores be-tween conventional and CS FLAIR. The Wilcoxon signed rank test was performed to test the null hypothesis that there was no significant difference in the total number of MS lesions between conventional and CS FLAIR, based on the radiologists’ count. The level of significance was set toP ⬍.05. The Lin concordance correlation coefficient was also used to evaluate the agreement between conventional and CS FLAIR in terms of the number of lesions detected in each region. Statistical analysis was based on postconsensus lesion counts.
The Studentttest was used to compare SNR and CNR values between conventional and CS FLAIR. The total volume of MS lesions between the 2 FLAIR scans, as measured by automatic white-matter hyperintensity segmentation, was compared using the Wilcoxon signed rank test.
RESULTS
Qualitative data are shown inTable 2.
Preliminary Study in Healthy Volunteers
Scan times of the different FLAIR acquisitions, without CS and with a CS factor of 1.2, 1.3, 1.4, and 1.5, were 5 minutes 15 sec-onds, 4 minutes 10 secsec-onds, 3 minutes 50 secsec-onds, 3 minutes 30 seconds, and 3 minutes 22 seconds, respectively. CS acceleration factor values of 1.4 and 1.5 were disqualified due to a poor delineation (rated 1) of the cortical gray matter junction. A CS factor of 1.3 provided the highest scan time reduction with good (mean score, 2.5) image quality. The CS factor 1.2 yielded only marginally improved image quality (mean score, 2.6) compared with the CS factor 1.3 and was 20 seconds shorter. As a result, the CS factor 1.3 was retained for the patient study.
Qualitative Analysis in Patients with MS
Interrater agreement as measured by the Lin concordance corre-lation coefficient was substantial (score of 0.95), and intrarater agreement was almost perfect (score, 0.99).
Image-quality scores did not differ between conventional and CS FLAIR (P⫽.74). Mean image-quality scores were 2.78⫾0.42 for conventional FLAIR, and 2.73⫾0.44 for CS FLAIR. All FLAIR images were rated at least good. CSF suppression, delineation of the deep brain nuclei, and junction delineation were identical between every set of FLAIR images and rated as excellent. Of the 23 CS FLAIR acquisitions, 6 acquisitions were rated good instead of excellent due to a slight image blurring that did not impair diagnosis.
The total number of MS lesions detected by readers was similar between conventional and CS FLAIR (542 versus 557,P⫽.094). The correlation coefficient between conventional and CS
FLAIR for the total MS lesion count after consensus was almost perfect (score, 0.99). Agreement between conventional and CS FLAIR was almost perfect for periventricular and infratentorial lesions (score, 0.99;Fig 2) and substantial for intra-juxtacortical and optic nerve lesions (score, 0.98;Figs 1and3).
Quantitative Analysis in Patients with MS
There was no statistical difference between the 2 FLAIR sequences in the SNR of normal-appearing white matter (P⫽.57), the SNR
FIG 1. Coronal reformatted views of 3D-FLAIR with (A) and without (B) CS, showing a juxtacortical lesion involving the right frontal supe-rior gyrus (arrows) in a 50-year-old female patient with relapsing-remitting MS. Note the similar delineation of the gray-white matter junction between conventional and CS FLAIR.
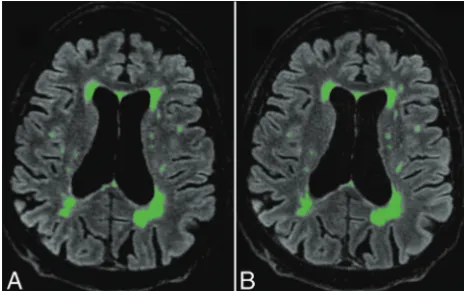
FIG 2. Axial reformatted views of 3D-FLAIR with (A) and without (B) CS, showing a periventricular MS lesion also involving the left middle cerebellar peduncle (arrows) in a 31-year-old female patient with re-lapsing-remitting MS. Note the excellent and similar suppression of CSF obtained with both sequences.
[image:3.594.301.532.47.153.2] [image:3.594.301.533.217.336.2] [image:3.594.302.532.400.560.2]of MS lesions (P⫽.49), and the CNR of MS lesions to normal-appearing white matter (P⫽.52).
Postprocessing with Quantib Brain 1.2 software did not reveal any significant difference between conventional and CS FLAIR in total MS lesion volume (P⫽.63) or in the number of MS lesions (P⫽.15) automatically measured (Fig 4).
DISCUSSION
Reducing the MR imaging scan time may improve patient com-fort, cost-effectiveness, motion-related artifacts, and thus repro-ducibility. This improvement may be particularly useful for 3D FSE sequences, such as FLAIR, that usually require long acquisi-tion times. In this study, we found that by adding CS to standard PI acceleration strategies, we can reduce the scan time of 3D-FLAIR by 27% (1 minute 25 seconds) while preserving the accu-racy of the detection of MS plaques. This result appears clinically relevant, considering the widespread use of 3D-FLAIR in MR im-aging protocols dedicated to MS.4Additionally, the agreement
of results produced automatically by postprocessing further strengthens our conclusion, providing an unbiased analysis and taking into account all the visible MS lesions, including those involving the deep white matter.
To our knowledge, the combination of PI and CS to achieve FLAIR imaging has never been evaluated in patients with MS. The use of CS in neuroimaging has been evaluated in healthy volun-teers with diffusion imaging14and in patients with intracranial
aneurysms using TOF-MRA.15Our results are also fully
concor-dant with recent studies evaluating CS in cardiac, abdominal, or knee imaging.16-19Indeed, these studies have shown comparable
image quality and lesion conspicuity between accelerated and nonaccelerated sequences. Admittedly, higher CS factors and scan time reductions can be achieved in MR sequences producing high contrast images with high data sparsity such as TOF-MRA, but such analysis is beyond the scope of the present study.
We observed image blurring in some of the CS FLAIR ac-quisitions. Such findings appear inherent to the CS technique that uses a variable random undersampling of the k-space, more pronounced at the periphery, thus leading to blurred images. While the quality of CSF suppression was identical in
CS FLAIR and conventional FLAIR, a slight difference in deep brain nuclei and gray-white matter junction delineation was observed due to minor motion-related blurring that did not affect the diagnostic performance. We used a simplified 3-point scale to evaluate image quality. A more detailed scale may have exposed these minor differences, even though they have no impact on diagnostic performance.We performed ac-celerated FLAIR with a CS factor of 1.3 after testing a wide range of acceleration factors (detailed in the preliminary study) because this value appeared to us as a good compromise among blurring, reduced scan time, and accuracy.
In this study, we aimed at reducing the scan time of the 3D-FLAIR sequence with CS and evaluated its diagnostic per-formance. However, CS could also be used to further improve image quality in the same acquisition time of the conventional sequence by, for example, increasing the spatial resolution and/or contrast. Such an approach could be particularly useful to reduce partial volume effects and improve delineation of the cortical ribbon.
Of note, the diagnostic performance of both conventional and CS FLAIR appeared similar regardless of the topography of the inflam-matory lesions, including those involving the optic nerves. Such find-ings may be particularly relevant in patients suspected of having MS and for whom spatial dissemination is customarily evaluated on the basis of FLAIR images.1
This study has some limitations. First, we did not include healthy controls since SNR values were also measured within the normal-appearing white matter of patients. Second, the number of MS lesions detected tended to differ between the 2 blinded readers (particularly for periventricular lesions). Such differences may be related to the small size of some lesions. However, both readers found no significant difference between conventional and CS FLAIR, whatever the lesion topography. We did not evaluate the impact of the acceleration factor value on diagnostic perfor-mance because we systematically applied a previously determined (by a preliminary study) CS factor of 1.3. Such a study design would have led to an important increase in protocol duration, which was not acceptable in a clinical setting. Further studies may investigate the optimal combination of acceleration factors of PI and CS according to the artifacts observed. Because we only in-cluded follow-up MRIs of patients with relapsing-remitting MS, we did not evaluate the performance of CS FLAIR in other types of MS, such as clinically isolated syndrome. However, it is reason-able to expect that the detectability of MS plaques using FLAIR may not differ according to MS types.
CONCLUSIONS
3D-FLAIR with a CS acceleration factor of 1.3 appeared to be the best compromise between scan time reduction and diagnostic performance in the detection of MS lesions.
Disclosures: Renske de Boer—UNRELATED:Employment: Quantib B.V.,Comments: Quantib B.V. developed Quantib Brain;Royalties: GE Healthcare,Comments: Quantib B.V. receives royalties from GE Healthcare for Quantib Brain sales.* Jaap Gelderblom— UNRELATED:Employment: Quantib B.V.,Comments: Quantib B.V. developed Quantib Brain;Royalties: GE Healthcare,Comments: Quantib B.V. receives royalties from GE Healthcare for Quantib Brain sales*. Rachid Mahdjoub—UNRELATED:Employment: GE Healthcare,Comments: I am the neuroclinical leader; thus, I provide support and collab-orate with research activities of our customers. *Money paid to the institution. FIG 4. Automatic postprocessing performed with Quantib Brain 1.2
[image:4.594.53.285.48.193.2]REFERENCES
1. Polman CH, Reingold SC, Banwell B, et al.Diagnostic criteria for multiple sclerosis: 2010 revisions to the McDonald criteria.Ann Neurol2011;69:292–302CrossRef Medline
2. Aiken AH, Mukherjee P, Green AJ, et al.MR imaging of optic neu-ropathy with extended echo-train acquisition fluid-attenuated in-version recovery.AJNR Am J Neuroradiol2011;32:301– 05CrossRef Medline
3. Filippi M, Rocca MA, Ciccarelli O, et al; MAGNIMS Study Group. MRI criteria for the diagnosis of multiple sclerosis: MAGNIMS con-sensus guidelines.Lancet Neurol2016;15:292–303CrossRef Medline
4. Moraal B, Roosendaal SD, Pouwels PJW, et al.Multi-contrast, iso-tropic, single-slab 3D MR imaging in multiple sclerosis.Eur Radiol
2008;18:2311–20CrossRef Medline
5. Donoho DL.Compressed sensing.IEEE Transactions on Information Theory2006;52:1289 –306CrossRef
6. Kayvanrad M, Lin A, Joshi R, et al.Diagnostic quality assessment of compressed sensing accelerated magnetic resonance neuroimag-ing.J Magn Reson Imaging2016;44:433– 44CrossRef Medline
7. Geethanath S, Reddy R, Konar AS, et al.Compressed sensing MRI: a review.Crit Rev Biomed Eng2013;41:183–204CrossRef Medline
8. Lustig M, Donoho D, Pauly JM. Sparse MRI: the application of com-pressed sensing for rapid MR imaging.Magn Reson Med2007;58: 1182–95CrossRef Medline
9. Vasanawala SS, Alley MT, Hargreaves BA, et al.Improved pediatric MR imaging with compressed sensing.Radiology2010;256:607–16
CrossRef Medline
10. Lustig M, Pauly JM.SPIRiT: iterative self-consistent parallel imag-ing reconstruction from arbitrary k-space.Magn Reson Med2010; 64:457–71CrossRef Medline
11. King K, Xu D, Brau AC, et al.A new combination of compressed sensing and data driven parallel imaging.In:Proceedings of the An-nual Meeting of the International Society for Magnetic Resonance in Medicine,Stockholm, Sweden. May 1–7, 2010:4881
12. de Boer R, Vrooman HA, van der Lijn F, et al.White matter lesion extension to automatic brain tissue segmentation on MRI. Neuro-image2009;45:1151– 61CrossRef Medline
13. Lin LI.A concordance correlation coefficient to evaluate reproduc-ibility.Biometrics1989;45:255– 68CrossRef Medline
14. Menzel MI, Tan ET, Khare K, et al.Accelerated diffusion spectrum imaging in the human brain using compressed sensing.Magn Reson Med2011;66:1226 –33CrossRef Medline
15. Fushimi Y, Fujimoto K, Okada T, et al.Compressed sensing 3-di-mensional time-of-flight magnetic resonance angiography for ce-rebral aneurysms: optimization and evaluation.Invest Radiol2016; 51:228 –35CrossRef Medline
16. Basha TA, Akc¸akaya M, Liew C, et al.Clinical performance of high-resolution late gadolinium enhancement imaging with compressed sensing. J Magn Reson Imaging 2017;46:1829 –38
CrossRef Medline
17. Feng L, Benkert T, Block KT, et al.Compressed sensing for body MRI.J Magn Reson Imaging2016;45:966 – 87CrossRef Medline
18. Seo N, Park MS, Han K, et al.Feasibility of 3D navigator-triggered magnetic resonance cholangiopancreatography with combined parallel imaging and compressed sensing reconstruction at 3T.J Magn Reson Imaging2017;46:1289 –97CrossRef Medline