ORIGINAL ARTICLE
Efficient color routing with a dispersion-controlled
waveguide array
Yi-Kun Liu
1, Si-Cong Wang
1, Yong-Yao Li
1, Li-Yan Song
1, Xiang-Sheng Xie
1, Ming-Neng Feng
1, Zhi-Ming Xiao
1,
Shao-Zhi Deng
1, Jian-Ying Zhou
1, Jun-Tao Li
1,3, Kam Sing Wong
2and Thomas F Krauss
3Splitting white light into its constituent spectral components has been of interest ever since Newton first discovered the phenomenon of color separation. Many devices have since been conceived to achieve efficient wavelength separation, yet a large number of applications, e.g., in display technology, still use simple color absorption or rejection filters that absorb or reflect unwanted wavelengths, thus wasting luminous energy. Here, we demonstrate a novel microsized device concept that enables efficient color routing. The device operation is based on differential material dispersion in a waveguide array, which causes different wavelength signals to couple selectively into appropriate waveguides. A theoretical power delivery of greater than 50% for a tricolor wavelength router is obtained, compared to 33% expected from geometry alone. The principle of operation is demonstrated experimentally for a dual-color light field, where we achieve a higher than 70% routing efficiency (compared to 50% from geometry), thus highlighting the feasibility of this novel and promising approach.
Light: Science & Applications(2013)2,e52; doi:10.1038/lsa.2013.8; published online 1 February 2013 Keywords: color filters; dispersion; propagation; route; waveguides
INTRODUCTION
The color filter matrix that is used in a liquid crystal display (LCD) system consists of a tricolor RGB absorptive element in each pixel1and is one of the most ubiquitous filter technologies available on the market today.2Surprisingly, it only has a maximum theoretical efficiency of 1/3 because of the geometric arrangement, so it intrinsically wastes at least 2/3 of the incoming light signal.3The efficiency achieved in practice tends to be even much smaller than 1/3. This wastage is especially unfavorable for battery-run personal devices, such as personal pad computers and mobile phones. Designing and fabricating an efficient and microsized color filter matrix that has an intrinsically larger color-splitting ratio than the theor-etical maxium of 1/3 for LCD is therefore highly desirable.
Conventional band-pass filters are based on one of three different principles: dispersion, interference or absorption. The dispersive type is typically realized with a grating or a prism4,5and its efficiency for light separation can be high, yet the volume of the dispersive element is too bulky to be used for the large number of pixels in a display device. Interference-based filters offer well-controlled transfer functions, but they reject rather than redirect the unwanted part of the spectrum and their fabrication cost is also high. Therefore, color filtering is usually accomp-lished with an absorptive color filter matrix, which offers the lowest cost, but also the lowest transmission efficiency of the three types of filters.6
As a novel solution, we propose a dispersive waveguide approach. Transferring optical signals using waveguides is common practice in
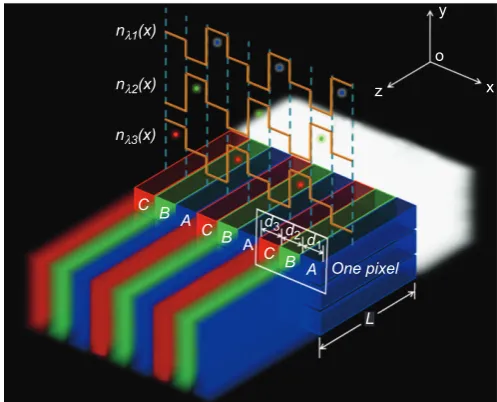
integrated optics, where light beams propagate in areas of higher refract-ive index.7,8If one considers an array with each ‘pixel’ consisting of a combination of waveguides with wavelength-dependent dispersion (as shown in Figure 1), different wavelength signals will be drawn into the corresponding waveguides with the highest refractive index for that particular color. Thus, the optical power impinging on the array is not blocked but is instead routed into its designated channel, so a power transmission exceeding the geometrical limit becomes possible.
We exemplify the principle of our color separation method with a waveguide array schematically shown in Figure 1. The method is based on a resonantly absorbing photonic lattice9,10that has recently been demonstrated experimentally.11,12We show theoretically that each of the three R, G and B wavelength windows can be delivered to a specific waveguide, with the power transmission exceeding 50%. As a proof of principle, we demonstrate the method experimentally by using a color filter matrix in a photoresist, and measure the separation process directly using a confocal mircoscope. We achieve a well-defined color separation of the input light field and a routing efficiency that is significantly higher than expected from geometry alone.
MATERIALS AND METHODS
Simulation
The waveguide array displayed in Figure 1 consists of three different mate-rials with absorption spectra as shown in Figure 2a. The corresponding
1State Key Laboratory of Optoelectronic Materials and Technologies, Sun Yat-sen University, Guangzhou 510275, China;2Department of Physics, Hong Kong University of
Science and Technology, Clear Water Bay, Kowloon, Hong Kong, China and3SUPA, School of Physics and Astronomy, University of St Andrews, St Andrews, Fife, KY169SS, UK
Correspondence: JY Zhou, State Key Laboratory of Optoelectronic Materials and Technologies, Sun Yat-sen University, Guangzhou 510275, China E-mail: [email protected]
Or TF Krauss, SUPA, School of Physics and Astronomy, University of St Andrews, St Andrews, Fife, KY169SS, UK E-mail: [email protected]
dispersive curves are shown in Figure 2b, calculated from the Kramers–Kronig (KK) relationship. In the paraxial approximation, a light field propagating through this matrix can be described by the following Schrodinger-like equation:13
iLE
Lz~{ 1 2k
L2E
Lx2{ X3
j~1
(k0Dnjz iaj
2 )Rj(x)E ð1Þ
We consider three types of absorbing materials (AMs) doped into the background material to create the color dependence. The doping density is assumed to be small, in the order of 2 mol l21, so that the change of the refractive index for wavelengths away from the absorp-tion peak is small. In the vicinity of the absorpabsorp-tion peak, however, the dispersion is very strong. A unit cell of the structure consists of three-channel waveguides that are periodically arranged to form a composite array. In Equation (1),k5k0n, wheren51.62 is the refractive index of the background material,k0is the vacuum wave vector,aj(j51, 2, 3)
are the absorption coefficients of the three AMs, respectively andDnj
(j51, 2, 3) are the corresponding refractive index changes induced by the three absorption coefficients. The relation between the absorption coefficients and the corresponding index changes satisfies the KK relationship.Rj(x) (j51, 2, 3) are the three structure absorption
func-tions of the AMs.
We assume that the absorption coefficient of each of the three AMs has a Lorentzian lineshape centred atlj0:
aj~ Lj
(l{l0)2zc2j
(j~1,2,3) ð2Þ
The termLj=c2j then represents the maximum value of the absorp-tion coefficient, and in our simulaabsorp-tion the absorpabsorp-tion coefficient is 0.52mm21, which is the maximum value of the absorption coefficient of rhodamine B (RhB) that we use in the experiment described below. 2cjis the linewidth of the Lorentzian line shape. According to the KK relationship, the corresponding refractive index change is obtained by:
Dnj(l)~ 1 2p2
ð a
jl0 1{(l0=l)2dl
0 ð3Þ
The purpose of the structure is to obtain efficient color separation; hence the structure design should help us to achieve the largest trans-mittance and relatively lowest crosstalk rate for a collinearly propagat-ing tricolor input. We used a simulated annealpropagat-ing (SA) algorithm14to determine the optimal material parameters and the propagation dis-tance. Here, we select the wavelengths of 434 nm (blue), 544 nm (green) and 611 nm (red) as the three primary colors, which are the main emission peaks of a Cold Cathode Fluorescent Lamp.
Sample fabrication
The sample consists of alternating waveguides made of SU-8 polymer and SU-8 doped with RhB (2 wt-%). The fabrication process is as follows, with more detail provided in Ref. 12:
1. The photoresist SU-8 is doped with RhB, which is then coated onto a glass substrate, photo exposed and developed. The wave-guides are 5mm wide and spaced by 10mm. The SU-8 film is 10mm thick.
2. We fill the interstitial voids by spin-coating SU-8 without dye onto this template.
nλ1(x)
nλ2(x)
nλ3(x)
z x
o y
One pixel A
d1 d2 d3
B C
A
B C A B C
[image:2.595.46.295.69.270.2]L
Figure 1 Schematic of a two-dimensional microcolor filter matrix. The different
colors represent the three different waveguide materials. The functionsnl1(x),
nl2(x) andnl3(x) describe the refractive index distributions for the different
wavelengthsl1,l2,l3. The parametersd1,d2,d3specify the widths of the
waveguide channels A, B and C, respectively.
0.6
a 434 nm 544 nm b
350 400 450 500 550 600
λ (nm) λ (nm)
650 700 350 400 450 500 550 600 650 700
611 nm 434 nm
0.015
0.01
0.005
0
-0.015 -0.01 -0.005
544 nm 611 nm
AM1 AM2 AM3
Δ
n
AM1 AM2 AM3 0.5
0.4
0.3
α
(
µ
m
-1)
0.2
0.1
0
[image:2.595.60.548.542.715.2]3. We perform a blanket exposure of the array in order to ensure that both types of SU-8 are equally crosslinked, hence have the same refractive index.
4. Finally, we pattern an access waveguide into the undoped section of the SU-8 in order to facilitate transmission measurements.
Measurement
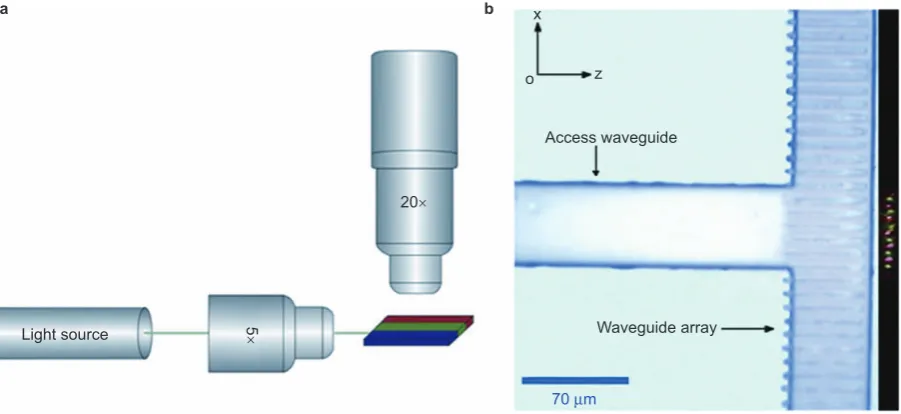
The measurement set-up is shown in Figure 3a where we use a He–Ne laser at the wavelengthl5633 nm and a Nd:YVO4 laser at 532 nm to measure the guiding effect in the waveguide array. Both radiation with different wavelength are coupled into the waveguide array simulta-neously via dicholric beam splitter. A microscope objective with NA50.10 is used to laser radiation with both wavelengths into the access waveguide, from where it is injected into the waveguide array (Figure 3b). We use another microscope objective to observe the scat-tered light and trace the propagation of the light. The propagation was monitored using the scanning confocal configuration of a near-field scanning microscope (WITec Alpha 300S).
RESULTS AND DISCUSSION
Theoretical analysis and numerical simulations
The numerically optimized results show that the transmission can be optimized when the absorption centers are located at 427, 520 and 578 nm, and their absorption line widths are 2, 6 and 10 nm. The period, the length and the duty cycle of the structure then need to be 5 mm, 53.5 mm and 1 : 1 : 1. In Figure 2, the curves of the absorption and corresponding refractive index changes are plotted based on these parameters, highlighting that they meet the above requirements. The required absorption characteristics can be achieved, for example, with semiconductor quantum dots or with organic dyes.
According to Fermat’s principle and analogous to the situation in an optical fiber, light tends to propagate in the material with the highest refractive index, thus, blue light will prefer to propagate in channel A, green light in channel B and red light in channel C. Here,
for blue light, the highest refractive index is located in channel A, for green light, the highest refractive index is located in channel B, and for red light, the highest refractive index is located in channel C.
Typically, the effective area of a waveguide is used to describe its confinement of an optical mode, but this parameter does not provide sufficient information on the spatial and wavelength dependent light field distribution.15Thus, we define the parameterC, which denotes the overlap integral between the optical intensity in a specific waveguide and the total intensity at a given positionz, which can be understood as an effective cross-section of the waveguide for the spe-cific wavelength of interest.
C~ Ð
i
I(x,z,l)dx Ð?
{?I(x,z,l)dx
i5A, B, C (4)
By calculating theCfactor as a function of position, the evolution of the light field for a given wavelength in the waveguide can be observed.
The terms ð
i
I(x,z,l)dxare calculated with all waveguides doped with
AM1, AM2 and AM3, respectively.
As an example, we consider theCfactor as a function ofzin wave-guide A (Figure 4a). TheCfactor is initially 33.3% and is the same for all three colors. It then increases for the blue light in accordance with waveguide A’s higher refractive index in the blue, whileCdecreases for green and red, as these colors are not guided. The increase is explained by the fact that blue light will couple into the higher index region, thus increasing the effective cross-section of the corresponding waveguide, so the optical power of 434 nm light in waveguide A increases beyond the fraction expected by geometry, i.e., 1/3. Waveguides B and C have the same effect on green and red light, respectively (Figure 4b and 4c). A further increase in the waveguide length will then result in a back-flow of the light field into the initial waveguides, as well as increased absorption, thus again reducing the transmission efficiency.
The calculatedC factors clearly highlight that light of different colors will concentrate in different waveguides by guiding and focu-sing the light field into specific output ports. Hence, an efficient color
Access waveguide
20×
5
×
a b
Waveguide array
70 µm
Light source
z x
[image:3.595.71.522.70.277.2]o
Figure 3 (a) Optical setup for measuring the color separation in a waveguide array. (b) Microscopic image of the sample structure. The scattering light distribution of
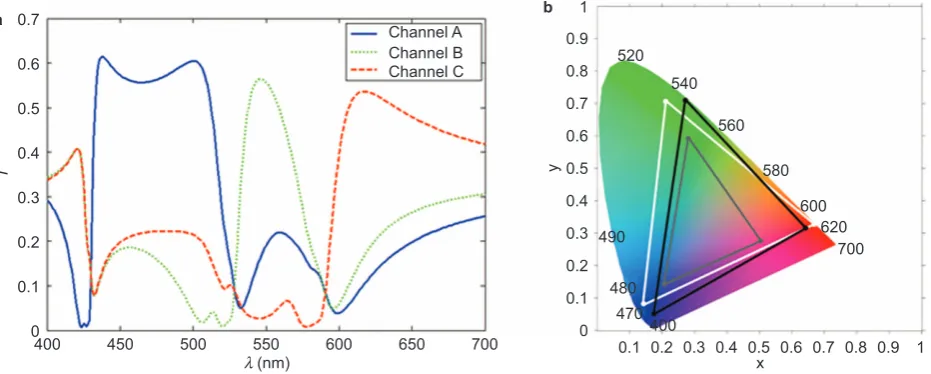
separation is achieved with each waveguide acting as a color filter. In addition, we calculated the full transmission spectrum of each wave-guide (Figure 5a). The color gamut of the wavewave-guide array is shown in Figure 5b. In our calculation, the gamut of the waveguide array (shown in gray) is about 40.18% of the NTSC color gamut, which is undesir-able. We therefore propose to use the router together with a conven-tional filter array. In our calculation, the transmission of a convenconven-tional blue filter for wavelengths of 434, 544 and 611 nm is 70%, 19.3% and 1%; the transmission of a conventional green filter for wavelengths of 434, 544 and 611 nm is 2.9%, 83% and 24.1%; the transmission of a conventional red filter for wavelengths of 434, 544 and 611 nm is 2.1%, 0% and 16.2%.16The waveguide array acts as a router for colors, and a conventional color filter array, either absorptive or based on interfer-ence, can be placed at the end facet of the waveguide array to suppress the cross-talk. The color gamut can then be increased to 91%, while maintaining the 1.63higher transmission into the desired channels.
The color filters show fairly large spectral bands, allowing their application with a white light LED as the backlight source.
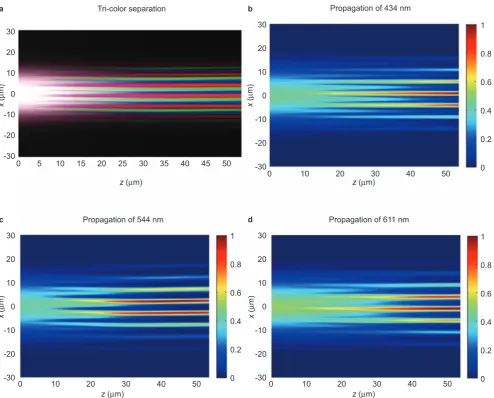
The operation of the waveguide array with a white light input is shown in Figure 6 where we clearly observe how the input is channeled and color-filtered into the respective waveguides. The transmittance is dependent on the propagation distance, with the maximum transmis-sion reaching more than 50%, for a propagation distance of 53.5mm.
The corresponding transmittance, crosstalk and absorption values of the array are shown in Table 1. The noticeable loss of input power is mainly due to the optical absorption that gives rise to the dispersion in the first place, yet the actual channeling efficiency exceeds 52% with the absorption being taken fully into account.
Experimental demonstration of color separation
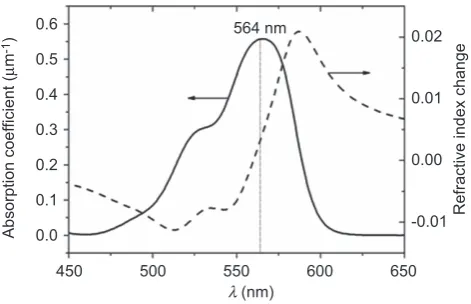
We fabricated a waveguide array to demonstrate the method experi-mentally, using two different dispersive materials as a proof of prin-ciple for dual color separation. The sample consists of alternating waveguides made of SU-8 photoresist polymer and SU-8 doped with RhB. The absorption peak of RhB is located at 564 nm, thus the refractive index of SU-8 doped with RhB on the shorter wavelength side of the peak is lower than the background medium, while on the longer wavelength side the refractive index is higher. The absorption spectrum and corresponding refractive index change were calculated using the KK relationship and are shown in Figure 7. According to the previous discussion, light of a wavelength shorter than 564 nm (green) will propagate in the undoped SU-8 waveguide and light of a length longer than 564 nm (red) will propagate in the doped wave-guide. The process of channeling the different colors into their specific waveguides is mapped with a confocal microscope. The results shown in Figure 3b and Figure 8 clearly demonstrate that light waves of 633
0.7
a
Channel A Channel B Channel C 0.6
0.5
0.4
0.3
0.2
0.1
0
0.7 0.8 0.9
520
490
480
470 400
540
560
580
600 620
700 1
b
0.6
0.5
y
T
0.4
0.3
0.2
0.1
0.7 0.8 0.9 1
0.6 0.5
x 0.4 0.3 0.2 0.1 0
400 450 500 550
λ (nm)
[image:4.595.56.551.71.213.2]600 650 700
Figure 5 (a) Theoretical transmission spectra of waveguide A (blue), waveguide B (green) and waveguide C (red). (b) Color gamut of NTSC (white), our waveguide
array (gray) and a waveguide array with an additional color filter array (black).
434 nm 0.8
a b c
0.7
0.6
0.5
0.4
0.3
0.2
0.1
0
0 10 20 30
z (µm) 40 50 60 0 10 20 z (30µm) 40 50 60 0 10 20 z (30µm) 40 50 60 0.8
0.7
0.6
0.5
0.4
0.3
0.2
0.1
0
0.8
0.7
0.6
0.5
0.4
0.3
0.2
0.1
0 544 nm
611 nm
434 nm 544 nm 611 nm
434 nm 544 nm 611 nm
Γ
Γ
Γ
Figure 4 Calculation result ofCfactor as a function of z in waveguide A (a), waveguide B (b) and waveguide C (c) for 434 nm (blue), 544 nm (green) and 611 nm (red),
[image:4.595.71.537.518.705.2]and 532 nm are indeed well separated with gradual increases in the corresponding intensities. The data in Figure 8 were obtained by mea-suring the scattered light from the waveguide array using a confocal imaging technique. The intensity of the scattered signal depends not only on the actual intensity inside the waveguide, but also on the quality of the waveguide array. The optical quality in the input and end facets of the specific waveguides used here was not as perfect as that along the waveguide, so the scattering from the facets becomes dominant over that from the waveguide. For this reason, only the central part of the waveguide array is included in our measurement for Figure 8. Although the measurements do not include the total length of the waveguide array, transmission values of above 70% are
being observed for both green and red light, respectively (compared to 50% from geometry). Notice that the geometric limit gives rise to an intensity distribution with the transmission never exceeding the intensity at the input facet. The measured results show a significant enhancement, which is in good agreement with the simulations shown in the Figure 4.
CONCLUSION
We have presented a new approach for designing a microsized optical filter array that affords the separation of different colors with a higher efficiency than the 33% expected by geometry alone. We use a
wave-Table 1 Transmittance and absorption of the dispersive waveguide array
Wavelength (nm)
Channel A Channel B Channel C
Transmittance (%) Absorption (%) Transmittance (%) Absorption (%) Transmittance (%) Absorption (%)
434 56.46 24.08 8.86 0.76 9.08 0.76
544 14.47 0.06 56.07 19.24 2.69 7.47
611 7.59 0.02 13.05 0.74 52.60 26.00
30
20
10
-30
0 5 10 15 20
Tri-color separation
a b
d c
Propagation of 434 nm
Propagation of 611 nm Propagation of 544 nm
25
z (µm) z (µm)
z (µm) z (µm)
x
(
µ
m)
x
(
µ
m)
x
(
µ
m)
x
(
µ
m)
30 35 40 45 50
0 10 20 30 40 50
0 10 20 30 40 50
0 10 20 30 40 50
-20 -10 0
30
20
10
-30 -20 -10 0
30 1
0.8
0.6
0.4
0.2
0
1
0.8
0.6
0.4
0.2
0 1
0.8
0.6
0.4
0.2
0
20
10
-30 -20 -10 0 30
20
10
[image:5.595.48.543.66.464.2]-30 -20 -10 0
Figure 6 The calculation result of tricolor separation in a color waveguide matrix, with the initial field distribution described by a Gaussian function with an FWHM of
28mm, the Gaussian beam maximum is located atx50. Here, the red, green and blue represent the light wave at 611, 544 and 434 nm respectively. The propagation of
[image:5.595.42.552.669.736.2]guide array to implement the approach and demonstrate effective color routing, both theoretically and experimentally. The strong required dispersion is introduced by selective absorption, while oper-ating away from the absorption peak. The higher efficiency is achieved by coupling the optical power from nearby waveguides into the wave-length-specific target waveguide, so the effective cross-section of each waveguide is increased for its specific target wavelength range. Therefore, the waveguides act as an effective color filter array effi-ciently separating the different wavelength signals. The theoretical efficiency of the color separation is typically above 50%, which is considerably higher than that of a conventional color absorptive filter array. We have also illustrated this effect experimentally by showing a dual-color separation in lithographically fabricated waveguide array with an efficiency of higher than 70%, using RhB as the dopant in alternating waveguides. We believe that multicolor separation can be achieved when suitable absorbing materials are doped into the same organic matrix. We also note that the idea of KK based wavelength separation is similar to that recently demonstrated with plasmonic nanoparticles,17and that our waveguide array achieves more distinct color separation due to its longer propagation length as well as better efficiency.
ACKNOWLEDGMENTS
The author thanks Professor JC She for the useful discussions. This work is supported by The National Key Basic Research Special Foundation (G2010CB923204), Chinese Nation Natural Science Foundation (10934011, 11104083) and Research Grants Council of Hong Kong (HKUST2/CRF/11G).
1 Pascale D. A review of RGB color space [PDF on Internet]. Montreal: Canada; 2003. Available from: http://www.babelcolor.com/download/A%20review%20of%20RGB%20color%20spaces.pdf (accessed on 7 July 2011).
2 Yeh P, Gu C. Optics of Liquid Crystal Display. New York: Wiley Interscience Publication; 1999.
3 Sabnis RW. Color filter technology for liquid crystal display.Display1999;20: 119– 129.
4 Ledebuhr AG. Full color projector system with a tricolor-separating prism. US patent no. 4,687,301, 1987
5 Ernstoff MN. Liquid crystal dot color display. US patent no. 4,006,968, 1977 6 Bron M, Wolf E. Principles of Optics: Electromagnetic Theory of Propagation, Interference
and Diffraction of Light. 7th ed. London: Cambridge University Press; 1999. 7 McNab S, Moll JN, Vlasov YA. Ultra-low loss photonic integrated circuit with
membrane-type photonic crystal waveguide.Opt Express2003;11: 2927–2939. 8 Shani Y, Henry CH, Kistler RC, Orlowsky KJ, Ackerman DA. Efficient coupling of a
semiconductor laser to an optical fiber by means of a tapered waveguide on silicon. Appl Phys Lett1989;55: 2389–2391.
9 Kozhekin AE, Kurizki G, Malomed BA. Standing and moving gap solitons in resonantly absorbing gratings.Phys Rev Lett1998;81: 3647–3650.
10 Xiao WN, Zhou JY, Prineas JP. Storage of ultrashort optical pulses in a resonantly absorbing Bragg reflector.Opt Express2003;11: 3277–3283.
11 Prineas JP, Zhou JY, Kuhl J, Gibbs HM, Khitrova Get al. Ultrafast ac Stark effect switching of the active photonic band gap from Bragg-periodic semiconductor quantum wells.Appl Phys Lett2002;81: 2002–4332.
12 Li JT, Liang B, Liu YK, Zhang PQ, Zhou JYet al. Photonic crystal formed by the imaginary part of the refractive index.Adv Mater2010;22: 2676–2679. 13 Feng MN, Liu YK, Li YY, Xie XS, Zhou JY. Light propagation in a resonantly absorption
waveguide array.Opt Express2010;19: 7222–7229.
14 Kirkpatrick S, Gelatt CD, Vecchi MP. Optimization by simulated annealing.Science 1983;220: 671–680.
15 Agrawal GP. Nonlinear fiber optics. 3rd ed. Singapore: Elsevier Pte Ltd; 2004. 16 Available from: http://img.product.pchome.net/market/photo/2011/04/25/551725.jpg
(accessed on 25 June 2012).
17 Shigai T, Vladimir SC, Miljkovic´ D, Zengin G, Johansson Pet al. A bimetallic nanoantenna for directional color routing.Nat Commun2011;2: 481.
This work is licensed under a Creative Commons Attribution-NonCommercial-NoDerivative Works 3.0 Unported License. To view a copy of this license, visit http:// creativecommons.org/licenses/by-nc-nd/3.0
a b
Z (µm) Z (µm)
1.4
1.2
1.0
0.8
0.6
0.4
1.4
1.2
1.0
0.8
0.6
0.4 5
Intensity (a.u.) Intensity (a.u.)
10 15 20 30
633 nm
532 nm
633 nm
532 nm
[image:6.595.55.291.67.219.2]25 5 10 15 20 25 30
Figure 8 The two-color signals are routed in the waveguide doped with RhB (a) and without RhB (b) with increased efficiency as the propagation distance increases.
The result shows a clear separation of green and red light and the transmission is higher than 70% for green.
0.6 564 nm
0.02
0.01
Refractive index change
0.00
-0.01 0.5
0.4
Absorption coef
ficient (
µ
m
-1)
0.3
0.2
0.1
0.0
450 500 550
λ (nm)
600 650
Figure 7 Experimental result of the absorption coefficient (solid line) and the
[image:6.595.75.528.533.705.2]