Borland
"
User's Guide
Borland
Borland may have patents andbr pending patent applications covering subject matter in this document. The furnishing of this document does not give you any license to these patents.
COPYRIGHT © 1988, 1993 by Borland International. All rights reserved. All Borland products are trademarks or registered trademarks of Borland International, Inc. Other brand and product names are trademarks or registered trademarks of 'their respective holders.
Borland International, Inc.
100 Borland Way, P.O. BOX 660001, Scotts Valley, CA95067-0001
PRINTED IN THE UNITED STATES OF AMERICA
Contents
Introduction 1 Setting command-line options with Turbo
New features and changes for version 4.0 .- ... 2 Debugger's icon properties ... 19
Hardware requirements ... 2 Setting command-line options from Terminology in this manual ... 2 Borland's C++ integrated environment .... 20
Typographic and icon conventions ... 3 Running Turbo Debugger ... 20
Using this manual ... 4 Loading your program into the debugger ... 21
Where to now? ... ' ... 5 Searching for source code ... 23
First-time Turbo Debugger users ... 5 Specifying program arguments ... 23
Experienced Turbo Oebugger users ... 5 Restarting a debugging session ... 23
Contacting Borland ... 6 Controlling program execution ... 24
Chapter 1 Installing and configuring Turbo The Run menu ... 25 Run ... 25
Debugger 7 Go to Cursor ... 25
Installing Turbo Debugger ... 7 Trace Into ... 25
Configuring Turbo Debugger ... 7
Turbo Debugger's configuration files ... 8 Step Over ... 26 Execute To ... 26
Searching for configuration files ... 8 Until Return ... 26
Setting up the video drivers ... 8 Animate ... 27
Dual-monitor debugging ... 9 Back Trace ... 27
The Options menu ... 9 Instruction Trace ... 27
The Language command ... 9
Display Options command ... 10
Path for Source command ... 11
Save Options command ... 12
Arguments ... 27
Program Reset ... 27
Next Pending Status ... 28
Wait for Child ... 28
Restore Options command ... 12
Debugging ObjectWindows 1.0 programs ... 12
Files installed with Turbo Debugger ... 13
Interrupting program execution ... 29
Stopping in Windows code ... 29
Reverse execution ... 30
Turbo Debugger's executable and support files ... 13
Turbo Debugger's utilities ... 14
Specifying utility command-line options ... 14
Turbo Debugger's online text files ... 15
Turbo Debugger's example program ... 15
The Execution History window's SpeedMenu ... 30
The Keystroke Recording pane ... 31
The Keystroke Recording pane's SpeedMenu .' ... 32
Program termination .' ... 32
Chapter 2 Starting Turbo Debugger and running your program 17 Resetting your program ... 32
Exiting Turbo Debugger: ... 33
Preparing programs for debugging ... 17 Chapter 3 Debugging with Turbo Debugger 35 Compiling from the integrated Debugging basics ... 35
environment ... 18
Compiling from the command line ... 18
Starting Turbo Debugger ... 18
Specifying Turbo Debugger's command-line Discovering a bug ... 35
Isolating the bug ... 36
Finding the bug ... 36
Fixing the bug ... 37
options ... 19 What Turbo Debugger can do for you ... 37
Working with menus ... , . 38 Running Simple Paint ... 56
Working with windows ... ,38 Compiling TDWDEMO ... 56
Selecting a window ... '. . . . .. 38 Compiling TDWDEMO using DOS Using window panes ... , 38 commands ... 57
Moving and resizing windows ... 39 Compiling TDWDEMO using the IDE ... 57
Closing and recovering windows ... 39 Debugging TDWDEMO ... 57
SpeedMenus ... 39 Running the buggy program ... 58
Turbo Debugger's windows ... 40 Stepping through program code ... 60
The View menu's windows ... 40 Fixing a bug ... 61
Breakpoints window ... : ... 40 Fixing warnings ... 61
Stack window ... 40 Stepping into the message loop ... 62
Log window ... 40 Setting breakpoints ... 63
Watches window ... 41 Creating a conditional breakpoint ... 64
Variables window ... 41 Setting watches and inspecting data Module window ... 41 structures ... 66
File window ... 41 Setting watches ... 67
CPU window ... 41 Running to the cursor location ... 67
Dump window ... 41 Inspecting compound data structures ... 68
Registers window ... ' ... 42 Producing the bug in Turbo Debugger ... 69
Numeric Processor window ... 42 Resetting the program ... 70
Execution History window ... 42 Changing the values of variables ... 70
Hierarchy window ... 42
Windows Messages window ... 42
Clipboard window ... 43
Duplicating windows ... 43
Other windows ... 43
Inspector windows ... 43
User screen ... 44
Turbo Debugger's special features ... 44
Automatic name completion ... 44
Select by typing ... 45
Incremental matching ... 45
Keyboard macros ... 45
The Macros menu ... 45
The Clipboard ... 46
The Pick dialog box ... 46
The Clipboard window ... 47
The Clipboard window's SpeedMenu ... 48
Dynamic updating ... 48
The Get Info text box ... 49
The Attach command ... 50
The OS Shell command ... 52
Getting help ... 52
Online help ... 52
The status line ... ; ... 53
TD32's menu tree ... 54
Chapter 5 Setting and using breakpoints 73 Breakpoints defined ... 73
Breakpoint locations ... 73
Breakpoint conditions ... 74
Breakpoint actions ... 74
The Breakpoints window ... 74
The Breakpoints window's SpeedMenu ... 75
Breakpoint types ... 75
Setting simple breakpoints ... 75
Setting expression-true breakpoints ... 77
Setting changed-memory breakpoints ... 78
Setting global breakpoints ... 79
Global breakpoint shortcuts ... 80
Setting hardware breakpoints ... 80
Breakpoint actions ... 81
Break ... 81
Execute ... 81
Log ... 82
Enable group ... 82
Disable group ... 82
Setting breakpoint conditions and actions ... 82
Creating breakpoint condition sets ... 83
Creating breakpoint action sets ... 83
Multiple condition and action sets ... 84
Deleting breakpoint groups ... 85
E~abling and di~abling breakpoint groups ... 86
NavIgating to a breakpoint location ... 86
Enabling and disabling breakpoints ... 86
Removing breakpoints ... ~ ... 87
Setting breakpoints on C++ templates ... 87
Setting breakpoints on threads ... 88
. The Log window ... 88
The Log window's SpeedMenu ... 89
Chapter 6 Examining and modifying data 91 The Watches window ... 91
Creating watches ... 92
The Watches window's SpeedMenu ... 93
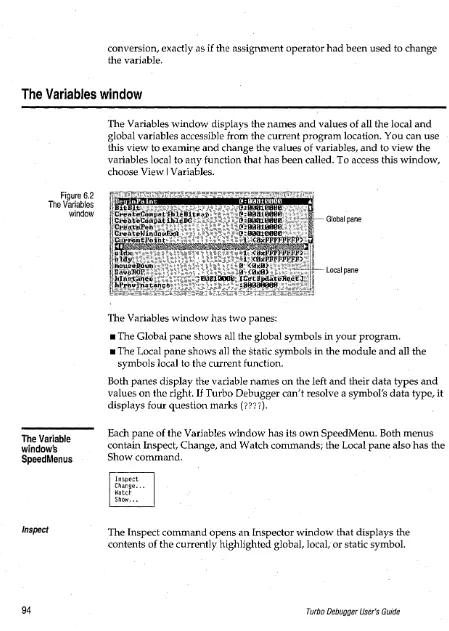
The Variables window ... 94
The Variable window's SpeedMenus ... 94
Viewing variables from the Stack window .,. 96 Inspector windows ... 96
Opening Inspector windows ... 96
Scalar Inspector windows ... 97
Pointer Inspector windows ... 97
Structure and Union Inspector windows ... 98
Array Inspector windows ... 99
Function Inspector windows ... 100
The Inspector window's SpeedMenu ... 100
The Stack window ... 101
The Stack window's SpeedMenu ... 102
The Evaluate/Modify command ... 102
Function Return command ... 104
Chapter 7 Evaluating expressions 105 Turbo Debugger's expression evaluator ... 105
Selecting an evaluator ... 105
Expression limitations ... 106
Types of expressions ... 106
Specifying hexadecimal values ... 106
Specifying memory addresses ... 107
Entering line numbers ... 107
Entering byte lists ... 107
Calling functions ... 108
Expressions with side effects ... 108
Format specifiers ... 108
Accessing symbols outside the current scope .. 109
How Turbo Debugger searches for symbols . 110 Implied scope for expression evaluation .... 110
Scope override syntax ... 110
Overriding scope in C, C++, and assembler programs ... 111
Overriding scope in Pascal programs .... 112
iii Scope and DLLs ... 113
Chapter 8 Examining disk files 115 Examining program source files . . . 115
Loading source files ... 116
The Module window's SpeedMenu ... 116
Examining other disk files ... 119
The File window's SpeedMenu . . . 120
Chapter 9 Assembly-level debugging 123 The CPU window ... 123
Opening the CPU window ... 125
The Code pane ... 125
Displaying source code ... 125
Setting breakpoints ... 126
The Code pane's SpeedMenu ... 126
The Registers pane ... 129
The Registers pane's SpeedMenu ... 129
The Flags pane ... 130
The Flags pane's SpeedMenu ... 130
The Dump pane ... 130
The Dump pane's SpeedMenu ... 131
The Stack pane ... 133
The Stack pane's SpeedMenu ... 133
The Selector pane ... 134
The Selector pane's SpeedMenu ... 135
The Dump window ... 135
The Registers window ... 136
Chapter 10 Windows debugging features 137 Monitoring window messages ... 137
Specifying a window to monitor ... 138
Deleting window selections. . . 139
Specifying the messages to track ... 140
SpeCifying a message class to track ... 140
Specifying the message action . . . 142
Breaking on messages ... 142
L oggmg messages ... 142 .
Deleting message class and action settings ... 143
Message tracking tips ... 143
Debugging dynamic-link libraries ... 143
Stepping into DLL code ... 144
Returning from a DLL ... 144
Accessing DLLs and source-code·modules .. 144
Changing source modules ... 145
Changing executable files ... 145
Adding DLLs to the DLLs & Programs list ... ·146
Debugging DLL startup code ... 146 Getting help (-h and -? options) ... 172
Debugging multithreaded programs ... 148 Session restart modes (-j options) ... 172
The Threads Information pane ... 148 Keystroke recording (-k) ... 173
The Threads List pane ... 149 Assembler-mode startup (-1) ... 173
Threads List pane's SpeedMenu ... 149 Mouse support (-p) ... 173
The Threads Detail pane ... 151 Remote debugging (-r options) ... 173
. Tracking operating-system exceptions ... 151 Source code handling (-s options) ... 173
Specifying user-defined exceptions ... , .... 152 Starting directory (-t) ... 174
Obtaining memory and module lists ... 153 Video hardware handling (-v options) ... 174
Listing the contents of the global heap ... 153 Windows crash message checJdng (-wc) .... 174
Listing the contents of the local heap ... 155 Windows DLL checking (-wd) ... 174
Listing the Windows modules ... 155 Command-line option summary ... 175
Converting memory handles to addresses .... 156
Appendix B Remote debugging 177 Chapter 11 Debugging object-oriented Hardware and software requirements ... 177
programs 157 Starting the remote debugging session ... 178
The Hierarchy window ... 157 Setting up the remote system ... 178
The Classes pane ... 158 Configuring and starting WREMOTE ... 178
The Classes pane's SpeedMenu .. ; ... 158 Serial configuration ... 179
The Hierarchy pane ... 158 LAN configuration ... 179
The Hierarchy pane's SpeedMenu ... 158 Saving the communication settings ... 180
The Parents pane ... 159 Starting WREMOTE ... 180
The Parent pane's SpeedMenu ... 159 WREMQTE command-line options ... 180
Class Inspector windows ... 159 Starting and configuring TDW ... 181
The Class Inspector window's SpeedMenus . 160 Serial configuration ... 181
Object Inspector windows ... 161 LAN configuration ... 182
The Object Inspector window's Initiating the remote link ... 182
SpeedMenus ... 161 AutOmatic file transfer ... 183
Exceptions ... 163 TDW's remote debugging command-line C++ exception handling ... 163 options ... 183
C exception handling ... 164 Remote DOS debugging ... 185
Chapter 12 Debugging TSRs and device drivers 165 What's a TSR? ... .- ... 165
Debugging a TSR ... 166
What's a device driver? ... 168
Differences between TDREMOTE and WREMOTE ... 185
Transferring files to the remote system ... . . 186
Troubleshooting ... 186
Debugging a device driver ... : 169
Appendix A Command-line options 171 Command -line option details ... 171
.Attaching to a running process ... 171
Loading a specific configuration file (-c) .... 172
Appendix C Turbo Debugger error messages 187 TD, TDWi and TD32 messages ... 187
Status messages ... 198
TDREMOTE messages ... 199
WREMOTE messages ... 200
Tables
1.1 Turbo Debugger's executable and support 9.1 CPU window panes ... 124
files ... 13 9.2 CPU window positioning ... 125
1.2 Turbo Debugger's utilities ... 14 9.3 Mixed command options ... 128
1.3 Turbo Debugger's online files ... 15 9.4 1/
a
commands ... 1291.4 Turbo Debugger's example program files ... 16 9.5 The CPU Flags ... 130
2.1 Turbo Debugger programs ... 19 9.6 Follow command options . . . 132
2.2 Starting Turbo Debugger ... 19 9.7 Display As command options ... 133
3.1 Turbo Debugger's debugging functions .... 37 9.8 Block command options ... 133
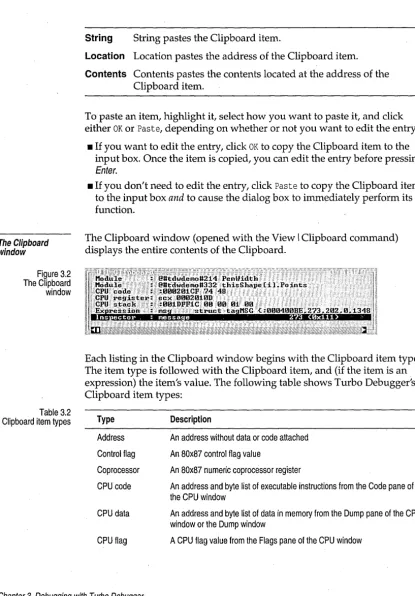
3.2 Clipboard item types ... 47 10.1 Windows Messages window panes ... 138
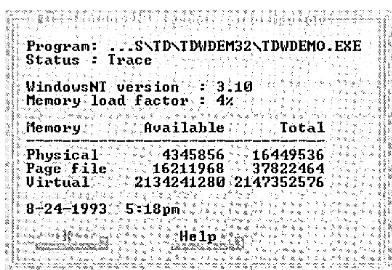
3.3 TDW's System Information ... 49 10.2 Format of a global heap list ... 154
3.4 Windows NT System Information ... 50 10.3 Format of a local heap list ... 155
5.1 Breakpoint types ... 75 10.4 Format of a Windows module list ... 156
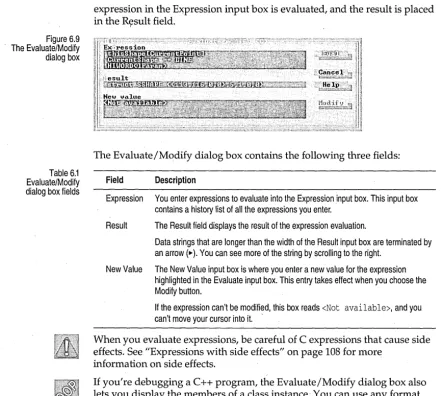
6.1 Evaluate/Modify dialog box fields ... 103 A.1 Turbo Debugger's command-line options. 175 7.1 Hexadecimal notation ... 107 B.1 WREMOTE command-line options ... 180
7.2 Segment:Offset address notation ... 107 B.2 TDW's remote debugging command-line 7.3 Byte lists ... 108 options ... 183
7.4 Expression format specifiers ... 109 B.3 TDREMOTE command-line options ... 185
Figures
1.1 The Display Options dialog box ... 10
2.1 The Load a New Program to Debug dialog box ... 21
2.2 The Enter Program Name to Load dialog box ... · ... 22
2.3 The Set Restart Options dialog box ... 24
2.4 The Execution History window ... 30
3.1 The Pick dialog box ... 46
3.2 The Clipboard window ... 47
3.3 The Get Info text box ... 49
3.4 The Attach to and Debug a Running Process dialog box ... 51
3.5 The normal status line ... 53
3.6 The status line with Alt pressed ... 53
3.7 The status line with Ctrl pressed ... 53
. 3.8 The complete TD32.EXE menu tree ... 54
4.1 TDWDEMO loaded into Turbo Debugger .. 60
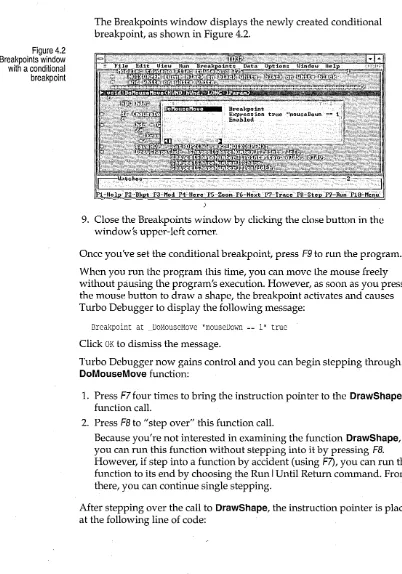
4.2 Breakpoints window with a conditional breakpoint ... 65
4.3 Inspector and Watches windows ... 68
5.1 The Breakpoints window ... 74
5.2 The Breakpoint Options dialog box ... 77
5.3 The Conditions and Actions dialog box .... 78
5.4 The Edit Breakpoint Groups dialog box .... 85
5.5 The Log window ... 88
6.1 The Watches window ... '" ... 92
6.2 The Variables window ... 94
6.3 A C scalar Inspector window ... 97
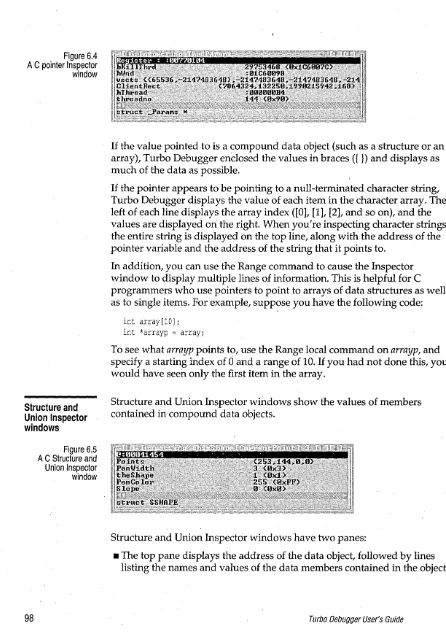
6.4 A C pointer Inspector window ... 98
6.5 A C Structure and Union Inspector window .98 6.6 A C array Inspector window ... 99
6.7 A C function Inspector window ... 100
6.8 The Stack window ... 102
6.9 The Evaluate/Modify dialog box ... 103
8.1 The Module window ... 115
8.2 The File window ... 120
8.3 The File window showing hex data ... 120
9.1 The CPU window ... 124
9.2 The Dump window ... 136
9.3 The Registers window ... 136
10.1 The Windows Messages window ... 138
10.2 The Set Message Filter dialog box ... 140
10.3 The Load Module Source or DLL Symbols dialog box ... 145
10.4 The Threads window ... 148
10.5 The Thread Options dialog box ... 149
10.6 The Specify Exception Handling dialog box ... 152
10.7 TDW's Windows Information dialog box. 153 11.1 The Hierarchy window ... 157
11.2 A Class Inspector window ... 159
11.3 An ObjectInspector window ... 161
11.4 The Specify C and C++ Exception Handling dialog box ... 163
Introduction
Introduction
Turbo Debugger is a set of tools designed to help you debug the programs you write with Borland's line of compilers. The Turbo Debugger package consists of a set of executable files, utilities, online text files, example programs, and this manual.
Turbo Debugger lets you debug the programs you're writing for Microsoft Windows, Windows 32s, Windows NT, and DOS. When you load your program into Turbo Debugger, you can use the debugger to control your program's execution and to view the different aspects of your program (including your program's output, source code, data structures, and
program values) as it runs. .
Turbo Debugger uses menus, multiple windows, dialog boxes, and online context-sensitive help system to provide you with an easy-to-use,
interactive debugging environment. In addition, Turbo Debugger provides a comprehensive set of debugging features:
• Full C, C++, Pascal, and assembler expression evaluation. • Full program execution control, including program animation. • Low-level access to the CPU registers and system memory. • Complete data inspection capabilities.
• Powerful breakpoint and logging facilities.
• Windows message tracking, including breakpoints on window messages. • Full object-oriented programming support, including class browsing and
object inspecting. • Reverse execution.
• Remote debugging support.
• Macro recording of keystrokes to speed up repeated series of commands. • Copying and pasting between windows and dialog boxes.
• Incremental matching, automatic name completion, and select-by-typing (to minimize keyboard entries).
New features and changes for version 4.0
Turbo Debugger 4.0 provides the following enhancements over version 3.x:
• Ability to debug both 16- and 32-bit Windows programs (provided with the addition of TD32, the 32-bit debugger).
• Ability to debug larger programs.
• Support for remote debugging on Windows systems (described in Appendix B).
• Operating-system exception handling (described in section "Tracking operating-system exceptions" on page 151).
• C++ and C exception handling (described in section "Exceptions" on page 163).
• Session-state saving (described in section "Restarting a debugging session" on page 23).
• Thread support for multithreaded Windows NT programs (described in section "Debugging multithreaded programs" on page 148).
• Ability to attach to processes that are already running in Windows NT (described in section "The Attach command" on page 50).
• Ability to shell out to a selected editor while running Windows NT (described in section 'IEdit" on page 119).
• Ability to choose a Windows international sort order for items displayed in Turbo Debugger (use Turbo Debugger's configuration programs to access this feature).
Hardware requirements
Turbo Debugger's hardware requirements are the same as those of your Borland language compiler.
In addition, Turbo Debugger supports the following graphics modes and adapters: CGA, EGA, VGA, Hercules monochrome-graphics, Super VGA (SVGA), TIGA, and 8514. You can use standard drivers with everything except SVGA, TIGA, and 8514.
Terminology in this manual
argument The term argument is used interchangeably with parameter in this manual and applies both to command-line arguments used to invoke a program to , be debugged and to arguments passed to routines, functions, and
procedures.
module This term refers to what is usually called a module in C++ and assembler, and also to what is called a unit in Pascal. Modules are executable files such as .EXE files and .DLLs.
routine A routine, as used in this manual, refers to assembler and C++ functions, and to Pascal functions, procedures, and object methods.
In this manual, the term "Turbo Debugger" r:efers to the two Turbo Debugger programs: TDW.EXE and TD32.EXE. However, there are times when the text refers to a specific Turbo Debugger program. In these cases, the term "TDW" refers to TDW.EXE and the term "TD32" refers to TD32.EXE.
Typographic and icon conventions
Boldface Boldface type indicates language keywords (such as char, switch/and begin) and command-line options (such as -rn).
Italics Italic type indicates program variables and constants that appear in text.
This typeface is also used to emphasize certain words, such as new terms.
Monospace Monospace type represents text as it appears onscreen or in a program. It is also used for anything you must type literally (such as TD32 to start up the 32-bit Turbo Debugger).
Key 1 This typeface indicates a key on your keyboard. For example, "Press Esc to exit a menu."
Key1+Key2 Key combinations produced by holding down one or more keys
simultaneously are represented as Key1+Key2. For example, you can execute the Program Reset command by holding down the Gtrl key and pressing F2
(which is represented as Gtrl+F2).
MenulCommand This command sequence represents a choice from the menu bar followed by a menu choice. For example, the command "File I Open" represents the Open command on the File menu.
. . This arrow icon indicates material you should take special notice of.
Screen shots Unless otherwise noted, all screen shots in this manual depict TD32 while running under Windows NT.
This manual also uses the following icons to indicate sections that pertain to specific Window,s operating environments:
Windows3.x Windows 32s and NT
Windows 32s Windows NT
Using this manual
Here is a brief description of the chapters and appendixes in this manual:
Chapter 1: Installing and configuring Turbo Debugger describes the files that are installed with the Turbo Debugger package and how to customize Turbo Debugger once it is installed. ,/
Chapter 2: Starting Turbo Debugger and running your program describes how to prepare your program for debugging, and how to run Turbo Debugger and load your program. This chapter also discusses the different ways to control your program's execution while you are running it in Turbo Debugger.
Chapter
3:
Debugging with Turbo Debugger introduces you to Turbo Debugger's environment-its global and SpeedMenu system, dialog boxes, and debugging windows. This chapter also discusses the basics ofdebugging, and the special features that Turbo Debugger provides to make your debugging session run smoothly.
Chapter 4: Debugging a simple example leads you through a sample debugging session that demonstrates the capabilities of Turbo Debugger.
Chapter 5: Setting and using breakpoints describes Turbo Debugger's breakpoint capability.
Chapter 7: Evaluating expressions describes the types of expressions that Turbo Debugger accepts, how to specify a display format of the expression results, and how to override the scope in expressions.
Chapter 6: Examining and modifying data explains the various ways you can examine and modify the data used by your program.
Where to now?
First-time Turbo Debugger users
Experienced Turbo Debugger users
Introduction
Chapter 9: Assembly-level debugging describes Turbo Debugger's CPU window. Additional information about this window and about assembler-level debugging is in the file TD_ASM.TXT.
Chapter 10: Windows debugging features describes the Turbo Debugger features you can use to debug Windows programs.
Chapter 11: Debugging C++ programs explains Turbo Debugger's special features that let you examine C++ classes and objects.
Chapter 12: Debugging TSRs and device drivers describes how to use TD.EXE to debug terminate and stay resident (TSR) programs and DOS device drivers.
Appendix A: Command-line options describes all the command-line options that are available with TDW and TD32.
Appendix B: Remote debugging describes the remote debugging capabilities of Turbo Debugger.
Appendix C: Turbo Debuggers error messages lists all the error messages and prompts generated by TDW and TD32. The list also gives suggestions on how to respond to the prompts and error messages.
The following reading guidelines are proposed to help first-time and experienced Turbo Debugger users:
New Turbo Debugger users should read the first four chapters of this manual to get a basic understanding of how the debugger works. Once you become familiar with the basics of Turbo Debugger, read Chapters 5,6, and 7 to become proficient with the debugger's most-often used features: breakpoints, data inspection, and expression evaluation ..
The remaining chapters in the book provide information about specific debugger features (such as the CPU window), and provide help when you encounter problems debugging a specific area of your program (such a C++ class or a Windows DLL). Browse through these chapters to get an
overview of the more advanced debugger features.
If, while using Turbo Debugger, you have questions about a certain feature or menu command, press F1 to access the debugger's context-sensitive help system.
Users familiar with Turbo Debugger should read the "New features and changes for version 4.0" section on page 2 to get an overview of items new to this release. Experienced users should also read Chapter 2, "Installing and configuring Turbo Debugger," which lists the files installed with Turbo
Debugger. Experienced users should also read "Turbo Debugger's special features" on page 44, which describes the features that make Turbo Debugger especially easy to use. Even experienced Turbo Debugger users might be surprised at some of the features they've previously overlooked.
Contacting Borland
Borland offers a variety of services to help you with your questions. Be sure to send in the registration card: registered owners are entitled to receive technical support and information on upgrades and supplementary products. North American customers can register by phone 24 hours a day by calling 1-800-845-0147. Borland provides the following convenient sources of technical information.
Service How to contact Available Cost Description
TechFax 1-800-822-4269 24 hours daily Free Sends technical information to your fax
(voice) machine. You can request up to 3
documents per call. Requires a Touch-Tone phone.
Automated Support 1-800-524-8420 24 hours daily Free Provides answers to most common
(voice) or questions about Quattro Pro, dBASE V,
408-431-5250 The cost of and Paradox. Requires a Touch-Tone
(modem) the phone call phone or modem.
Online Services
Borland Download 408-439-9096 24 hours daily The cost of Sends sample files, applications, and
BBS the phone call technical information via your modem.
Requires a modem (up to 9600 baud); no special setup required.
CompuServe online Type GO BORLAND. 24 hours daily; Your online Sends answers to technical questions service Address messages to 1-working-day charges via your modem. Messages are public Sysop or All. response time. unless sent by CompuServe's private
mail system.
BIX online Type JOIN BORLAND. 24 hours daily; Your online Sends answers to technical questions service Address messages to 1-working-day charges via your modem. Messages are public
Sysop or All. response time. unless sent by BIXs private mail system.
GEnie online Type BORLAND. 24 hours daily; Your online Sends answers to technical questions service Address messages to 1-working-day charges via your modem. Messages are public
c
H A p T E RInstalling and configuring Turbo
Debugger
This chapter describes how to install Turbo Debugger and how to customize its default options and display settings. Also described in this chapter are the many files that are installed with the debugger.
Installing Turbo Debugger
1
The INST ALL.EXE program supplied with your Borland compiler installs the entire Turbo Debugger package, which includes executable files, configuration files, utilities, online text files, and example programs. A detailed listing of all files included with Turbo Debugger starts on page 13.
The install program creates icons for your Borland compiler and language tools, and places them inside a new Windows program group. Directions for using INST ALL.EXE can be found in the User's Guide of your Borland language product.
For general installation information, refer to the README file on your compiler's Installation disk. F9r a complete listing of the files installed by INSTALL.EXE, refer to the FILELIST.DOC text file (this file is copied by the installation program to your main language directory).
Configuring Turbo Debugger
You can configure Turbo Debugger's display options and program settings with customized configuration files and with the debugger's Options menu. Settings in the configuration files become effective when you load Turbo Debugger. To change the debugger's settings after you've loaded it, use the commands on the Options menu.
Turbo Oebuggers configuration files
Searching for configuration files
Turbo Debugger uses the following configuration, initialization, and session-state files when it starts:
• TDCONFIG.TD • TDCONFIG.TDW • TDCONFIG.TD2 .TDW.lNI
.XXXX.TR .XXXX.TRW .XXXX.TR2
The configuration files TDCONFIG.TD, TDCONFIG.TDW, and TDCONFIG.TQ2 are created and used by TD, TDW, and TD32,
respectively. ~e settings in these files override the default configuration settings of the debuggers. You can modify the configuration files using the installation programs TDINST.EXE, TDWINST.EXE, and TD32INST.
TDW.lNI is the initialization 'file used by TDW.EXE and TD32.EXE. It
contains settings for the video driver used with Turbo Debugger, the location of TDWINTH.DLL (the Windows-debugging DLL), and the remote debugging settings you specify using WRSETUP .EXE.
The installationi program places a copy of TDW.lNI in the main Windows
directory. In this copy of TDW.lNI, the video. driver setting ([VideoDLL]) is set to SVGA.DLL, and the DebuggerDLL setting indicates the path to TDWINTH.DLL. Refer to the online file TD_HELP!.TXT for a complete description of TDW.lNI.
Files ending with .TR, .TRW, and .TR2 extensions contain the session-state settings for the debuggers. For information on session-state saving, refer to "Restarting a debugging session" on page 23.
When you start Turbo Debugger, it looks for its configuration files in the following order:
1. In the current directory.
2. In the directory specified in the Turbo Directory setting of Turbo Debugger's installation program.
3. In the directory that contains the debugger's executable file.
Setting up the video drivers
Dual-monitor debugging
The Options menu
TDW and TD32 use different video DLLs to support the available types of video adapters and monitors. After you've installed Turbo Debugger, run the utility program TDWINLEXE to help you select or modify the video DLL that's used with the debuggers.
By default, TDW and TD32 use the SVGA.DLL video driver, which supports most video adapters and monitors. For more information on the available video DLLs, refer to the entries for DUAL8S14.DLL, STB.DLL, SVGA,DLL, and TDWGULDLL in Table 1.1 (which appears later in this chapter), and the online Help system provided with TDWINLEXE.
Turbo Debugger supports dual-monitor debugging with TD and TDW, and with TD32 running on Windows 32s. To create a dual-monitor system, you need a color monitor and video adapter, and a monochrome monitor and video adapter. When you debug with two monitors, Turbo Debugger appears on the monochrome monitor, and Windows and the program you're debugging appears on the color monitor. The advantage of this system setup is that you can see your program's output while you're debugging it with Turbo Debugger.
Once your hardware setup is complete, use the -do ~ommand-line option to load TD or TDW in dual-monitor mode. For more information on command-line options, see Appendix A.
If you're running TD32 on Windows 32s, you must use Turbo Debugger's SVGA.DLL video DLL to have access to dual-monitor debugging. On this system, dual-monitor debugging is enabled when the following line is inserted in the TDW.INI file, under the heading [VideoOptions 1 :
mono::yes
To properly setup your video driver, use the TDWINI.EXE utility.
The Options menu contains commands that let you set and adjust the parameters that control the overall appearance of Turbo Debugger.
Language. • . Source Macros ~
Display options •.• Path for source ... Save options •.. Restore options •••
The Language command
Display Options command
Figure 1.1 The Display Options dialog box
Display Swapping
Use the Options I Language command to select the programming language evaluator that 'the debugger uses. Chapter 7 describes how to set the expression evaluator and how it affects the way Turbo Debugger evaluates expressions.
The Option I Display Options command opens the Display Options dialog box. You use the settings in this dialog box to control the appearance of Turbo Debugger's display. While TD, TDW, and TD32 share most display options, TD32 has several additional options to provide support for the Windows NT multitasking operating system.
, You can use the Display Swapping radio buttons to control the way Turbo Debugger swaps your applications' screens with the debugger's windows.
None Found in TD32 only, this option specifies that no screen-swapping is to take place. This option provides the fastest and smoothest screen updating when you're single stepping through a program. However, this option can cause your display to become corrupted. If this happens, use the Repaint Desktop on the System menu to repaint the screen.
Smart Turbo Debugger activates the user screen when it detects that your program is going to display output and when you step over routines.
Integer Format
Screen Lines
Tab Size
Background Delay
User Screen Delay
Path for Source command
The Integer Format radio buttons let you choose the way integers are displayed in Turbo Debugger.
Hex Shows integers as hexadecimal numbers, displayed in a format appropriate to the current language evaluator.
Decimal Displays integers in decimal notation.
Both Displays integers in both decimal and hexadecimal notation (the hexadecimal numbers are placed in parentheses after the decimal value).
Use the Screen Lines radio buttons to select either a 25-line display or a 43-or 50-line display available with EGA and VGA display adapters.
The Tab Size input box lets you set the number of columns each tab stop occupies. To see more text in source files that use tab indents, reduce the tab column width. You can set the tab column width from 1 to 32.
Found only in TD32.EXE, the Background Delay input box lets you specify how often Turbo Debugger's screens getupdated. When you use this setting in conjunction with the Run I Wait for Child command, you can watch the effects of your program through Turbo Debugger's windows, while your program is running.
Found only in TD32, User Screen Delay lets you specify how long your program's screen is displayed when you press Alt+FS (the Window I User Screen command). This command is useful when you're using TD32 in full-screen mode, and you need to see your application's windows. By setting the delay, you can specify how long your program'~ screens will be displayed before Turbo Debugger regains control.
Use the Path for Source command to specify the directories that Turbo Debugger searches for your program's source files. To enter multiple directories, separate each directory with a semicolon. '
Although the Enter Source Directory Path input box holds a maximum of ' 256 characters, you can use a response file to specify longer search paths. A response file contains a single line that specifies the directories that should be searched for source code. Each directory listed must be separated by a
Save Options command
Restore Options command
Debugging ObjectWindows 1.0 programs
semicolon. For example, a response file could contain the following line to
specify three different search directories: .
c:\my-proj\modl\sourceic:\my-proj\mod2\sourceic:\my-proj\mod3\source
To specify a response file in the Enter Source Directory Path input box, enter an at-character (@) followed by the path and name of the response file. For example, the following entry specifies the SRC_PATH.TXT response file'
@C:\my-proj\src-path.txt
For more information on how Turbo Debugger conducts its search for source code, refer to "Searching for source code" on page 23.
The Save Options command opens a dialog box that lets you save your Option menu settings to a configuration file. You can save any or all of the following options:
Options Saves all settings made in the Options menu.
Layout Saves the current window layout and pane formats.
Macrot; Saves the curreni-ly defined keyboard macros.
You can specify the name of the configuration file by using the Save To input box. By default, TDW.EXE uses the file name TDCONFIG.TDW, and TD32.EXE uses the file name TDCONFIG.TD2.
By creating different names for your configuration files, you can have a different debugger setup for each programming project you're working on. Each setup can specify unique macros, window layouts, source directories, and so on.
The Restore Options command restores a configuration from a disk file. The file loaded must be a configuration file that was created with the Options I Save Options command or with Turbo Debugger's installation program (TDWINST for TDW.EXE and TDINST32 for TD32.EXE).
If you're using TDW to debug a program that uses ObjectWindows 1.0x, you must configure the debugger so that it recognizes the ObjectWindows DDVT message dispatch system. To configure TDW:
2. Choose Options I Source Debugging to access the Source Debugging dialog box.
3. Check the OWL l.OX Window Messages check box. 4. Save the configuration and exit TDWINST.
Files installed with Turbo Debugger
Turbo Debuggers executable and support files
Table 1.1 Turbo Debugger's executable and support files
The following tables list all the files installed with Turbo Debugger, arranged into the following categories:
• Turbo Debugger's executable and support files • Turbo Debugger's utilities
• Turbo Debugger's online text files
• Turbo Debugger's demonstration program
Table 1.1 lists all the executable and support files needed to run TDW and TD32.
File name
DUAL8514.DLL
STB.DLL
SVGA.DLL
TD.EXE.
TDDEBUG.386
TDHELP.TDH
TDKBDW16.DLL
TDKBDW32.DLL
TDREMOTE.EXE
TD32.EXE
TD32.ICO
TD32HELP.TDH
TDVIDW16.DLL
Description
Video DLL that supports dual-monitor debugging with 8514 monitors.
Video DLL that supports video adapters produced by STB.
Video driver that supports most adapters and monitors.
Executable program used to debug DOS applications.
TDW.EXE uses the device driver TDDEBUG.386 to access the special debug registers of 80386 (and higher) processors. See page 80 for .information on hardware debugging.
Help file for TD.EXE.
Support file used with Windows 32s. .
Support file used with Windows 32s.
Driver used on remote system to support DOS remote debugging.
Executable program used to debug 32-bit programs written for Windows NT and Windows 32s.
Icon used with TD32.EXE.
Help file for TD32.EXE.
Support file used with Windows 32s.
Turbo Oebuggers utilities
Table 1.2 Turbo Debugger's utilities
Table 1.1: Turbo Debuggers executable and support files (continued)
TDVIDW32.DLL Support file used with Windows 32s.
TDWEXE TDWINI TDWGUI.DLL TDWHELP.TDH TDWINTH.DLL WREMOTE.EXE
Executable program used to debug 16-bit Windows programs.
Initialization file used by TDWEXE and TD32.EXE. This file is created by the install program and placed in your main Windows directory.
Video DLL that places Turbo Debugger in a window while using TOW under Windows 3.x or while using TD32 under Windows 32s.
Help file for TDWEXE.
Support DLL required by TDWEXE. TDWINI is set up to point to TDWINTH.DLL.
Driver used on remote system to support Windows remote debugging.
The Turbo Debugger package includes utilities to help with the debugging process. Table 1.2 lists all the utilities and gives a general description of each one. For a more detailed description of these utilities, refer to the online text file TD _ UTILS. TXT.
File name TDINST.EXE TDMEM.EXE TDRF.EXE TD32INST.EXE TD32INST.lCO TDSTRIP.EXE TDSTRP32.EXE TDUMP.EXE . TDWINI.EXE TDWINI.HLP TDWINST.EXE WRSETUP.EXE Description
Creates and modifies TDs configuration file, TDCONFIG.TD.
Displays the current availability of your computer's memory, including Expanded and Extended memory. Used for checking the programs and device drivers that are loaded, and the addresses that they're loaded into.
File transfer utility used to transfer files to remote system.
Creates and modifies TD32's configuration file, TDCONFIG.TD2.
Icon used with TD32INST.EXE.
Strips Turbo Debuggers debugging information (the symbol table) from 16-bit .EXEs and .DLLs, without relinking.
Strips Turbo Debuggers debugging information (the symbol table) from 32-bit .EXEs and .DLLs, without relinking.
Displays the file structure of 16-bit and 32-bit .EXE, .DLL, and .OBJ files. Also displays the contents of the symbolic debug information .
Lets you change and customize Turbo Debuggers video driver settings.
Windows help file for TDWINI.EXE.
Creates and modifies TOW's configuration file, TDCONFIG.TDW Configures things like the display options and screen colors of TOW.
Specifying utility command-line options
Turbo Debuggers online text files
Table 1.3 Turbo Debuggers online files
Turbo Debuggers example program
Each Turbo Debugger utility can be started using special command-line options. For a list of the command-line options available for the TDUMP, TDUMP32, and TDSTRIP utility programs, type the program name at the DOS command-line and press Enter. To see the command-line options for TDWINST and TDINST32, type the program name followed by -?, then press Enter. For example,
TDWINST -?
The installation program places several text files in the DOC subdirectory of your main language directory.
Although you might not need to access all online files, it's important for you to look at TD _RDME.TXT, which contains last-minute information not available in the manual.
File name Description
This file contains information about debugging Turbo Assembler programs. You might also find the information in this file helpful for debugging your in line assembler code.
This file also contains information on using Turbo Debugger's Numeric Processor window.
TD_HELP!.TXT Contains answers to commonly encountered problems. Among other things, TD_HELP!.TXT discusses the syntactic and parsing differences between Turbo Debugger and your language compiler, the TDW.INI file, debugging multi-language programs, and common' questions and answers concerning Turbo Debugger.
TD_HDWBP.TXT This file contains information on how to configure Turbo Debugger so that it takes advantage of the hardware debugging registers.
TD_RDME.TXT Contains last-minute information not contained in the manual.
TO_UTI LS.TXT This file describes the command-line utilities included with Turbo Debugger: TDSTRIP, TDUMP, TDWINST, TD32INST, TDSTRP32, TOM EM, TDMAP, and I
TDUMP32.
All of Turbo Debugger's online files are unformatted ASCII files, so you can use your program editor to access them. .
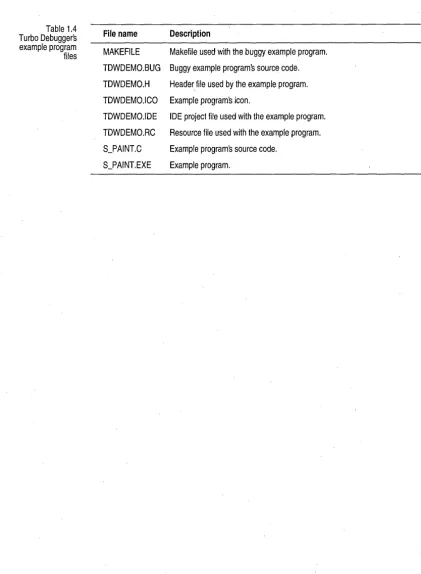
Chapter 4, "Deb~gging a simple example," introduces Turbo Debugger by showing how to debug a simple example program. The following table lists the files used in the example debugging chapter.
Table 1.4
File name Description
Turbo Debuggers example program
MAKEFILE Makefile used with the buggy example program. files
TDWDEMO.BUG Buggy example program's source code.
TDWDEMO.H Header, file used by the example program.
TDWDEMO.ICO Example programs icon.
TDWDEMO.lDE IDE project file used with the example program.
TDWDEMO.RC Resource file used with the example program.
S_PAINT.C Example program's source code.
[image:25.510.39.461.41.616.2]c
H A p T EStarting Turbo Debugger ,and
running your program
R
A debugging session begins when you load your program into Turbo Debugger. After you load your program, you can run it under the debugger's control, pausing its execution at various places to look for where things have gone wrong. Before you can load your program into Turbo Debugger, however, you must prepare it for debugging.
This chapter describes:
• Preparing programs for debugging • Starting Turbo Debugger
• Loading your program into the debugger • Controlling program execution
• Interrupting program execution • Reverse execution
• Program termination • Exiting Turbo Debugger
Preparing programs for debugging
2
When you're developing a program, whether it's written in C, C++, Pascal, or assembler, it's best to compile and link it with debug information.
Although debugging information adds to the size of your executable files, it lets you see your program's source code and use its symbols to reference values while you're in the debugger.
Unless you have a very large project, it's usually best to compile your entire project with debug information turned on. With larger projects, you might want to add debug information only to the modules you intend to load into the debugger.
Compiling from the integrated environment
Compiling from the command line
While you're developing your program, compile your program without compiler optimizations. Even though optimizations create efficient
programs, it can be confusing to debug the sections of code that have been optimized by the compiler; the object code that the compiler produces might not exactly match your program's source code. Because of this, you should compile your program with optimizations turned on only after you've fully debugged your program ..
Once your program is fully debugged and ready for distribution, compile and link your program without debug information to reduce the size of your final program files.
If you're compiling your program from within the Borland C++
environment, you must include symbolic debug information in both your
.OBI files and your final executable files.
To include debug information in your .OBI files:
1. Choose the Options I Project command to bring up the Style Sheet notebook.
2. Choose Compiler I Debugging in the Topics list box to open the Debugging check boxes.
3. Check the Debug Information in OBIs check box.
To include debug information in your final executable files:
1. Choose the Options I Project command to bring up the Style Sheet notebook.
2. Choose Linker I General in the Topics list box to open the General check boxes.
3. Check the Include Debug Information check box.
If you compile your programs with Borland's command-line compiler, use the -v compiler directive to add debug information to each of your modules. Be sure to use the -v linker switch to include the debug information in your final executable files.
Starting Turbo Debugger
Table 2.1 Turbo Debugger programs Table 2.2 Starting Turbo Debugger
TD.EXE must be started from the DOS command line.
Specifying Turbo Oebuggers command-line options
loading your program into the debugger. The following table describes the appropriate debugger to use for the application you've built:
Turbo Debugger program
TD.EXE
TDW.EXE
TD32.EXE
Applications debugged
16-bit DOS applications
16-bit Windows applications
32-bit Windows applications
TDW and TD32 can be started from the Windows locations listed in the following table:
Starting location
Windows
The compiler's integrated environment
Windows' Program Manager FilelRun dialog box
Windows File Manager
Procedure
Open your Borland compiler's group from the Program Manager, and choose the TDW or TD32 icon.
Choose TooliTurbo Debugger to debug the program in the active Edit window.
From the Command input box, type TDW or TD32, followed by any command-line options.
Double-click either the TDW.EXE-or TD32.EXE executable file icon from the directory containing Turbo Debugger.
Turbo Debugger uses command-line options to specify special start-up parameters and debugging modes. The command-line options must be specified before you start Turbo Debugger; you can't specify them once Turbo Debugger is loaded.
The command-line syntax for starting Turbo Debugger is as follows:
TD I TDW I TD32 [options] [progname [progargs]]
The items enclosed in brackets are optional. The options are Turbo Debugger command-line options, and are described in Appendix A. The item progname refers to the name of the program you're debugging, and
progargs are optional arguments supplied to your program. When using
this syntax, be sure to supply a correct path for the program you're debugging.
For example, the following command line starts TDW with the -jp
command-line option, and loads my-prog with the arguments mammal and
river:
TDW -jp my-prog mammal river
Setting command· line options with Turbo Debuggers icon properties
Setting command· line options from Bor/ands
c++
integrated environmentRunning Turbo Debugger
If you start Turbo Debugger using the TDW or TD32 icons, you can specify command-line options using the icon's Property dialog box. This is usually the best way to specify command-line options because the options you specify are saved with the icon's property settings.
You can also specify your program (and optional program arguments) in the command you enter into the Properties dialog box. If you specify your program it'll be loaded into Turbo Debugger when you double-click the debugger's icon. This is the best way to load your program if you're working on an ongoing project.
To specify an icon's Property settings, click the icon, then choose File I
Properties from the Windows Program Manager. In the Command Line input box, type the executable name of the debugger, followed by the desired command-line option(s). Click OK when you're done.
If you transfer to Turbo Debugger from Borland's C++ for Windows integrated environment, you can specify Turbo Debugger's command-line options using the following procedure:'
1. From the C++ integrated environment, choose Options I Tools to access the Tools dialog box.
2. Select TDStartup from the Tools list box.
3. Click the Edit button to open the Tools Options dialog box.
4. In the Command Line input box, enter Turbo Debugger's command-line options after the $TD transfer macro setting.
The $ARG transfer macro in the Command Line input box indicates the arguments that are passed to your program when you transfer to Turbo Debugger from the integrated environment. To specify program
arguments,
1. From the integrated environment, choose Options I Environment to open the Environment Options dialog box.
2. Select Debugger in the Topics list box.
3. Enter the program arguments in Run Arguments list box.
When you run TDW (or TD32 under Windows 32s), the debugger opens in full-screen character mode. However, unlike other applications, you cannot access the Windows shortcut keys Alt+Esc and Ctrl+Esc from Turbo
program, you should not change tasks when Turbo Debugger is running because of the special way the debugger uses system resources.
This is different from running TD32 under Windows NT. In this case, Turbo Debugger activates in a command-prompt window, and it has all the features of a normal Windows application.
Loading your program into the
debug~~::erFigure 2.1 The Load a New Program to Debug dialog box
You can load your program into Turbo Debugger using its command-line syntax (which is described on page 19) or from within Turbo Debugger once it has started.
To load a new program into Turbo Debugger (or to change the currently loaded program), use the File I Open command. This command opens a two-tiered set of dialog boxes, the first being the Load a New Program to Debug dialog box.
TD and TDWs' Load a New Program to Debug dialog box contains an additional button, Session, to support its remote debugging feature. For more information on the Session button, see "Starting and configuring TDW" on page 18I.
If you know the name of thE': program you want to load, enter the executable name into the Program Name input box and press Enter.
To search through directorie:3 for your program, click the Browse button to open the second dialog box (the .Enter Program Name to Load dialog box):
Figure 2.2 The Enter Program Name to Load dialog box
Use the File Name input box to change disk drives.
The Files list box displays the files in the currently selected directory. By entering a file mask into the File Name input box (such as,*.EXE), you can specify which files should be listed.
To "walk" through disk directories, double-click the entries listed in the Directories list box (the .. entry steps you back one directory level). Once you've selected a directory, choose a file to load from the Files list box. To quickly search for a file, type a file name into the Files list box. Turbo Debugger's incremental matching feature moves the highlight bar to the file that begins with the letters you type. Once you've selected a file, press OK.
This action returns you to the Load a New Program to Debug dialog box.
After you've specified a program in the Load aNew Program to Debug dialog box, specify whether or not you want the debugger to run its startup code. If you check the Execute Startup Code check box, Turbo Debugger runs the program to main (or its equivalent) when you load the program. If
you leave this box unchecked, Turbo Debugger will not run any code when you load the program.
To support remote debugging, TDW contains an extra set of radio buttons in the Load a New Program to Debug dialog box. The Session radio buttons specify whether or not the program you're debugging is on a local or remote system. If it's located on a remote system, select the Remote Windows radio button; if it's not on a remote system, select Local. See Appendix B for complete instructions on remote debugging.
Searching for source code
Specifying program arguments
Restarting a debugging session
contain debug information, Turbo Debugger opens the CPU window to show the disassembled machine instructions of that module.)
When you run a program under the control of Turbo Debugger, the
program's executable files (including all.DLL files) and original source files must be available. In addition, all.EXE and .DLL files for the application must be located .in the same directory.
When you load a program or module into Turbo Debugger, the debugger searches for the program's source code in the following order:
1. In the directory where the compiler found thesource files.
2. In the directory specified in the Options I Path for Source command. 3. In the current directory.
4. In the directory where the .EXE and .DLL files reside.
Directories specified with the -sd command-line option override any
directories set with the Options I Path for Source command.
Once your program is loaded into Turbo Debugger, you can use the Run I
Arguments command to set or change the arguments supplied to your program. See page 27 for more information on this command.
If you load your program using Turbo Debugger's command-line syntax (as described on page 19), you can supply arguments to the program you're debugging by placing them after the program name in the command line. For instance, the following command loads the program MyProg with the command-line arguments a, b, and c:
myprog abc
When you exit Turbo Debugger, it saves to the current directory a
session-state file that contains information about the debugging session you're
leaving. When you reload your program from that directory, !Turbo Debugger restores your settings from the last debugging ses'sion.
By default, all history lists, watch expressions, Clipboard items,
breakpoints, operating-system exception settings, and C++ and C exception settings are saved to the session-state file. Session-state files are named XXXX.TR, XXXX.TRW, and XXXX.TR2 by TD, TDW, and TD32,
respectively, where XXXX is the name of the program you're debugging. If
no program is loaded when you exit Turbo Debugger, then XXXX will be the debugger's executable file name (TD, TDW, or TD32).
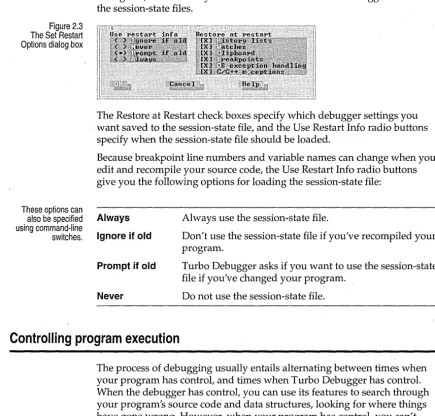
Figure 2.3 The Set Restart Options dialog box
The Options I Set Restart Options command opens the Restart Options dialog box, from where you can customize how Turbo Debugger handles the session-state files.
The Restore at Restart check boxes specify which debugger settings you want saved to the session-state file, and the Use Restart Info radio buttons specify when the session-state file should be loaded.
Because breakpoint line numbers and variable names can change when you edit and recompile your source code, the Use Restart Info radio buttons give you the following options for loading the session-state file:
These options can
also be specified Always Always use the session-state file. using command-line
switches. Ignore if old Don't use the session-state file if you've recompiled your program.
Prompt if old
Never
Turbo Debugger asks if you want to use the session-state file if you've changed your program.
Do not use the session-state file.
Controlling program execution
The process of debugging usually entails alternating between times when your program has control, and times when Turbo Debugger has control. When the debugger has control, you can use its features to search through your program's source code and data structures, looking for where things have gone wrong. However, when your program has control, you can't access the debugger's menus and windows; you must pause your program's execution and allow the debugger to regain control. (TD32's Wait for Child command, explained on page 28, is an exception to this rule.)
The Run menu
Run
Go to Cursor
Trace Into
Debugger offers the following mechanisms to control your program's execution:
• "Single Step" through machine instructions or source lines. • Step over calls to functions.
• Run to a specified program location.
• Execute until the current function returns to its caller . • " Animate" (perform continuous single stepping). • Reverse program execution.
• Run until a breakpoint is encountered.
• Run until a specific Windows message is encountered. • Pause when a C++ or C exception is thrown.
Except for breakpoints, Windows messages, and C++ exceptions, all execution control mechanisms are located on the Run menu.
The Run menu has a number of options for executing different parts of your program. Since these commands are frequently used, most are linked to function keys.
The Run command runs your program at full speed. Control returns to Turbo Debugger when one of the following events occurs:
• Your program terminates.
• A breakpoint with a break action is encountered.
• You interrupt execution with the program interrupt key. • A program error halts execution.
• A
c++ or C exception that you have marked is thrown.The Go to Cursor command executes your program up to the line
containing the cursor in the current Module window or CPU Code pane. If
the current window is a Module window, the cursor must be on aline of source code.
Known as single stepping, this command executes a single source line or assembly-level instruction at a time.
If the current window is a Module window, a single line of source code is executed; if it's a CPU window, a single machine instruction is executed. If
the current source line contains a function call, Turbo Debugger traces into the function, providing that it was compiled with debug information. If the
Step Over
Execute To
Until Return
current window is a CPU window, pressing F7 on a CALL instruction steps to the called routine.
When you single step through machine instructions (using Trace Into in the CPU wmdow or by pressing Alt+F7), Turbo Debugger treats certain sets of machine instructions as a single instruction. This causes multiple assembly instructions to be executed, even though you're single stepping through the code.
\ Here is a list of the machine instructions that cause multiple instructions to be executed when you are single stepping at the instruction level:
CALL INT LOOP
LOOPNZ LOOPZ
Also stepped over are REP, REPNZ, or REPZ followed by CMPS, CMPS, CMPSW, LOOSB, LOOSW, MOVS, MOVSB, MOVSW, SCAS, SCASB, SCASW, STOS, STOSB, or STOSW.
Turbo Debugger treats a class member function just like any other function; F7 traces into the source code if it's available.
The Step Over command,like the Trace Into command, executes a single line of source code or machine instruction at a time. However, if you issue the Step Over command when the instruction pointer is located at a function call, Turbo Debugger executes that function at full speed, and places you at the statement following the function call.
When you step over a source line that contains multiple statements, Turbo Debugger treats any function calls in that line as part of the line-you don't end up at the start of one of the functions. If the line contains a return statement, Turbo Debugger returns you to the previously called routine.
The Run I Step Over command treats a call to a class member function like a single statement, and steps over it like any other function call.
Executes your program until the address you specify in the Enter Code Address to Execute To dialog box is reached. The address you specify might never be reached if a breakpoint action is encountered first, or if you interrupt execution.
Animate
Back Trace
Complete instructions on the Execution History window are given on page 30.
Instruction Trace
Arguments
Program Reset
@!illillJ
that the current procedure works to your satisfaction, and you don't want to slowly step through the rest of it.
Performs a continuous series of Trace Into commands, updating the screen after each one. The animate command lets you watch your program's execution in "slow motion," and see the values of variables as they change. ' Press any key to interrupt this command.
After you choose Run I Animate, Turbo Debugger prompts you for a time delay between successive traces. The time delay is measured in tenths of a second; the default is 3.
If you are tracing through your program using F7 or Alt+F7, you can use Back Trace to reverse the direction of program execution. Reverse execution is handy if you trace beyond the point where you think there might be a bug, and you want to return to that point. .
Using the Back Trace command, you can back-trace a single step at a time or back-trace to a specified point that's highlighted in the Execution History window. Although reverse execution is always available in the CPU window, you can execute source code in reverse only if Full History is turned On in the Execution History window.
The Instruction Trace command executes a single machine instruction. Use this command when you want to trace into an interrupt, or when you're in a Module window and you want to trace into a procedure or function that doesn't contain debug information (for example, a library routine).
Since you will no longer be at the start of a source line, issuing this command usually places you inside a CPU window.
Use the Arguments command to set or change the command-line arguments supplied to the program you're debugging. Enter new arguments exactly as you would following the name of your program on the command line.
Once you've entered the arguments, Turbo Debugger asks if you want to reload your program from disk. You should answer "Yes" because most programs read the argument list only when the program is first loaded.
The Program Reset command terminates the program you're running and reloads it from disk. You might use this command in the following circumstances:
Next Pending Status
Wait for Child
• When you've executed past the place where you think there is a bug. • When your program has terminated and you want to run it again.
• If you've suspended your application with the program interrupt key,
and you want restart it from the beginning. Make sure, however, that you don't interrupt the execution of your program within Windows kernel code.
• If you want to debug a DLL that's already been loaded. To do so, set the
Debug Startup option in the Load Module Source or DLL Symbols dialog box to Yes for the DLL you're interested in, and reset your program.
If you choose the Program Reset command while you're in a Module or CPU window, the Turbo Debugger resets the Instruction Pointer to the beginning of the program. However, the display is not changed from the location where you issued the Program Reset command. This behavior makes it easy for you to resume debugging from the position you were a.t prior to issuing the Program Reset command.
For example, if you chose Program Reset because you executed a few statements past a bug, press Ctrl+F2 to rest your program and reposition the cursor up a few lines in your source file. Pressing F4 will then run to that location.
The Next Pending Status command (available when you're debugging with Windows NT) can be used when the Run I Wait for Child command is set to
No. When Wait for Child is set to No (and your program is running in the background while you're accessing Turbo Debugger), you can use the Next Pending Status command to retrieve a program status message. To indicate that a status message has been sent, Turbo Debugger's activity indicator displays PENDING. Status messages are sent on the occurrence of events such as breakpoints and exceptions.
Wait for Child (used exclusively by TD32 for debugging Windows NT programs) can be toggled to either Yes or No. When this option is set to No,
you can access Turbo Debugger while your program is running; you don't have to wait for your program to hit a breakpoint or exception to access the debugger's views and menus.
Interrupting program execution
Stopping in Windows code
If your program is running, you can access Turbo Debugger by pressing the
program interrupt key. The program interrupt key you use depends on the
type of application you're debugging:
• Use Ctr/+AIt+SysRq when you're debugging a Windows 3.x program. • Use Ctr/+AIt+F11 when you're debugging a Windows 32s program. • Use F12 when you're debugging a Windows NT program. • Use Ctr/+Break when you're debugging a DOS program.
Interrupting program execution is useful when you need to access Turbo Debugger, but haven't set any breakpoints that will interrupt your program's execution.
For example, if you single-step through a Windows application, you'll eventually get caught in the message loop, waiting for a message to be sent to your program. When this happens, you must press F9 to run the' program past the message loop. Once the program is running, you can press the program interrupt key to return to Turbo Debugger.
If, when you return to Turbo Debugger, you see a CPU window without any instructions corresponding to your program, you're probably in Windows kernel code. If this happens, return to Turbo Debugger and set a breakpoint at a location you know your program will execute. Next, run your program (F9) until it encounters the breakpoint. You are now out of Windows code, and can resume debugging your program.
Even though you can access the Module window, set breakpoints, and do other things inside Turbo Debugger, there are a few things that you should not do while you're stopped in Windows code:
• Don't single-step through your pr