Pricing Better
Ray, Sourav and Wang, Li and Levy, Daniel and Bergen,
Mark
McMaster University, McMaster University, Bar-Ilan University,
Emory University, and RCEA, University of Minnesota
16 August 2019
Online at
https://mpra.ub.uni-muenchen.de/95596/
Pricing Better
Sourav Ray**
Department of Marketing, McMaster University Hamilton ON L8S 4M4, CANADA
Li Wang
CHEPA, McMaster University Hamilton ON L8S 4M4, CANADA
Daniel Levy
Department of Economics, Bar-Ilan University Ramat-Gan 52900, ISRAEL,
Department of Economics, Emory University Atlanta, GA 30322, USA, and
Rimini Center for Economic Analysis, ITALY
Mark Bergen
Department of Marketing, Carlson School of Management University of Minnesota
Minneapolis, MN 55455, USA
August 16, 2019
Keywords: Retailing; Pricing; EDLP; HI-LO; Dynamic Capability; Menu Costs; Price Adjustment; Price Elasticity; Price Discovery
JEL Codes: M31, E31, D22, D40, C93, L10, O33, L81
* This work has been possible thanks to grants from SSHRC Canada, Canadian Foundation for Innovation (CFI) and Ontario Research Fund – Research Infrastructure. We owe a debt of gratitude to our industry collaborators for their generous and patient help. We thank Kulothungan Jeganathan and Naeem Ahmed for excellent research assistance. We also thank numerous seminar and conference participants for their comments. We also thank Indian School of Business (ISB), Hyderabad, India, where Sourav Ray was a visiting ISB-CLMP Research Fellow in 2018 while completing a part of this research. All errors are ours.
Pricing Better
Abstract
Electronic shelf label (ESL) is an emerging price display technology around the world. While
these new technologies require non-trivial investments by the retailer, they also promise
significant operational efficiencies in the form of savings in material, labor and managerial costs.
The presumed benefits of ESL, for example, tend to be focused around lower price adjustment
costs (PAC), also known as menu costs. However, ESL not only can save PAC but may also
enable the retailer to price “better,” generating greater value for the transacting parties. Thus,
ESL’s strategic impact for retailers occurs between claiming these presumed efficiencies and
realizing the value generating potential. Using transactions data from a longitudinal field
experiment, we assess such impact of ESL by studying how it shapes retail pricing practices and
outcomes. Our general finding is that ESL plays an enabling role to the retailer’s strategy –
thereby enhancing the retailer’s sales and revenues. The price adjustment efficiencies of ESL
allows retailers to do better waste management, price discovery, as well as leveraging value in
information for consumers. However, ESL’s impact on prices is nuanced, based on the retail
strategy (EDLP, HI-LO) being used. Papers quantifying emerging technologies’ impact on retail
outcomes are sparse, even fewer investigating their role in pricing. To the best of our
knowledge, ours is the first study to explore and quantify how ESL interacts with retail strategy
to affect retail pricing practices and retail outcomes.
Keywords: Retailing; Pricing; EDLP; HI-LO; Dynamic Capability; Menu Costs; Price Adjustment; Price Elasticity; Price Discovery
1. INTRODUCTION
Electronic shelf labels (ESL) are part of an expanding array of retail technologies that include
the likes of self-checkout kiosks, smart carts and a number of RFID beacon and other near field
communication (NFC) applications. Despite the significant investments required, these
technologies are of interest to retailers because they promise significant operational efficiencies.
For example, self-checkout kiosks and smart carts save managerial time and labor costs at check
out, while the several beacon and NFC applications promise savings in information gathering
and communication costs by facilitating customer monitoring and customized prices and
promotions. Similarly, the presumed benefits of ESL tend to focus around lower price
adjustment costs (PAC). However, the impact of these new technologies may go beyond cost
savings. The self-checkouts and personalized promotions may enhance customer shopping
experiences, while ESL may also enable the retailer to price “better,” generating greater value for
the transactions. Competitive advantage for the retailers is derived between claiming these
efficiencies and realizing the value-add potential of such technologies with appropriate
strategies. Unfortunately, papers quantifying emerging technologies’ impact on retail outcomes
are rare, even fewer investigating their role in pricing. In particular, it is hard to find similar
studies for ESL. Thus, our research questions are: How does ESL affect retail pricing and
outcomes like sales volume, and revenue; and how do retailers deploy ESL to support their
strategy?
Note that while the basic technology has been around since the 1990s, the adoption of ESL in
retail has been fragmented at best – greater popularity in Europe and Japan, and a much smaller
installed base but increasing contemporary interest in China, Canada, Israel, USA etc. Recent
engineering advances in the display technologies (e.g. electronic paper) have given it prominence
within the expanding ecosystem of new retail technologies with falling label prices and vigorous
marketing efforts driving industry adoptions. Industry research pegs potential annual growth of
ESL markets to be over 15% globally, with an even higher rate of growth in the American
market (Research and Markets, 2017a,b). At this rate of growth, the global installed base will
almost double within the next five to six years. Surprisingly, few papers directly assess the
possible impact of ESL on retail pricing and outcomes. For example, several papers allude to the
potential of ESL to impact retail prices and pricing practices, either directly or by enabling
Ray et al. 2006; Bergen, et al. 2008; Gedenk et al. 2010; Grewal et al. 2011; Bolton and Shankar
2018). Yet, none directly estimate such impacts. To the best of our knowledge, Garaus et al.
(2016) is the only published paper that assess the direct impact of ESL. However, their focus is
on consumer perceptions of ESL, not ESL’s impact on retail pricing and outcomes.
This lack of attention is quite surprising as it creates a serious gap in our understanding of
pricing technologies. Not only are ESL systems large strategic investments by the retailers, the
retail deployment of ESL with its lower price adjustment costs is presumed to have a direct
impact on the extent of price rigidity and flexibility, which play a central role in modern macro
and monetary economics literature. For example, the modern New Keynesian Dynamic
Stochastic General Equilibrium (New Keynesian DSGE) model, the workhorse model used for
monetary policy analysis, critically depends on the response of prices to monetary policy shocks,
which in turn, depends on the extent of price rigidity. Many monetary economy models need a
high degree of price rigidity to match aggregate data patterns. Among the existing theories of
price rigidity, perhaps the best known and the most popular is the price adjustment cost (PAC),
also called the “menu cost” theory (Barro 1972, Sheshinski and Weiss 1977, Mankiw 1985, Ball
and Mankiw 1994). According to this theory, prices are rigid and thus adjust sluggishly because
it is costly to change them. The natural conclusion is prices will be less rigid with ESL. Yet,
there is limited evidence supporting this outcome.
In recent years, an emerging literature in marketing has explored how the extent of variation
in micro-level price rigidity is an outcome of strategic decisions (Ray et al. 2006; 2012). These
suggest, the deployment of ESL may be only partially predictive of the extent to which prices are
rigid. Moreover, the menu cost models assume that the PACs are exogenously generated—either
fixed and independent of the size of price change (Mankiw 1985), or convex, where cost
increases with the size of price change (Rotemberg, 1982, 1987). In contrast, another developing
literature in business and economics, explicitly consider PACs as endogenous to organizational
factors such as strategic capabilities (Zbaracki et al. 2004; Hallberg 2017). To this end, ESL
technology, which require large expenses and significant organizational changes to realize its
benefits, can be seen as resources that build strategic capabilities, whose return on investments
would depend on its effectiveness in supporting a given retail strategy. Thus the same
technology may support very different retail pricing strategies associated with very different
In this paper, we contend that technologies like ESLs are strategic investments that enhance
the retailer’s strategic capabilities. These capabilities enable retailers to create and claim value
by effective deployment of their strategy and more effective prices. To understand the
mechanism of its impact, we investigate how ESL affects price sensitivity, price adjustments and
price discovery efforts of the retailer. Our empirical design is a pseudo field experiment
comprising transactions data from two supermarkets that implemented ESL. Our analyses use
standard econometric models including Differences-in-Difference (DID), etc.
Our general finding is that ESL plays an enabling role to the retailer’s strategy, offering
significant value-oriented benefits beyond cost efficiency. We find the impact on price
sensitivity, price adjustment patterns, and price discovery modes of the retailers are consistent
with these different roles of ESL. We also find that the nature and scale of ESL’s impact on
retail prices is contextual with greater price rigidity observed in some situations. These indicate
that the impact of ESL is highly nuanced. To the best of our knowledge, we are the first to
explore and quantify how a price display technology like ESL interacts with retail strategy to
affect retail pricing and its outcomes.
In the rest of the paper, we first discuss the ESL technology and the related literature in
section 2. We describe our data in section 3, in particular – the supermarket stores from which
we get our data, their respective positioning strategies and specific use cases for the ESL
implementation. In section 4, we describe the experimental set up identifying the treatment and
control groups. In section 5, we specify the empirical models estimating the impact of ESL on
retail outcomes, price sensitivity, price adjustment patterns and price discovery, and present the
results. A discussion of the results and their implications for research and practice is in section
6. Section 7 concludes by pointing out some limitations and future areas of study.
2. ELECTRONIC SHELF LABELS AND RELATED LITERATURE
Electronic Shelf Labels (ESL) are electronic label displays that, for the most part, replace
paper tags. Sometimes, also referred to as electronic price tags or as electronic point of purchase
(EPOP) displays, these labels are typically based on LCD or electronic paper (e-paper)
technologies. The labels are wirelessly connected to a central computer, typically in the back
office of the retailer. This allows the retailer to change the information displayed on the labels
displays are integrated with the point of sale (POS) systems used at store checkout.
Economies of Scale in Physical Price Adjustment Costs (Menu Costs)
One immediate and obvious benefit of ESL systems in a multi-product setting is their ability
to cut dramatically the physical price adjustment costs (menu costs) of the traditional paper-tag
based price system, to the point where the menu cost of adjusting one additional price is close to
zero, or perhaps even zero. Thus, ESL systems introduce economies of scale in price adjustment
technology, letting the retailer adjust the price of a given good more frequently while incurring a
fraction of the cost. These savings can be substantial in light of the existing empirical evidence.
For example, Levy et al (1997, 1998) and Dutta et al (1999) use time and motion
measurements data on paper-price tag based price adjustment processes, which were collected by
an ESL system manufacturer. The company collected these data in order to measure and validate
the cost savings that their system could generate. Using these data, Levy et al (1997, 1998)
report that the annual menu costs at large US supermarket chains average about $105,887 per
store (in 1991–1992 prices).1 In relative terms, the total estimated menu costs, which equal
$0.52 per price change on average, comprise 0.70 percent of revenues and 35.2 percent of net
margins, suggesting that the magnitude of the menu cost is substantial. Dutta et al (1999) report
comparable menu cost estimates for a large US drugstore chain. There are no comparable cost
estimates with ESL. However, it is safe to conclude conservatively, ESLs would save the bulk
of these physical price adjustment costs.
Managerial Price Adjustment Costs
Going beyond the physical menu costs, there is an emerging literature that calibrates the
managerial and customer costs of price adjustments. The ESL’s role in these other components
of the PACs is unclear. Zbaracki et al (2004) try to shed light on the magnitude of the
managerial cost of price adjustment. They conduct time and motion measurements of price
adjustment processes at a one-billion-dollar US industrial manufacturing company and its
customers. They find that the managerial costs of price adjustment are more than 6 times, and
the customer costs of price adjustment are more than 20 times the menu cost. In dollar terms,
1 In 2019 prices, this would be equivalent to $199,131. For large chains, these figures amount to significant sums of
they find the total annual cost of price adjustment in 1997 is $1,216,445.2 Of this amount, 3.57%
is the menu cost, 23.03% is the managerial cost which includes the cost of information gathering
and analysis, systems cost, and the cost of the managerial time spent on the evaluation and
decision of price changes, and 73.40% is the customer cost of price adjustment. So,
conservatively, even if the managerial and customer costs of ESL are similar to that of paper
labels, the potential for saving the physical menu costs are still significant.
However, there is reason to believe, ESLs introduce significant economies even in the
managerial costs of price adjustments. Much of these managerial costs derive from the time and
effort required by managers to decide on what prices to implement. Large price changes can be
especially onerous. ESL systems make small price changes profitable. For example, under the
existing manual, posted paper price tag based system, small price changes might not be
worthwhile because their fixed cost may exceed the benefits. The ESL systems, by reducing the
menu costs to zero (or close to zero), make such small price changes profitable. For example,
Levy et al. (1997) report that the supermarket chains in their sample, in an average week
experience cost increases on about 800–1,000 products they sell. However, the supermarkets
adjust prices of only about 70–80 percent of these products. The remaining 20–30 percent of the
prices are not adjusted immediately because the existing menu costs make the necessary price
adjustments unprofitable. ESL systems would make these smaller price changes profitable, and
thus the chain would leave less money on the table.3
Economies of Scope
ESL systems also have the ability to adjust many prices with a click of a button, suggesting
that these systems introduce economies of scope as well in the price adjustment technology, an
idea that was suggested by Lach and Tsiddon (1996, 2007), to explain the within-store
synchronization and cross-store staggering of price changes that they found in their data.4
Newer versions of the ESL technology come with enhanced graphics and display options that
allow the retailer to provide myriad information, including, but not limited to branding,
2 In 2019 prices, this is equivalent to $2,287,646.
3 Consistent with these empirical observations, in standard theoretical menu cost models that economists frequently
use, prices do not adjust to small shocks. In some models, the shocks need to be exceptionally large for prices to start adjusting. See, for example, Karadi and Reiff (2012).
4 Alvarez and Lippi (2014), Baudry et al (2007), Dhyne and Konieczny (2007), Levy et al (1997), Midrigan (2011),
competitor information, vendor promotions, quality and product attributes, price discount ending
date, etc. So, ESL systems enable the company managers to monitor and adjust not only the
prices, but also the quantities, the inventories, promotional information, competitive information,
vendor management, nutritional value information, etc. In other words, the economies of scope
that comes with ESL systems, covers wider range of business activities and resource use.
Price Discovery
An important advantage of an ESL system over the existing paper price tag based system that
is related to these managerial costs, is its ability to allow price experimentation. Price
experimentation and price discovery practices seem to be far more common than the literature
recognizes. There is evidence that the type of price adjustment practices sometimes retailers are
engaged in, can be best explained by a model in which there is an uncertainty about the demand
elasticity and/or about competitive factors. Under these circumstances, the firms are unable to
price optimally. To overcome these difficulties, it might be optimal for the firms to engage in
price experimentation, in order to discover the right price, by trial and error. Theoretically, the
optimality of these types of activities that involve price learning and discovery, has been
demonstrated by Rustichini and Wolinsky (1995), Balvers and Cosimano (1993), and Aghion et
al. (1991), among others.
On the empirical front, Argente and Yeh (2016) find that the prices of new products change
twice as often as the prices of the average product. In addition, they find that the average size of
these adjustments is at least 50 percent larger than the average price change. They show that a
menu cost model with price experimentation can rationalize these findings. Bachmann and
Moscarini (2011) present evidence that is consistent with a model of monopolistic competition in
which there is imperfect information about the demand, but the firm gradually learns and
discovers its price elasticity from the sales volume. Keil et al (2001) report that managers that
were assigned long-term goals were engaged in more price experimentation, in comparison to the
managers that were assigned short-term goals. Campbell and Eden (2014) also document
micro-level price behavior, which is consistent with a model that incorporates experimentation.
ESL makes it feasible to review and consider price adjustments of varying frequency as well
as of varying sizes by conducting small scale, within-store, pricing and price adjustment
the zone level, etc., at low cost. ESL systems can be linked to the companies’ inventory and
financial management software, and therefore learning, analyzing, and discovering the
bottom-line profitability scenarios and outcomes of such pricing experiments can be accomplished
quickly and efficiently, at relatively low cost.
This capability of the ESL systems is particularly beneficial because in the absence of
experimentation, a full optimization requires a complete knowledge of all the relevant
information, which would be prohibitively costly to gather and process. Experimentation of the
type we are discussing here is perhaps not the first best, but given its feasibility and its low cost,
it can be a very cost-effective in terms of the learning speed as well as effectiveness.
Price Coordination across Markets/Regions
Adams and Williams (2019) note that many large multi-store retailers do not always price on a
store-by-store or even on a market-by-market basis. Instead, they observe, prices are set on a
zone-by-zone basis, where each zone spans several markets that form a heterogeneous group.
DellaVigna and Gentzkow (2019) find that most US food, drugstore and mass merchandise
chains charge nearly uniform prices across stores despite wide variation in consumer
demographics and the level of competition. Based on price elasticity estimates, they conclude
that the average chain sacrifices 7 percent of profits relative to a benchmark of flexible prices.
This pricing practice may be due the chains’ to inability to efficiently manage heterogeneous
pricing profiles across large number of stores and/or markets. The ESL technology has the
potential to make geographically segmented pricing and price adjustment processes practically
and logistically more feasible as well as more cost efficient. The ability of the ESL to permit
small-sample experiments and price discovery exercises at low cost, will permit more optimal
pricing adapted to local settings.
Strategic Benefits and Consumer Value
There are other, less obvious advantages of ESL systems. The economies of scale in changing
prices can allow retailers manage waste more effectively, especially for perishable products.
They can change prices more frequently (e.g. several times a day or even by the hour, instead of
once a day or week), and can time and grade them to achieve higher sales yields and lesser
excess inventory at the end of the selling cycle.
implications. Ray et al. (2006) study a theoretical model, where a strategically minded
wholesaler with low enough menu costs, takes advantage of the menu cost that the retailer faces
to make frequent “small” price increases. The retailer is unable to pass-through these because of
the menu cost s/he faces. Such small price changes can also be key strategic imperatives for
retailers in consumer electronic markets as shown in Ray et al. (2012). Chen et al (2008) show
that frequent small price changes exist at the retail food markets as well.
The integration of the ESL systems with the same POS database that is connected to the
checkout counters minimizes chances of a mismatch between the shelf price and the checkout
price (over or under ring), leading to greater consumer confidence in prices. Bergen et al. (2008)
discuss the potential significance of such confidence for both retailers and policy making.
The savings in time and efforts of the in-store execution and management staff can be
channeled into providing more streamlined and effective service to improve customer
experience. These complement the sleek designs of ESL, which can improve the look and feel of
a store, creating a more positive image compared to stores with older technology (Garaus et al.
2016). Some argue that the standardized design of price displays may even mute the salience of
prices and enhance the utility of other non-price related attributes of the retailer (Soutjis, et al.
2017), thereby reducing the consumer’s price sensitivity.
ESL and Retail Strategic Positioning
Overall, the potential impacts of ESLs appear to come in essentially two different forms. The
first is efficiency in terms of cost savings – both physical menu costs as well as managerial price
adjustment costs. The second is the added value ESL creates for retailers and consumers. It
enables retailers to manage its price adjustments strategically, find better prices and in turn,
being able to offer greater value to its customers. Between realizing these efficiencies and
claiming the added value, retailers can generate better gross margins for themselves.
Nevertheless, the process by which these higher margins are to be generated completely
depends on the strategic focus of the retailer. For some retailers, frequent price changes are a
core part of their strategic positioning. Certainly, ESL would potentially result in cost savings
for such retailers. However, the potential for ESLs to support even greater flexibility in prices
may be less compelling for these retailers than supporting higher margins due to added value and
strategic positioning. Thus, both cost savings from frequent price changes as well as the
potential of ESLs to support flexible prices may be moot for such retailers. Yet, ESL systems
may enhance these retailers’ ability to find the right prices to support such consistency. A key
upshot of this line of thinking is to suggest that while ESL may reduce PAC, it may not
necessarily lead to less rigid prices, which would depend on retail strategy.
3. DATA
The data for our study comes from two different supermarket stores in the North-West Milan
region of Italy. We will call them stores S and M. Both belong to one of the largest grocery
store operators in the country, which has over 1,000 stores. Both stores are owned and operated
by individual store management. The parent company had worked collaboratively with a
consulting company specializing in POS technology, to install ESL in limited scale in the two
stores. ESL was installed in the Fresh Fruits and Vegetables departments of both stores as well
as in the Delicatessen department of store M. One of the objectives of the installation was to
assess the potential return on such investments, over an extended period of deployment.
Our data comprises of two types. First, we have records of sales-receipts generated at the
POS over a two-year period, spanning the date when ESL was installed. In particular, for store
S, we have 445,252 receipts for 105 weeks (July 16, 2007–July 16, 2009); with ESL installed in
the 60th week (September 16, 2008). For store M, we have 384,475 receipts for 106 weeks (July
3, 2007–July 23, 2009); with ESL installed in the 70th week (November 18, 2009). Second, we
received privileged access to some confidential internal reports and white papers of the company.
Our descriptive details are drawn from the information in the written reports, while the statistical
analyses are based on the POS sales records.
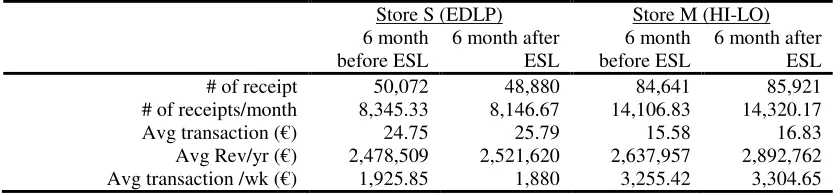
Store Size and Operations
The stores are largely similar to each other in many respects including size, gross profit
percentages and growth. Based on the sales data of 6 months before the ESL installation in
2008, we estimate the annual sales revenue of store S to be in the range of 2.5 million Euros, and
that of store M to be about 2.6 million Euros. The average purchase per receipt is higher for
store S at €24.75 than for store M at €15.58. However, store S has an average of about 1,900
consumer transactions per week, compared to about 3,200 for store M. Based on internal
respectively, and similar sales growth trajectories for comparable categories (3%).
However, we find that there are differences in expenses as a percentage of sales, 23.8% at
store S vs. 4.2% at store M. The staff at store S is mostly comprised of temporary and
inexperienced workers, while that of store M is comprised of more skilled, department managers.
This reflects in the average wage rate for store S (at £9/hr) being significantly less than that of
store M (£12/hr). That said, there are important distinctions between the stores when it comes to
their strategic retail positioning and their purported use of the ESL technology.
ESL for Store Pricing Practices – EDLP and HI-LO Positioning
From a description of their pricing processes, we know that store S prices are based on
warehouse price margins. Yet, pricing consistency is deemed very important and changes in cost
are not immediately reflected in prices, and there are only few promotions. This type of pricing
is generally associated with Every Day Low Price (EDLP) positioning. EDLP retailers aim to
provide value to consumers by maintaining a high level of price consistency and reducing
instances and salience of periodic price promotions.
In contrast, in store M, maintaining price consistency is less important with around 50% of
prices changing daily, only some of which may be due to cost changes. In fact, the store
manager can set its own selling price, and not necessarily as a margin on warehouse price. This
type of pricing is consistent with HI-LO positioning. HI-LO retailers aim to provide value to
consumers and draw traffic to the store by frequent price promotions over its product lines.
As a pricing technology that purports to give enhanced ability to the retailer at managing price
changes, ESL appears to have a direct role to play in implementing these retail strategies –
greater price consistency in EDLP and more effective price changes in HI-LO. A key focus in
the assessment of return on investment (ROI) was the ESL’s role in better implementation of the
retail strategies.
Figure 1 plots the average weekly prices for two random treatment group product for the two
stores. Note here store S has fewer price changes than store M in a similar time period – as
would be expected from the description above. Visually it is difficult to discern any specific
change in pattern between pre- and post-ESL installation weeks.
ESL for Waste Management
significantly. Acting proactively to clear unsold inventory of perishables was a major concern
for store S. Typically, the department manager would reduce prices at the end of the day to sell
off unsold produce. This came with several challenges. First, the manual task of managing price
reductions across a number of products is non-trivial. Second, discounts could be too deep,
leaving money on the table, or too shallow, resulting in unsold produce.
ESL could enable the managers to run more efficient “on special” promotions as opposed to
engaging in a fire sale of unsold inventory. ESL could also help price better, resulting in less
“extra” inventory towards the end of the day, as well as discounting just enough, and no more, to
get the desired sales lift. In contrast, waste management was not a big managerial concern for
store M. In the perishable Fruits and Vegetables department a waste of 5%–7% was considered
acceptable. In the Delicatessen department where products are normally cut to order, wastage
was negligible.
ESL for Consumer Information
Consumer information was also a focus of the ROI from ESL. Strict Italian fresh food
labeling laws require detailed and accurate provenance information be displayed at point of
purchase, with heavy fines imposed on retailers for noncompliance. So both stores were keen to
avoid such fines. ESL could reduce the costs of compliance by making the process of providing
such information more efficient when products were repriced, re-shelved, and during inventory
changeovers. However, ESL would allow the stores to easily provide additional information not
mandated by law, such as competitor pricing information or additional non-price attributes. This
is where the stores differed. While store S focused on compliance, store M aimed at going
beyond and provide additional information such as region of origin, flavor, etc. across its product
lines. This would presumably give greater value to its customers, resulting in a sales lift and
contributing further to the ROI.
ESL and Managerial Supervision
Last but not the least, was the concern with managerial time-savings. Recent legal changes in
Italy required stores to provide additional data for livestock such as where the animal was raised,
where slaughtered and where butchered, along with license numbers for the slaughterer and
butcher. The item purchased must contain this data for full traceability. The volume and
applied to beef, the externalities of such regulatory attention meant there was a heightened
sensitivity for managerial supervision and monitoring of staff compliance across the store. ESL
was expected to introduce more economies of scale for both stores by centralizing such efforts.
In summary, the key differences in the use of ESL across the stores were in the
implementation of strategic price positioning – EDLP for store S, HI-LO for store M; greater
emphasis on efficient waste management for store S; and greater emphases on value through
consumer information for store M.
4. EXPERIMENTAL DESIGN AND MEASUREMENT ISSUES
Recall that ESL was installed in the fresh fruits and vegetables (F&V) department in store S
and in both F&V and Delicatessen departments in store M. Given the before-the
ESL-installation and after-the-ESL-ESL-installation data, we have a pseudo experimental setup to study the
impact of ESL on retail outcomes (price, sales volume and revenue) in these departments. For
purposes of comparability, we only analyse the F&V department. In experimental design terms,
this would be considered the treatment group. However, a simple before- and after-comparison
would not be able to isolate the impact of ESL since several unobserved variables that vary over
time might confound the results. Therefore, for identification purposes, i.e. to isolate the effect
of ESL, we need to choose an appropriate department as a control group.
Choice of Control Group
Ideally, this control department would be similar to the treatment department such that it
would be affected by all the potential unobserved variables, except that it will not be affected by
ESL. Since there are several departments other than F&V in the stores, where ESL was not
installed, all of them are potential candidates as control departments. We select a specific
control in the following three steps:
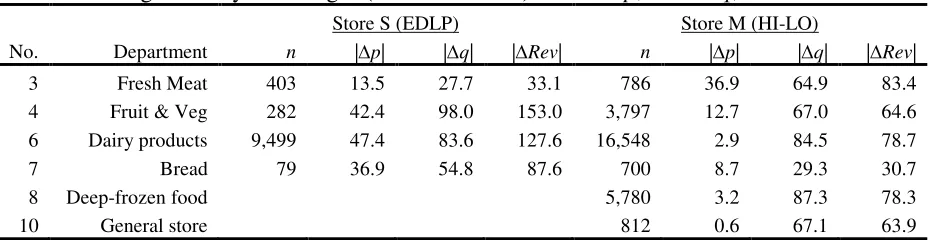
(1) Select candidate daily purchase categories, preferably food related. At this stage, we
selected the following five departments: Fresh Meat, Dairy Products, Bread, Deep-Frozen Food,
General Store.
(2) From the above we then select a subset with similar average price, volume and revenue
changes over time. This resulted in the following three departments: Fresh Meat, Bread, General
Store. We then dropped General Store and Bread, for we did not have enough observations in
(3) Lastly, we checked if Fresh Meat exhibits similar time trends before and after ESL. A
similar trend offers additional assurance that Fresh Meat is independent of ESL and thus a good
control. For this we ran the following regression:
(
)
(
)
2 2
1 2 3 4 5
t t t t
y = α + βt + β t + β ESL × t + β ESL × t + β ESL + ε (1)
where yt is the dependent variable (price, sales volume, or revenue of Fresh Meat) in week t,
t
ESL is a binary variable which equals 1 if t is after implementation of the ESL and 0, if before,
and
ε
t is the error term. A significantβ
3 orβ
4 coefficient would suggest that the trend differsbetween before and after ESL. We run this analyses for both stores and find strong evidence that
there is no such ESL dependency – five out of the six regressions return insignificant
coefficients. Thus we conclude that Fresh Meat is an appropriate control department for our
identification purposes.5
Data Aggregation and Descriptive Statistics
Recall that our data is at a highly disaggregate, individual purchase incident level. This
allows us to track individual products over time. To ensure relative balance we use 53 weeks’
data before ESL installation, for both stores. We then use most of the available weeks in the post
installation period – 42 weeks for store S (EDLP) and 33 weeks for store M (HI-LO). We drop
four weeks (2 weeks before and 2 weeks after) around the installation date to filter out any
disruption due to installation.
Each product in our data is identified by a 13 digit EAN (European Article Number) code and
is classified as belonging to one of 25 “departments” which are the broad store categories like
F&V (our treatment category), Fresh Meat (our control category), etc. For store S (EDLP), the
before-ESL and after-ESL number of products in the sample were (26, 26) for the treatment
group and (17, 11) for the control group. Correspondingly, for store M (HI-LO) the before-ESL
and after-ESL number of products in the sample were (335, 273) for the treatment group and (61,
87) for the control group. To adjust for the unbalanced nature of the sample between the
treatment and the control groups, we use robust estimates in our analyses.
We aggregate the data for each EAN code in the two departments at a weekly level.
Computing the average weekly unit price is not straightforward. We first calculate the unit
prices for each receipt in a given day from the recorded gross price divided by the units. We
then compute the median of such unit prices as our daily central tendency measure. For the
weekly unit price, we take the average of the daily medians. We impute missing unit prices with
previous period price only if the number of continuous missing weeks is less than or equal to 2.
We had to exclude approximately 36% of the original data – mostly products sold by weight, for
which we did not have enough information to calculate the unit price.
After accounting for missing data (e.g., not all products are purchased every week) and the
aggregations, the total number of observations we have for store S (EDLP) are 422 before-ESL,
and 302 after-ESL, for the treatment (F&V) category. The corresponding numbers are 422 and
389 for the control (Fresh Meat) category. For store M, the number of observations are 9,097
and 4,543 for the treatment category, and 1,636 and 1,402 for the control category, respectively.
See Table 1.
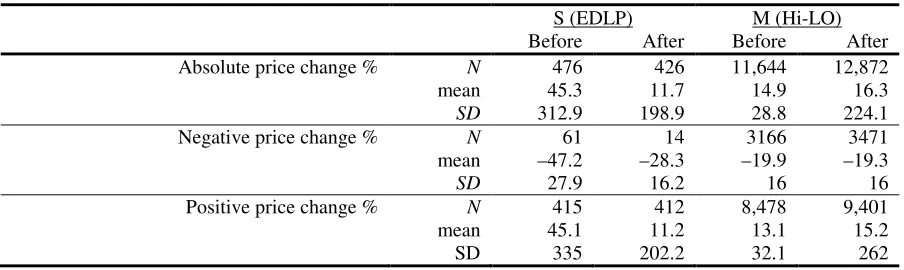
In Table 2, we report some descriptive statistics pertaining to price, volume sales and revenue
in our sample. The average prices in store S increase (e.g. from 1.59 to 2.58 for treatment
group), while that of store M remain similar (e.g. 1.73 to 1.69). The average sales volume for
store S decreases (12.88 to 9.36) while that of store M remains similar (22.96 vs. 23.13).
Revenue in both cases remain similar (19.61 vs. 18.83, and 36.90 vs. 35.30 – in ×100 Euros – for
store S and store M, respectively).
While we restrict our analyses to F&V and Fresh Meat departments, we also looked at the
store-wide sales figures by comparing the number of transactions and average value of the
receipt level transactions six months before and after the ESL installation. The average
transactions of the store are marginally better in the post-ESL period (25.79 vs. 24.75, and 16.83
vs. 15.58, for store S and store M respectively). However, there is some drop in the average
number of transactions per week for store S (1,925 to 1,880), and a small increase for store M
(3,255 to 3,304). See Table 3. However, not much can be inferred from these descriptive
numbers in terms of the impact of ESL on the retail outcomes. For that we now turn to the
econometric analyses.
5. EMPIRICAL MODEL ESTIMATIONS AND RESULTS
Our primary empirical objective is to investigate how the ESL technology can enable and
outcomes, viz. prices, volume and revenue, as well as the process by which such an impact
operates.
We start by assessing the impact of ESL on price, volume and revenue and how these differ
for the different stores, and discuss the robustness checks we conduct. Then, to get insights into
the processes that operate for different retail strategies, we estimate ESL’s impact on price
sensitivity for the different stores, along with several robustness checks of our results. The next
analysis investigates ESL’s impact on price adjustment patterns of the different stores as further
investigation into the determining processes. The last analysis explores whether ESL impacts the
price discovery efforts of a retailer.
Impact of ESL on Price, Sales Volume and Gross Revenue – Difference-in-Difference
To estimate the impact of ESL we use the Difference-in-Difference (DID) model. DID is a
quasi-experimental method used to measure the effect of a treatment or intervention over time. It
allows for comparisons over time for a non-random sample by comparing the treatment group
before and after an intervention, with a suitably matched control group that does not receive the
intervention.
DID with Pooled Data
We first pool the data from both stores to run the following basic model:
ln (𝑦𝑦𝑗𝑗𝑗𝑗𝑗𝑗) =𝛼𝛼+𝛾𝛾(𝑇𝑇𝑇𝑇) +𝛽𝛽(𝐸𝐸𝐸𝐸𝐸𝐸) +𝛿𝛿(𝑇𝑇𝑇𝑇×𝐸𝐸𝐸𝐸𝐸𝐸) +𝜇𝜇𝑗𝑗+𝜗𝜗𝑗𝑗 +𝜏𝜏𝑗𝑗+𝜀𝜀𝑗𝑗𝑗𝑗𝑗𝑗 (2) where, yjit refers to the dependent variable of interest (price, sales volume, revenue) – for store
j, product (SKU/EAN) i, and week t. TD is a dummy variable, which equals 1 if product i
belongs to the treatment department, and 0 otherwise; ESL is a dummy variable, which equals 1
if week t is after the ESL intervention, and 0 otherwise; µj is a fixed effect for store,
ϑ
i is afixed effect for products, and
τ
t is a fixed effect for week. εjit is the error term. We use robuststandard error estimates to deal with potential heteroscedasticity of the error terms.
There are two reasons why we use the natural log transformation. First, our data is highly
skewed with large variance. Using the natural log transformation flattens the spread and reduces
the impact of the outliers.6 Second, using ln( ) jit
y makes the interpretation of the coefficient δ
particularly convenient; it is the post-ESL change of the treatment group response as a
percentage of the control group.
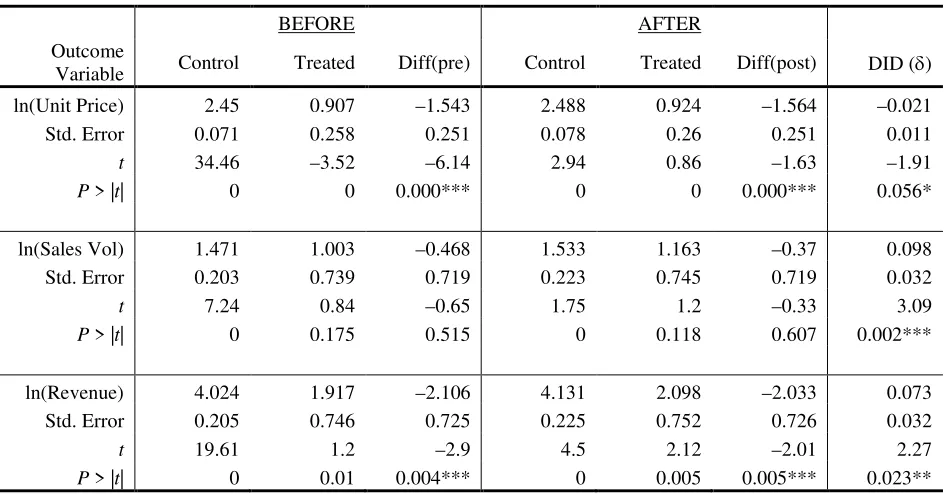
The results of the pooled DID is reported in Table 4(a). We find that following ESL
installation, there is a marginally significant decrease in unit price of the treatment group relative
to the control group (δ = –0.021; p = 0.056). On the other hand, sales volume and gross revenue
shows a significant increase by 9.8% (δ = 0.098; p = 0.002) and 7.3% (δ = 0.073; p = 0.023),
respectively.
DID by Store
We next run the same DID analyses separately for the two stores to check if ESL has different
impact on the two stores. For this we run the following model, separately for each store:
ln (𝑦𝑦𝑗𝑗𝑗𝑗) =𝛼𝛼+𝛾𝛾(𝑇𝑇𝑇𝑇) +𝛽𝛽(𝐸𝐸𝐸𝐸𝐸𝐸) +𝛿𝛿(𝑇𝑇𝑇𝑇×𝐸𝐸𝐸𝐸𝐸𝐸) +𝜗𝜗𝑗𝑗+𝜏𝜏𝑗𝑗+𝜀𝜀𝑗𝑗𝑗𝑗 (3) Since we run the analyses separately for each store, this model is identical with the earlier model
except that we do not have the subscript j and the store fixed effect µj. Table 4, panels (b) and
(c) report the estimation results.
The results show that for store S (EDLP), post-ESL treatment group responses are
significantly higher than pre-ESL levels: unit price is higher by 13% (δ = 0.131; p = 0.001),
sales volume is higher by 17% (δ = 0.174; p = 0.003), and gross revenue is higher by 31% (δ =
0.308; p = 0.000), compared to the control group. These numbers are substantial and are all
statistically significant at the 1% level. For store M (HI-LO), the results are more of a mixed
bag. While there is no statistically significant change in unit price levels (δ = –0.018, p = 0.132),
sales volume exhibits an increase of 8% (δ = 0.082, p = 0.017) relative to the control group.
Gross revenue also exhibits an increase of about 6% (δ = 0.058; p = 0.091), though only
significant at the 10% level.7
Robustness Check – Placebo Interventions
To rule out the possibility that the estimation results are an artifact of the DID method, we
conducted the placebo test. For this we separated the pre-ESL and post-ESL data and introduced
arbitrary intervention points in each. We then proceeded to conduct the DID estimation for each
of these arbitrary specifications. A significant δ coefficient will reject the null hypothesis that
there is no placebo effect.
Recall that for store S, the actual ESL installation was on the 63rd week. For the placebo test
in the pre-ESL sample, we introduced weeks 23, 33 and 43 as intervention points. Similarly, for
the post-ESL sample, we specified weeks 73 and 83. For store M, where the original ESL
installation was done on week 70, we specified weeks 30, 40 and 50 for the pre-ESL sample; and
weeks 80 and 90 for the post-ESL sample. So, we are able to do 2 (store) × 3 (response
variables) × 5 (intervention points), i.e. 30 comparisons. A large majority (26 out of 30) of the
coefficients are not significant statistically, suggesting that our estimation results are not an
artifact of the DID specification.8
Impact of ESL on Price Sensitivity
We next focus on assessing how ESL affects price sensitivity of the treatment group. There
are several reasons to believe ESL will have an effect on consumers’ response to retail prices. In
principle, to the extent retailers are able to discover “better” prices, they are able to generate
greater response from the consumer. Smaller price reductions, for example, might result in the
same demand lift as higher reductions were getting earlier. This will reflect in the data as higher
price sensitivity. On the other hand, to the extent retailers are able to offer diagnostic
information that is valuable to the consumer, through the use of ESL, they may succeed in
moving the consumer focus away from a price-centric purchase decision to a more value-centric
one. This could reflect in the data as lesser price sensitivity. In addition, ESLs could also free
up staff time from managing and supervising pricing processes to customer service, further
contributing to perceptions of value (Levy et al 2010). As well, ESLs might also contribute to a
cleaner and more sophisticated look and feel of the store, enhancing the shopping experience and
also contributing to the perceptions of value.
To estimate price sensitivity, we use the standard Autoregressive Distributed Lag (ADL)
models. Our basic specification is an ADL(1,1) model, as follows:
𝑙𝑙𝑙𝑙(𝑞𝑞𝑗𝑗𝑗𝑗) =α + 𝛽𝛽1𝑙𝑙𝑙𝑙�𝑞𝑞𝑗𝑗,𝑗𝑗−1�+β2𝑙𝑙𝑙𝑙(𝑝𝑝𝑗𝑗𝑗𝑗) +β3𝑙𝑙𝑙𝑙�𝑝𝑝𝑗𝑗,𝑗𝑗−1�+𝛾𝛾1𝑙𝑙𝑙𝑙(𝑝𝑝𝑗𝑗𝑗𝑗)∗ 𝐸𝐸𝐸𝐸𝐸𝐸
+𝛾𝛾2𝑙𝑙𝑙𝑙�𝑝𝑝𝑗𝑗,𝑗𝑗−1� ∗ 𝐸𝐸𝐸𝐸𝐸𝐸+𝛾𝛾3𝐸𝐸𝐸𝐸𝐸𝐸+𝜗𝜗𝑗𝑗+𝜀𝜀𝑗𝑗𝑗𝑗 (4) where, qit and pit are respectively, the quantity sold and unit price of product i in week t; ESL is
a dummy variable which equals 1 if t is after ESL installation, and 0 if before;
ϑ
i is productfixed effect and
ε
it is the error term. Using the natural log-log specifications have the twinadvantage of muting the impact of outliers as well as offering a convenient interpretation of the
regression parameters. In particular, price elasticity can be calculated from the estimated
coefficients, as:
Price Elasticity = + ×
β γ
2 1 ESL (5)Endogeneity and Instrumental Variables
One of the challenges of the earlier specification is the potential endogeneity between pit and
it
q . Not only does price affect the quantity demanded but quantity might also affect the prices
set by the retailer, making price potentially correlated with the error term. It might be
worthwhile to mention here that since our data comes from a single retailer who has price setting
power, the endogeneity problem might not be as severe as in more aggregate data sets with
multiple, possibly multi-store retailers, who set prices for multiple stores and multiple products.
In our case, it is more likely that the retailer only has control over prices that he uses to get a
response in terms of quantity demanded. Nevertheless, we address the potential endogeneity
with a standard two-stage-least-squares approach using instrumental variables.
The desired characteristic of good instruments is that they will be correlated with the
endogenous variable, in our case pit, but uncorrelated with the dependent variable, in our case
it
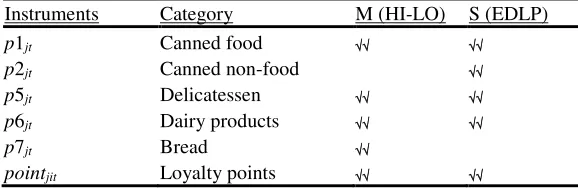
q . We consider two broad types of instruments. First, we take the average prices of available
“other” categories as instruments. Specifically, we consider the average prices of the following
categories: Canned food, Canned non-food (only for Store S), Delicatessen, and Dairy and Bread
(only for Store M). The average retail prices are a big part of a retailer’s price positioning; for
example, they distinguish between high-price versus low-price retailers. Therefore, these “other”
category prices are expected to be correlated with price levels of the treatment group; but are
otherwise not expected to be correlated with the treatment group quantity sold. Second, we take
advantage of the data on the store’s loyalty program, to construct the following instrument:
a particular receipt r that included purchase of product i. Pointsjit is the sum of all loyalty points
in receipts including the purchase of product i in a particular week t. Pointsjit is constructed
such that it satisfies two key characteristics. First, more frequently purchased products get
assigned more Pointsjit compared to those that are not. This is by construction. Since more
frequently purchased products are likely to be priced differently than products not purchased as
frequently, Pointsjit would be correlated with pjit. Second, Pointsjit is related to the total
monetary value of the purchase and not the quantity of individual product purchases. Hence,
purchase quantity of the product qjit, is uncorrelated with Pointsjit. Thus, Pointsjit appears to
be a good instrument for pjit. We run the analyses separately for the two stores. The estimation
results are reported in Table 5.
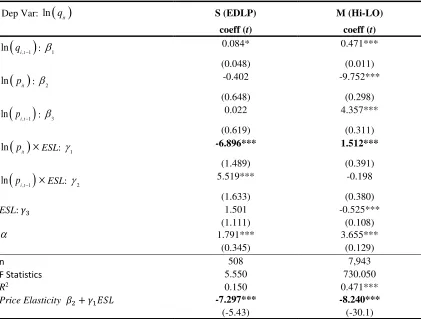
Note the distinct nature of the coefficients.
β
2 is not significant for store S (EDLP) whereasit is for store M (HI-LO) (
β
2= –9.752). This is consistent with the different strategic positioningof the stores since the EDLP stores do not change much prices, while the HI-LO stores depend
on periodic promotions to draw traffic. The coefficient
γ
1 is statistically significant andnegative for store S (–6.896) suggesting that the demand is more price sensitive post-ESL. On
the other hand,
γ
1 is statistically significant and positive for store M (1.512) suggesting demandis less price sensitive post-ESL. Calculating the pre-ESL and post-ESL price elasticity for the
two stores, we get the price elasticity (in absolute value) of store S (EDLP) increases from –
0.402 (not statistically significant) to –7.297 (statistically significant); while that of store M
(HI-LO) decreases from –9.752 to –8.240 (statistically significant).
Robustness Checks for Price Sensitivity Patterns – Alternate First Difference Specifications
To check that the price sensitivity patterns evident in the estimated elasticities above are
robust, we ran the following alternate first difference specification.
( )
1( )
2 1( )
ln qit lnα β pit β ESL γ ln pit ESL ϑ εi it
∆ = + ∆ + + ∆ × + + (7)
We use the first differenced values of the same variables used earlier, as instruments for
( )
ln pit
∆ . The results are reported in Table 6.
sensitivity post-ESL. For store S (EDLP),
γ
1 is –2.061 (p < 0.01) suggesting price sensitivityincreases in the post-ESL period. On the other hand, for store M (HI-LO),
γ
1 is 1.830 (p < 0.01)suggesting price sensitivity decreases in the post-ESL period. Note that this pattern is exactly
the same as in the ADL(1,1) specification.
Impact of ESL on Price Adjustments
We turn our focus next on investigating the price adjustment patterns of the stores in the pre-
and post-ESL periods. Specifically, we estimate the average percentage price changes,
separately for price increases and decreases, as follows:
(
, 1)
, 1% /
% % 0
% % 0
it it i t i t
it it it
it it it
p p p p
p p if p
p p if p
− −
+
−
∆ = −
∆ = ∆ ∆ > ∆ = ∆ < ∆ (8)
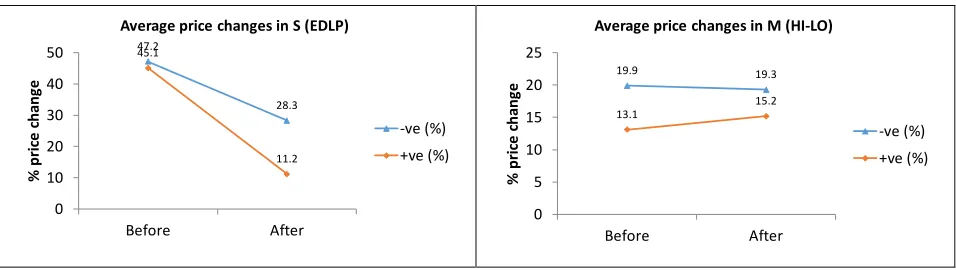
The estimation results are given in Table 7. For store S (EDLP), the average price reductions
decrease from 47.2% before ESL to 28.3% after ESL. At the same time, the average price
increases also decrease from 45.1% before ESL to 11.2% after ESL. So, there seems to be
overall, lesser magnitude of price changes after ESL. Indeed the average magnitude of price
changes decrease from 45.3% before ESL to 11.7% after ESL. In contrast, for store M (HI-LO),
the average price reductions are almost unchanged between 19.9% before ESL to 19.3% after
ESL. However, average price increases marginally increase from 13.1% to 15.2%. Overall, the
magnitude of average price changes go up from 14.9% to 16.3%, a modest increase. We
summarize the price changes in Figure 2.
Impact of ESL on Price Discovery
One of the key presumed advantages of ESL is that it gives the retailer the ability to change
prices more readily than it can with paper labels. A corollary of this is that retailer may be better
positioned to set prices based on more current information. As the business environment
changes, the retailer faces the challenge of not only interpreting and analyzing such changes to
decide whether and how those should impact its prices, but also implement changes should that
be needed. The retailer’s analyses of current information can happen in multiple ways. While it
can use existing models, routines and heuristics to map the information to its pricing choices, it
product mix combine in a given situation to affect its revenue outcomes. The combination of
these efforts and a consideration of any of several possible objectives such as maximizing
revenue, traffic, market shares, gross margins etc., inform the retailer’s decisions on what prices
to choose. We call this exercise “price discovery” by the retailer.
In the absence of direct observation and access to retail decision makers, it is difficult to
impute these activities from POS data. However, one of the implications of ESL is that, not only
can the retailer implement price changes easily, but knowing that, the retailer is also more likely
to engage in more frequent and current price discovery. This would then reflect in the post-ESL
prices incorporating more contemporaneous information than the pre-ESL prices. To explore
this possibility, we use a general autoregressive model specification on unit prices and estimate
the maximum duration of lagged impact for model fit. ESL driven price discovery would
suggest that the duration of such lagged impact would be shorter in the post ESL sample since it
would have used more current information.
( )
, ,(
,)
, 1ln ln
r
i t i k i t k i t
k
p α β p − ε
=
= +
∑
+ (9)For each product, we estimate the maximum lag r as being the higher of the two criteria: AIC
(Akaike’s Information Criterion) and SBIC (Schwarz‘s Bayesian Information Criterion). We are
able to do this analysis only for store M (HI-LO) since store S (EDLP) did not have sufficient
price changes to estimate the parameters. We find that the average lag after ESL (2.13 weeks) is
significantly smaller than the average lag before ESL (3.21). This is consistent with more
efficient price discovery discussed here.9
Summary of Results
Our results span two levels of comparisons – first between pre-ESL and post-ESL outcomes,
which is the direct impact of ESL; the second is between the two stores through the lens of retail
strategy (EDLP and HI-LO). Our estimations comprise prices, quantity sold, gross revenues,
price sensitivity, price adjustments and price discovery.
We find that the impact of ESL on average price levels is not to decrease prices. Rather, we
find an increase of 13% for store S (EDLP) and no significant change for store M (HI-LO). On
the other hand, ESL results in an increase of quantity sold and gross revenue for both stores – for
store S (EDLP) by 17% and 31%, and for store M (HI-LO) by 8% and 6%, respectively. In
absolute numbers, these are very significant levels of impact on sales volume and revenues –
without lowering prices. So, this must be due to something more than just cost efficiencies.}
For price sensitivity, we find the impact of ESL is quite different for the two stores. While
ESL makes demand more price sensitive for store S (EDLP) it makes demand less price sensitive
for store M (HI-LO). Similarly, there are differences between pre- and post-ESL price
adjustments between the two stores. For store S (EDLP), ESL appears to dampen large price
changes – the magnitude of average price reductions decrease from 47.2% to 28.3%, while
average price increases reduce from 45.1% to 11.2%. For store M (HI-LO), on the other hand,
ESL does not appear to affect average price reductions with no change between the pre- and
post-ESL price reduction magnitudes. However, there is a small amplification of price increases
from 13.1% to 15.2%.
The findings related to price level, sensitivity and price changes are significant. Recall that
one of the applications of ESL for store S (EDLP) was to better manage wastage of perishables.
Traditionally end of the day deep discounts (“fire sale”) were used to clear the inventory. It
appears that the ESL allows the retailer to use smaller price reductions to achieve such inventory
clearance, as reflected in the higher average price levels and price sensitivity post-ESL. The
smaller price reductions should directly contribute to the retailer’s bottom line.
In contrast, recall that one of the applications of ESL for store M (HI-LO) was to offer greater
value to its customers through the provision of relevant information. It appears that the store is
able to do that – its customers are less price sensitive in the post-ESL period, which would be
expected if price is no more the key criterion for purchase decisions. If customers were to give
more relative weight to the information and the other non-price related sources of value offered
by ESL in making purchase decisions, it lessens the price pressure faced by the retailer.
Consistent with this, it also appears that the retailer is able to sustain higher price increases,
albeit by smaller amounts than the EDLP store, and albeit the aggregate price increase is not
statistically significant.
With respect to price discovery, we cannot compare the two stores since we are only able to
estimate it for store M (HI-LO). We estimate a significantly lesser lag in the extent to which its
prices depend on past prices – 2.13 weeks for the post-ESL prices compared to 3.21 weeks for its
efficiencies of discovery, experimentation and learning, thereby responding to more cognate
relevant information in their price optimization efforts. Indeed, store M (HI-LO) seems to use
information that is more current, in setting its prices, in the post-ESL period.
In essence, ESL seems to allow the EDLP store achieve better pricing consistency by
dampening its price changes. On the other hand, ESL seems to allow the HI-LO store to
emphasize the non-price value and shift the consumer from narrowly focussing on price. Both
these outcomes seem to match the strategic imperatives of the respective stores.
6. DISCUSSION
Substantively, our main effort here is to understand how an emerging retail technology, ESL,
affects retail outcomes. Our data comes from a field implementation of the ESL technology,
covering almost two years around the installation date. The “field” aspect of the design brings
with it some benefits of external validity. Further, given our experimental design with distinct
treatment and control groups, as well as the longitudinal Difference-in-Difference (DID) model
used in the analyses, we are able to draw “causal” inferences with greater certainty.
Much of the causal inferences we are able to draw point to one primary conclusion – ESL can
be used to engage in better pricing practices, which in turn drives better retail outcomes. In
concluding this, we implicitly characterize “better pricing” as being intimately tied to retail
strategy, such that, it is the better fit between strategy and implementation of pricing that makes
the pricing better, and which drives retail outcomes like superior sales and revenue. Thus,
“better outcomes” are not pre-ordained as immutable characteristics of ESL systems. Rather, the
key issue seems to be whether characteristics of ESL allow retailers to better implement their
pricing tactics to support their idiosyncratic retail strategy. Thus, ESL has shades of a strategic
capability for retailers. At the same time, ESL’s promise to reduce menu costs and its attendant
implication for price rigidity has a direct bearing on how we interpret the technology and its
impact from a policy perspective. We frame our subsequent discussions through these twin
lenses – strategy and policy.
ESL as a Dynamic Capability: Best Practices Strategy Enabler
ESL systems are big-ticket expenses by the retailer – of the order of a couple of hundred
thousand dollars for one supermarket store – representing a significant investment for a
ROI from such strategic investments. On this, our results appear to bring good news for retail
managers, that ESL can significantly enhance retail sales volumes and revenue, two key
traditional measures of retail performance. There seem to be at least four related ways these
advantages of ESL accrue: reduction in menu costs, greater efficiency in waste management,
providing greater value to consumers and better price discovery. However, the key takeaway
from our results is that ESL acts as an enabling technology for the retailers – facilitating the
implementation of their idiosyncratic store positioning strategies to create and claim value.
For the EDLP store, the key impact of ESL is felt in its ability to dampen the end of the day
“fire sale” nature of price cuts necessitated by unsold inventory of perishable produce. With an
ability to readily adjust prices and find the “sweet spot”, the EDLP store is able to achieve a
lower level of aggregate price cuts (and hence a smaller range to which price goes back up after
the promotion) to clear the same level of inventory as before the implementation of ESL. This
reflects in the higher aggregate price sensitivity of demand in the post-ESL period.
For the HI-LO store, the key impact of ESL appears to be in its ability to offer greater value to
its customers in the form of better product related information. In this, the store effectively
reduces the centrality of price in the consumer decisions, which reflects in the lower aggregate
price sensitivity of demand achieved in the post-ESL period. For the store, finding this sweet
spot between value and price point is an onerous task. To this end, we find evidence that the
store engages in more price optimization and discovery in the post-ESL period.
The idea that ESL enables retailers effectively integrate their pricing, inventory and marketing
resources to better implement their positioning strategies indicate ESL enhances the competitive
advantages for the retailer, and as such, it has the dimensions of a strategic capability. In
particular, given that ESL allows the retailer to make quick adjustments in response to changes in
its business environment, be it competition, demand or supply conditions, it is a dynamic
capability as envisaged by Eisenhardt and Martin (2000).
Eisenhardt and Martin’s (2000) view of dynamic capability sought to demarcate boundaries
between “best practices” and dynamic capabilities that impart competitive advantage, sustainable
or not. While ESL could be seen as a “best practice” across the industry and any retailer could
invest in ESL, there would be idiosyncratic differences in the manner different retailers would
use the technology to integrate its existing resources to implement their specific strategies. In
management efficiencies. At the core of this outcome was that ESL enabled the EDLP store
converge on a narrower band of price changes that would effectively limit their end-of-the day
inventory of unsold perishable produce. The HI-LO store, on the other hand, combined product
information and pricing to achieve better value extraction. At the core of this outcome was that
ESL enabled the HI-LO store to communicate more effectively with their customers while
engaging in more effective price discovery.
The lesson from the above in our retail context is that the right strategy per se does not
necessarily yield competitive advantage. Effective implementation of that strategy is crucial. In
circumstances where the implementation itself may be too costly, the retailer will not derive any
advantage from its strategy. However, technologies like ESL may allow retailers to achieve both
operational efficiencies as well as enhance value extracted from its customer transactions,
thereby yielding a strategic dividend on their investments.
Several past papers allude to the potential of ESL enabling strategic capabilities of the retailer
(cf. Dutta, et al. 2003; Levy et al. 1997; Zbaracki et al. 2004; Ray et al. 2006; Bergen et al.
2008). However, to the best of our knowledge, this is the first study to offer direct evidence of
its strategic impact.
ESL through a Policy Lens: Menu Cost Saver
While we illustrate the strategic value of ESL in the earlier discussions, from a policy lens, the
impact of ESL is nuanced. An explicit function of ESLs, as argued in earlier literature, has been
that it reduces menu costs, which are the direct or physical component of the retailer’s total price
adjustment costs (Levy et al. 1997). The associated menu cost theories in the monetary policy
literature (Barro 1972, Sheshinski and Weiss 1977, Mankiw 1985, Ball and Mankiw 1994)
suggest that such lower menu costs would make prices less rigid. In fact, several jurisdictions
specifically incorporate menu cost savings as considerations in enacting their pricing policies
(see Bergen et al. 2008 with respect to Item Pricing Law). Our results illustrate that this policy
impact also depends on retailer strategy.
Whereas, ESL enables the EDLP store to achieve greater pricing consistency by allowing
them to dampen the magnitude of price changes, it works differently for the HI-LO store. For
the latter, ESL appears to enable the retailer extract greater value by effectively lowering the
the policy impact of the ESL technology appears to be ordered by the prevalent retail strategy.
This builds on an emerging literature in marketing, which explores how the extent of variation in
micro-level price rigidity could be strategic in nature (Ray et al. 2006; 2012).
Managerial Implications
The immediate managerial implications of our results pertain to the cost-benefit calculus
facing the retailer tasked with the decision to implement ESL. Our results show that traditional
efficiency arguments related to operational cost savings (e.g. menu costs) are conservative. A
key benefit associated with ESL in our data is that of yielding strategic dividend. In other words,
the large investments needed to implement ESL must be measured against its potential to
generate and claim transactional value, as well.
At the same time, it is important to note that while different retailers interested in gaining
market advantage may adopt the ESL technology as industry “best practices,” the key to
generating competitive advantage is to deploy ESL in combination with the retailer’s other
strategic resources. Thus, the retailer must identify the short-term and long-term benefits as it
engages with the ESL technology. In the short run, the retailer can save in menu costs.
However, these “plug and play” benefits of ESL are not likely to bear competitive advantage for
long. To achieve the long run benefits of better pricing and effective communications, the
retailer must actively engage in a phase of learning and experimentation. It is through these
options and opportunities that the retailer may realize the idiosyncratic benefits of ESL in the <