Available online:
http://edupediapublications.org/journals/index.php/IJR/
P a g e | 1653Mitigation of Disturbances on Load Side using UPQC in an
AC Microgrid
B Rajendra Prasad Tenali & V.S.Vakula
1
Research Scholar, Dept. of Electrical and Electronics Engg JNTUK, Kakinada
2
Asst. Professor, Dept. of Electrical and Electronics Engg JNTUK- University College of Engineering
Vizianagaram Campus, Vizianagaram
E-mail:
1[email protected],
2[email protected]
Abstract:
The importance of Microgrid concept is increasing extensively and more number of microgrids will be installed at consumer premises in the coming future. The penetration of distributed generation (DG) units consisting different loads makes microgrids suffer from power quality and power control issues. Some of them are voltage stability, swells and sags, and power factor improvement which require reactive power. In particular, microgrid in islanded mode has to maintain the power balance independently of a main grid due to lack of infinite bus as generation and consumption are tightly coupled. Due to versatile loading conditions, even in grid connected mode reactive power compensation is becoming a challenging task. Hence the key objective of this paper is to investigate reactive power compensation in microgrids. In this regard, new techniques and devices for VAR compensation in the micro grid are being investigated. The device considered in this paper is Unified Power Quality Conditioner (UPQC). Initially UPQC is modeled, simulated and tested in conventional distribution power system. Later the same is incorporated into the microgrid. The microgrid is developed with two DG units, a PV generator and a wind generator to give an output voltage equal to the conventional 3 phase 4 wire distribution system. The performance of the UPQC with its control technique in providing the reactive power compensation to resolve the power quality issues in microgrid with dynamically varying load is examined.
Keywords—Microgrid; Voltage sag; Voltage swell; UPQC
I. Introduction
Electrical power system has been experiencing critical changes in the most recent years. It is predicted that these progressions will mark an evolution of concepts and practices for the entire power system industry in a not so distant future, particularly concerning planning and operational systems. With the augmentation in a dangerous atmospheric deviation like global warming,
renewable energy based distributed generators (DGs) will take a common part in power generation.
Distributed generation based on solar energy (photo voltaic and solar thermal), wind, biomass, mini-hydro along with use of fuel cells and micro turbines will gain significant momentum in the near future. A microgrid is a small-scale power supply network mainly based on renewable energy sources combined with power electronic system is designed to provide power supply for a small community [1]. It comprises of clusters of load and distributed generators that work as a solitary controllable framework. The microgrid can be operated in two modes: the Grid connected mode where the microgrid exchanges power with the conventional power grid and the Islanded mode where the microgrid is operated independent of the conventional grid to serve the power requirement of a small community /island [2]. The interconnection of the DG to the utility grid through power electronic converters has outstretched concern about safe operating and production conditions of the equipment. A microgrid system comprises of Distributed Energy Resources (DERs) such as photovoltaic, wind and solar cell generators, immediate energy storage, loads, and controller with power electronic converters and Point of Common Coupling (PCC) where microgrid is coupled to the power distribution system.
Power electronic based equipment are rapidly emerging as key components in the present modern distributed generation power systems. Power processing utilizing these devices offer vast advantages such as flexible control, cost reduction, overall size optimization, etc. On the other hand, operation of these devices gives rise to some of the serious power quality problems such as the Reactive Power Compensation (RPC) requirement and generation of harmonics that pollutes the power distribution systems. The microgrid power quality problems comprise of wide range of disturbances such as voltage harmonics, voltage sag, voltage swell, voltage unbalance, voltage flicker, current harmonics, load reactive power, current unbalance, neutral current, impulse transients and interruptions [3]. Voltage sags usually occur at any instant in an event of disturbance, with amplitude ranging from 10-90% and a duration lasting for half a cycle to one minute [4].
Available online:
http://edupediapublications.org/journals/index.php/IJR/
P a g e | 1654 between 1.1 and 1.8 rise [4-6]. Active power filters arewidely used to tackle some of these important power quality problems. Recent trends are geared towards the realization of multi-tasking devices which can handle several power quality problems simultaneously. The Unified Power Quality Conditioner
(UPQC) is one of the most versatile active power filters that can compensate the fore mentioned significant power quality issues.
The existing literature suggests the importance of UPQC to deal with several power quality issues especially towards distribution system. Hence UPQC is considered in this work to mitigate supply and load side disturbances in microgrid. A comprehensive overview by enhancing electric power quality using UPQC was given by Khadem et.al. [7]. Integration of UPQC for power quality improvement in distributed generation network was introduced in [8]. Electric power quality improvement using UPQC was given with power angle control in [9]. Different modeling aspects and energy systems of UPQC were discussed in [10]. A new 3 phase 4 wire topology for distribution system using UPQC has been proposed in [11] to compensate the different power quality problems that plays an important role in future UPQC-based distribution system. An Advanced Universal Power Quality Conditioning System (AUPQS) to interface photovoltaic systems to a power grid, was suggested in [12] at the load side to regulate the AUPQS DC-link voltage when the photovoltaic system is interrupted along with the suppression of grid-end current harmonics and distortions comprising unbalanced and non-linear load conditions. An improved controller for the 978-1-5090-0128-6/16/$31.00
©2016 IEEE double topology of the unified power quality
conditioner (iUPQC) was proposed in [13] by extending reactive power support, including voltage sag/swell compensation, to regulate not only the load-bus voltage but also the voltage at the grid side bus beyond the conventional UPQC power quality features. From various features of UPQC in providing effective compensation and in solving other power quality problems, in conventional distribution systems, UPQC is considered in this paper to provide reactive power compensation in microgrids. This paper is sectionalized as follows. Section II gives structure of microgrid, Section III provides Unified Power Quality Conditioner, Section IV provides the simulation results using MATLAB/SIMULINK for RPC in conventional distribution system and in MG and compares the effectiveness of these custom power devices in the system.
II. Microgrid Structure
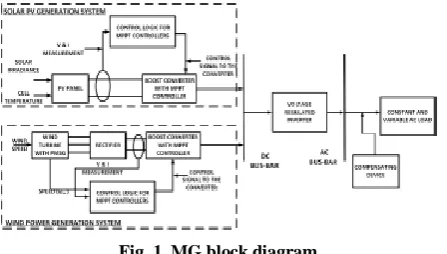
A system containing a microgrid with two DERs along with a battery storage connected to a common AC reference as shown in the Fig. 1 is considered. The AC bus which acts as a source delivers the loads (resistive, inductive and capacitive). The simulations are carried and
validated using the equivalent parameters that are extracted from the data sheet [14].
Fig. 1. MG block diagram
A. Microgrid Modeling
A microgrid containing two DERs is constructed with one wind generation source and the other one with a PV generation source, along with a storage device. The block diagram of microgrid is shown in the Fig. 1 and the basic modeling equation of each DER is mentioned below. 1) Modeling of PV modules in microgrid: A PV cell is considered based on two-diode model in the construction of MG. The mathematical model of two-diode PV cell is observed with improved performance when compared with the other various prototypes of PV cell based on single-diode model and also for lower illumination levels [14]. The PV cell with two diode equivalent model voltage and current relation is given in (1).
(1)
where, Is1, Is2 are the reverse saturation currents of the two diodes Vt is the module thermal voltage ,Photo-generated current is IPH , N1, N2 are the quality factors of the two diodes D1, D2 used in the two diode model, and
Rs , Rp are series and shunt resistances. Based on (1) a two-diode model is developed with equation based implementation in MATLAB, Simulink.
Available online:
http://edupediapublications.org/journals/index.php/IJR/
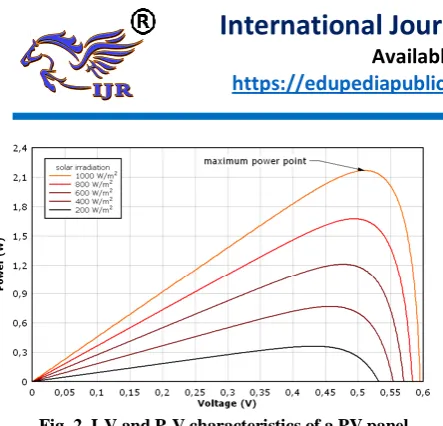
P a g e | 1655Fig. 2. I-V and P-V characteristics of a PV panel
The power rating of modelled PV generator is 3 KW with 14 number of panels. The duty cycle of the boost converter is controlled by MPPT algorithm i.e. Perturb and Observe (P&O).
i. Modeling of Wind generator in microgrid
A wind generator with Permanent Magnet Synchronous Generator (PMSG) is considered as the second DER in the construction of MG. The wind turbine output power [15] is given by (2)
𝑃𝑜= 1
2𝜌𝐴𝑉𝑤𝑖𝑛𝑑
3 𝐶
𝑝(𝜆, 𝜃) (2)
where Po represents the output mechanical power of the turbine, Cp represents the turbine power coefficient , λ
represents the rotor blades tip speed ratio, θ represents the blade pitch angle, ρ represents the air density, A represents the sweeping area of turbine, Vwind represents the wind speed . In the dynamic modeling and Simulink implementation of wind turbine the parameters values are R = 1.25 m, length of blade L = 2.5 m, A= 6.25 m2, ρ = 1.225 kg/m2.
Fig. 3. MPPT controller for PV and wind generators
To keep the output voltage constant at desired voltage, a MPPT controlled boost converter is implemented as shown in Fig. 4. The duty cycle of the boost converter is controlled by MPPT algorithm i.e. Hill Climb Search (HCS). A MG is constructed by using the above two sources and is connected to a common AC bus from which is further delivered to the load.
Due to versatility in the nature of loads connected, RPC requirement in MG is indicated in terms of compensating device as shown in Fig. 1. A compensating device, UPQC is modelled and implemented to provide RPC in MG in the following section.
Fig. 4. UPQC Equivalent circuit and basic modelling equations
III. Unified Power Quality Conditioner
To deal with the power quality problems in the developed MG, UPQC is used as a compensating device in this paper.
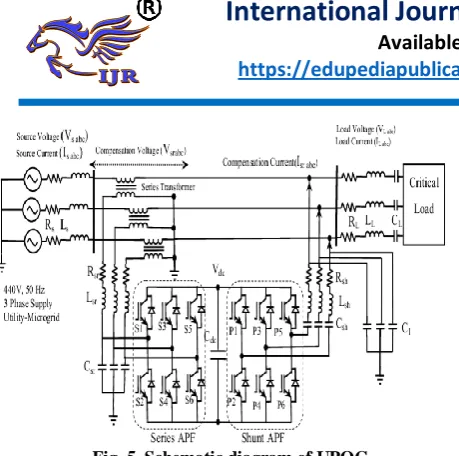
Initially the performance of UPQC is observed in conventional distribution system later the same is applied in MG. UPQC is developed with the combination of series active power filter (APFse) and shunt active power filter (APFsh). Two voltage source inverters (VSIs) are used to function as series and shunt APFs and are realized by using six Insulated Gate Bipolar Transistors (IGBTs) each and are connected to the network by using coupling inductors as shown in Fig. 5. The two APFs are connected back-to-back on the DC side and share a common DC link capacitor, as
shown in Fig. 5. With proper control, the DC link voltage acts as a source for active as well as reactive power. The supply side disturbances such as voltage sags/swells, flickers, voltage unbalance and harmonics are mitigated by the series component of the UPQC, It injects voltage to maintain the supply voltage as balanced and distortion free using its series low pass filter. The shunt component acts for mitigating the current quality problems produced from load side such as low power factor, harmonics in load currents, unbalance in the load etc. by injecting current such that the source currents become balanced and sinusoidal and in phase with the source voltages [8]. The fundamental model is considered in this paper for the UPQC to provide RPC by mitigating sag/swell and also to understand how the active and reactive power flows between source, UPQC and the load. The equivalent circuit and set of its basic modelling equations are given in Fig. 4. The source voltage and source current, load voltage and load current, compensating voltage and current are denoted by Vs, and Is VL, and IL, VC, and IC respectively.
Available online:
http://edupediapublications.org/journals/index.php/IJR/
P a g e | 1656Fig. 5. Schematic diagram of UPQC
UPQC is controlled to ensure that the load voltage is in sinusoidal nature and with reference value. The voltage that is injected by the series side inverter should be equivalent to the deviation of the reference voltage from the actual voltage. Hence PI controller with feedback control scheme is chosen for the UPQC. The injected voltage is developed from the control circuit by implementing forward progression algorithm [4]. The voltage be injected i.e. Vinj by phase angle of series inverter varies from 0° to 360°. A difference in the phase angle of the load voltage from the source voltage exists due to the voltage injected by series inverter. In this paper, the load voltage is supposed to be in phase with the reference voltage irrespective to any variation in the supply voltage. It is due to the fact that the series voltage is injected which may be in phase or phase out w.r.t. the reference voltage, in voltage sag and swell conditions. This provides the flow of real power along the UPQC possibly.
Based on the relative magnitude between reference voltage and actual voltage, the voltage injected from series inverter may be either positive or negative, that means either the real power is absorbed or supplied. Considering reference phasor as the load voltage VL (3) and the load with lagging power factor cos ϕL (4)
𝑉𝐿= 𝑉𝐿< 00 (3)
𝑖𝐿= 𝐼𝐿< −∅𝐿 (4)
𝑣𝑠= 𝑉𝐿(1 + 𝑆𝑓) < 00 (5)
The small case letters for voltages, currents and powers denote the instantaneous values, while the capital letters are used to represent the peak values. In (5), factor sf, is the ratio of magnitude fluctuation of actual voltage to reference voltage which can be defined as (6), 𝑆𝑓=
𝑉𝑠−𝑉𝐿
𝑉𝐿 (6)
The voltage injected by the series inverter is given by (7)
𝑉𝑠𝑒= 𝑉𝐿− 𝑉𝑠= −𝑠𝑓𝑉𝐿< 00 (7)
The UPQC is supposed to be lossless and load active power demand (PL) is equal to the input active power at PCC (PS). UPQC delivers a source current with
unity power factor, for a specified load condition the input active power can be expressed as
𝑃𝑆= 𝑃𝐿 (8)
𝑉𝑆𝐼𝑆= 𝑉𝐿𝐼𝐿cos ∅𝐿 (9)
𝑉𝐿(1 + 𝑠𝑓)𝐼𝑠= 𝑉𝐿𝐼𝐿cos ∅𝐿 (10)
and thus 𝐼𝑠= 𝐼𝐿
1+𝑆𝑓 cos ∅𝐿 (11)
The equation (11) shows that the source current
Is is indirectly proportional to factor sf, since, ϕL, IL give load characteristics and will be generally constant for a particular load type. The active (Pse) and reactive power
(Qse) handled by the series inverter can be expressed as (12), (13) & (14)
𝑃𝑠𝑒= 𝑉𝑠𝑒 𝐼𝑠 cos ∅𝑆 (12)
𝑃𝑠𝑒= −𝑆𝑓𝑉𝐿 𝐼𝑠 cos ∅𝑆 (13)
𝑄𝑠𝑒= 𝑉𝑠𝑒 𝐼𝑠 sin ∅𝑆 (14)
For ϕs = 0, and UPQC power factor is maintained as unity, then active (Pse) and reactive power (Qse) of series inverter can be expressed as
𝑃𝑠𝑒= 𝑉𝑠𝑒 𝐼𝑠= −𝑆𝑓𝑉𝐿𝐼𝑆 (15)
𝑄𝑠𝑒= 0 (16)
Thus the series inverter of UPQC controls the active power. Whereas the shunt inverter produces the current (ish). It is the difference between the input source current (after compensation) and the load current, which includes the load harmonics current and the reactive current. Thus (ish) is defined as
𝑖𝑠ℎ= 𝑖𝑠− 𝑖𝐿 (17)
𝑖𝑠ℎ= 𝐼𝑠< 0 − 𝐼𝐿< −∅𝐿 (18)
𝑖𝑠ℎ= 𝐼𝑠− 𝐼𝐿(cos ∅𝐿− 𝑗 sin ∅𝐿) (19) 𝑖𝑠ℎ= (𝐼𝑠− 𝐼𝐿cos ∅𝐿) + 𝑗𝐼𝐿sin ∅𝐿= 𝐼𝑠ℎ< ∅𝑠ℎ(20)
ϕsh represents the phase angle of shunt current injected w.r.t the source voltage (20). The active (Psh) (21) and reactive power (Qsh) (22) handled by the shunt inverter can be expressed as
𝑃𝑠𝑒= 𝑉𝐿 𝐼𝑠ℎcos ∅𝑠ℎ= 𝑉𝐿(𝐼𝑆− 𝐼𝐿cos ∅𝐿) (21) 𝑄𝑠ℎ= 𝑉𝐿 𝐼𝑠ℎ sin ∅𝑠ℎ= 𝑉𝐿 𝐼𝐿 sin ∅𝐿 (22)
The possible modes of active and reactive power flow between source, load and UPQC based on the above equations are explained below in detail.
A. Active, reactive power flows during normal operating condition
Under the normal working condition (VS=VL), sf = 0. UPQC does not exchange any active power in this condition. If the UPQC is not connected in the circuit, QL
Available online:
http://edupediapublications.org/journals/index.php/IJR/
P a g e | 1657 now provided by QSh. Thus the reactive power burden onthe source is zero. In this case, the series inverter is not involved to take any active part in supplying load reactive power. The power flows (P & Q) during the normal working condition is shown in Fig. 6.
Fig. 6. Active, reactive power flows during normal operating condition
B. Active, reactive power flows during voltage sag
If supply voltage sag is observed then sf < 0, i.e.
VS < VL, from the equations (6) and (15) PSe will become positive. It implies that series inverter will be supplying the active power to the load. i.e., Is > IL. The flow of active power starts from the source to shunt inverter, later from the shunt inverter to series inverter via the DC link, and finally from the series inverter to the load. In such cases P′sh absorbed (23) is equal to P′ se (24) to keep DC link voltage constant. The active and reactive power flow during sag is shown in Fig. 7. P′ s is the power supplied by the source to the load voltage, P′sh is the power absorbed by the shunt inverter, P′se is the power injected by the series inverter during voltage sag condition.
𝑃𝑠ℎ′ = 𝑃𝑠𝑒′ (23)
𝑃𝑠=𝑃𝑠ℎ′ + 𝑃𝑠𝑒′ = 𝑃𝐿 (24)
Fig. 7. Flow of Active and reactive power during voltage sag
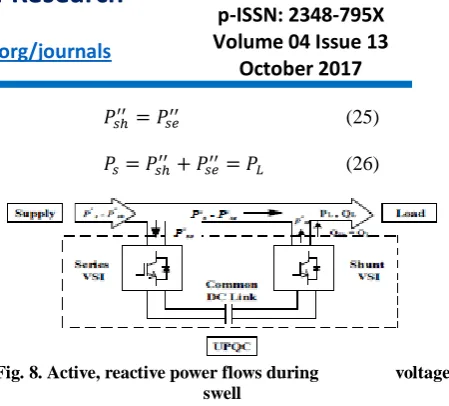
C. Active, reactive power flows during voltage swell In voltage swell, sf > 0, i.e. VS > VL and PSe will be negative. This means series inverter is absorbing the extra real power from the source (26). i.e., Is < IL. i.e., the extra power will be fed back by UPQC to the supply system. The active reactive power flow during swell is shown in Fig. 8. P"s is the power supplied by the source to the load voltage during voltage swell condition, P"sh is the power delivered by the shunt inverter during voltage swell condition (25), P"se is the power injected by the series inverter during voltage swell condition.
𝑃𝑠ℎ′′ = 𝑃𝑠𝑒′′ (25)
𝑃𝑠=𝑃𝑠ℎ′′ + 𝑃𝑠𝑒′′= 𝑃𝐿 (26)
Fig. 8. Active, reactive power flows during voltage swell
The detailed schematic diagram of UPQC is given in Fig. 5. The phasor representation of the above cases are shown in Fig. 9(a) to Fig. 9(f) represents the loads with inductive and capacitive nature. Fig. 9(a) gives the normal operating condition, with the source voltage VS
as a reference phasor. ϕL is angle of lagging load power factor angle. In this condition IS is equal to the IL without compensation. Phasor in Fig. 9(b) gives the normal working condition at with leading power factor of the load. The phasor representation of supply voltage sag and swell for different load conditions are represented from Fig. 9(c) to Fig. 9(f) respectively.
IV. Simulation and Results
A conventional distribution system is considered with actual reference voltage of 415V and maximum phase to ground voltage of 339 V as shown in Fig. 9(a). A supply disturbance to reduce & increase its peak value by 87.5V to create both sag and swell is given and observed for the duration from 0.2 to 0.5 sec, this further disturbs the load voltage in the similar way, when UPQC is not connected into the system as shown in Fig. 9(b) and 9(c). Injected voltage in sag/swell condition using UPQC is shown in Fig. 9(d) & Fig. 9(e) When the UPQC is connected based on the model as shown in Fig. 5, the voltage sag and swell due to supply disturbance are compensated and the distribution load voltage is raised to its normal value as shown in Fig. 9(f).
Available online:
http://edupediapublications.org/journals/index.php/IJR/
P a g e | 1658Fig. 9. Conventional distribution system results (a) Reference voltage (b) Sag in supply voltage (c) Swell in supply voltage
(d) Injected voltage in sag (e) Injected voltage in swell (f) voltage at load end after injection of UPQC
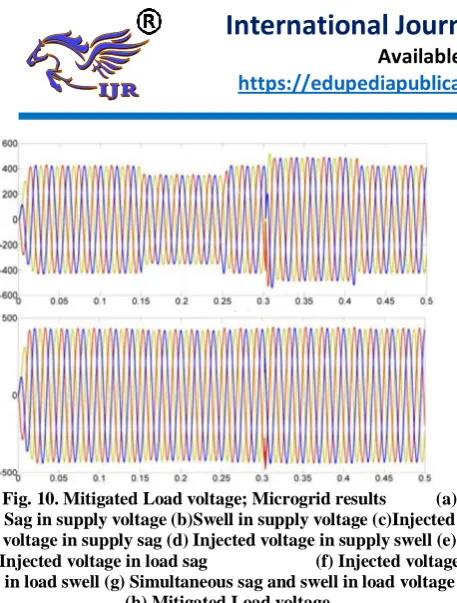
A microgrid model shown in Fig. 1 is developed with 2 DERS, a PV generator and a wind generator. The modeled and simulated MG delivers an output voltage of 415V RMS, which is at common AC bus in MATLAB/Simulink as shown in Fig. 10(a). The same supply disturbance that is created in conventional DS is given and observed for the duration from 0.1 to 0.3 sec, as shown in Fig. 10(b) and 10(c). Injected voltage in sag/swell condition using UPQC is shown in Fig. 10(d) and 10(e). When the UPQC is connected based on the model as shown in Fig. 5 to the MG, the voltage sag and swell due to MG supply disturbance are compensated and the distribution load voltage is raised to its normal value as shown in Fig. 9(a). Inductive and capacitive loads that
create sag and swell are connected and observed in the microgrid based on the model shown in Fig. 3. Now the MG with actual reference voltage as shown in Fig. 10(a) is connected to deliver these loads. Both sag and swell conditions are observed in the MG for the duration from 0.1 to 0.3 sec that disturbs the load voltage, when UPQC is not connected into the system as shown in Fig. 10(f) and 10(g).
Fig. 10(g). When the UPQC is connected, the voltage sag, swell, simultaneous sag and swell in MG due to different loads are compensated and the distribution load voltage is raised to its normal value as shown in Fig. 10(h). Sag, swell and simultaneous sag and swell in load voltage caused by reactive loads are compensated by using UPQC.
Available online:
http://edupediapublications.org/journals/index.php/IJR/
P a g e | 1659Fig. 10. Mitigated Load voltage; Microgrid results (a) Sag in supply voltage (b)Swell in supply voltage (c)Injected voltage in supply sag (d) Injected voltage in supply swell (e) Injected voltage in load sag (f) Injected voltage
in load swell (g) Simultaneous sag and swell in load voltage (h) Mitigated Load voltage.
V. Conclusion
The performance of UPQC is modelled in providing the reactive power compensation to resolve the power quality issues in conventional distribution system. The performance of the UPQC with dynamically varying load is observed. The device is very effective to provide the compensation and is able to mitigate both the supply side and load side disturbances. UPQC is also applied in microgrid to mitigate supply and load side disturbances. A microgrid has been modeled and developed consisting of PV and Wind generators. UPQC in microgrid is also modeled and simulated. The simulations show that UPQC is able to mitigate the supply side disturbances easily using its series converter while shunt converter is providing load side compensation by mitigating disturbances like sag, swell, simultaneous sag and swell.
References
[1] T. Ackermann, G. Andersson, and L. Söder, “Distributed generation: A definition,” IEEE Transl.J. Electr.Power Syst. Res., vol. 57, pp. 195–204, 2001. [2] R. Majumder and E. Engineering, “Modelling, Stability Analysis and Control of Microgrid,” Ph.D.Dissertation, school of energy systems, Queensland University of Technology, Queensland, Australia, February, 2010.
[3] N.G. Hingorani, “Introducing Custom Power,” IEEE Spectrum, Vol.32, pp. 4l-48, 1995.
[4] P. Boonchiam, and N. Mithulananthan, “Understanding of Dynamic Voltage Restorers through
MATLAB Simulation,” Thammasat Int. J. Sc. Tech., Vol. 11, No. 3, July-Sept 2006.
[5] IEEE Std. 1159 – 1995, “Recommended Practice for Monitoring Electric Power Quality,” 1995..
[6] A. Ghosh, and G. Ledwich, “Power Quality Enhancement Using Custom Power Devices,” Kluwer Academic Publishers, 2002.
[7] M. S. K. Khadem, M. Basu, and M. F. Conlon, “UPQC for Power Quality Improvement in DG Integrated Smart Grid Network – A Review,” Int. J. Emerg. Electr. Power Syst., vol. 13, no. 1, Jan. 2012.
[8] V. Khadkikar, “Enhancing Electric Power Quality Using UPQC : A Comprehensive Overview,” IEEE Transaction on Power Electronics, vol. 27, no. 5, pp. 2284–2297, 2012.
[9] K. Palanisamy, D. P. Kothari, M. K. Mishra, S. Meikandashivam, and I. Jacob Raglend, “Effective utilization of unified power quality conditioner for interconnecting PV modules with grid using power angle control method,” Int. J. Electr. Power Energy Syst., vol. 48, pp. 131–138, Jun. 2013.
[10] P. Deshpande, A. Shrivastava, and A. Khare, “Different Modeling Aspects and Energy Systems of Unified Power Quality Conditioner(UPQC): An Overview,” Int. J. Renewable Energy Research, vol. 3, no. 2, pp.395-402, 2013.
[11] B. S. Kumar and K. V. Kumar, “A Structure for Three-Phase Four- Wire Distribution System Utilizing Unified Power Quality Conditioner,” Int. J. Engg. Research and Appl. vol. 4, no. 2, pp. 27–33, Feb. 2014. [12] B. Rahmani, W. Li, and G. Liu, “An Advanced Universal Power Quality Conditioning System and MPPT method for grid integration of photovoltaic systems,” Int. J. Electr. Power Energy Syst., vol. 69, pp. 76–84, Jul. 2015.
[13] B. W. França, S. Member, L. F. Silva, M. A. Aredes, and M. Aredes, “An Improved iUPQC Controller to Provide Additional Grid-Voltage Regulation as a STATCOM,” Int. J. Industrial Electronics, vol. 62, no. 3, pp. 1345–1352, 2015.
[14] Pavan Kumar, A.V., Parimi, A.M., Rao, K.U., "Implementation of MPPT control using fuzzy logic in solar-wind hybrid power system," 2015, IEEE International Conference on Signal Processing, Informatics, Communication and Energy Systems (SPICES), pp.1-5, 19-21, Feb. 2015.
[15] Pavan Kumar, A.V., Parimi, A.M., Rao, K.U., "Investigation of small PMSG based wind turbine for variable wind speed," International Conference in Recent Developments in Control, Automation and