KSU Proceedings on Cybersecurity Education, Research and Practice
2016 KSU Conference on Cybersecurity Education, Research and Practice
Semi-Supervised Deep Neural Network for
Network Intrusion Detection
Mutahir Nadeem
Roanoke College, [email protected]
Ochaun Marshall
University of North Carolina at Greensboro, [email protected]
Sarbjit Singh
North Carolina A & T State University, [email protected]
Xing Fang
Illinois State University, [email protected]
Xiaohong Yuan
North Carolina A & T State University, [email protected]
Follow this and additional works at:https://digitalcommons.kennesaw.edu/ccerp
Part of theInformation Security Commons,Management Information Systems Commons, and theTechnology and Innovation Commons
This Event is brought to you for free and open access by the Conferences, Workshops, and Lectures at DigitalCommons@Kennesaw State University. It has been accepted for inclusion in KSU Proceedings on Cybersecurity Education, Research and Practice by an authorized administrator of
Nadeem, Mutahir; Marshall, Ochaun; Singh, Sarbjit; Fang, Xing; and Yuan, Xiaohong, "Semi-Supervised Deep Neural Network for Network Intrusion Detection" (2016).KSU Proceedings on Cybersecurity Education, Research and Practice. 2.
computer systems, network data needs to be analyzed so that possible network intrusions can be detected. Supervised machine learning methods achieve high accuracy at classifying network data as normal or
malicious, but they require the availability of fully labeled data. The recently developed ladder network, which combines neural networks with unsupervised learning, shows promise in achieving a high accuracy while only requiring a small number of labeled examples. We applied the ladder network to classifying network data using the Third International Knowledge Discovery and Data Mining Tools Competition dataset (KDD 1999). Our experiments, show the ladder network was able to achieve similar results compared to supervised classifiers while using a limited number of labeled samples.
Disciplines
1.
INTRODUCTION
Network security is essential to corporations as intrusions can result in massive monetary losses. According to a report by the Ponemon Institute, which sampled 252 companies in 7 countries, the U.S. continues to rank highest in its cost of cybercrime at an annual average of $15.4 million per company (Ponemon Institute, 2015). Current Intrusion Detection Systems (IDS) are either signature based or anomaly based. Signature based detection methods require the attack to be documented beforehand, thus new types of attacks that are not yet documented cannot be detected. Anomaly based detection methods focus on finding unknown or unusual activity patterns in the observed data (Holtsnider & Jaffe, 2010). They allow new attacks to be discovered, however a domain expert is required to analyze the anomalies.
Network data has been classified by a host of machine learning techniques. Among the literature we reviewed included the work of Jadidi et al (2013), who used Support Vector Machines (SVM) and flow based data sets to classify network data as benign or malicious. Salama et al. (2011) have used a hybrid intrusion detection scheme utilizing both Support Vector Machines and Deep Belief Networks. Hasan and his colleagues have developed two IDS models: one that uses SVMs and the other that uses the Random Forest Classifier (Hasan, Nasser, Pal, & Ahmad, 2014). Haweliya and Nigam used a semi-supervised Support Vector Machine (SVM) to classify an optimized version of the KDD 1999 dataset (Haweliya & Nigam, 2014).
Though supervised learning methods achieve high accuracy, they require fully labeled data. Acquiring fully labeled data is a nontrivial task as labeling data requires time and a human expert. Thus, learning from unlabeled data is more desirable. Semi-supervised learning is learning with a small amount of labeled data and a large amount of unlabeled data (Zien, Scholkopf, & Chapelle, 2006). Recently, Rasmus et al. (2015) had shown that Ladder Networks, a
semi-supervised neural network scheme, are able to achieve a high classification rate while using only a few labeled samples on the Mixed National Institute of Standards and Technology (MNIST) dataset. In this paper, we use the Ladder Networks to classify the Third International Knowledge Discovery and Data Mining Tools Competition dataset (KDD 1999). Three well studied, supervised classifiers, a Deep Belief Network (DBN), a Support Vector Machine (SVM), and a Random Forest were used to classify KDD 1999. These supervised results serve as a baseline to compare with the Ladder Networks results.
The rest of this paper is organized as follows. Section 2 provides a background on the classifiers: Support Vector Machine, Random Forest, Deep Belief Network and Ladder Network. Section 3 describes our experiments and the results. Related Work is discussed in Section 4 and Section 5 concludes the paper.
2. BACKGROUND
2.1 Support Vector Machine
Support Vector machines are supervised learning models for classifying data. The goal of a SVM is to find the optimum margin that maximizes the distance
between two target classes (Bishop, 2006; Schmidhuber, 2015; Hasan et al., 2014). Essentially, a SVM tries to minimize the error of the distance between each point in each class and a dividing line. This is done by finding the shortest distance between two points in both classes. The line orthogonal to the shortest distance line is the dividing line.
2.2 Random Forest
Random forests are an ensemble of classification or regression trees. The random forest classifier works by partitioning the training set of the data into k subsets and constructing a decision tree out of each subset. All of the subsets are created by randomly selecting samples from the original set. Each decision tree is
independent of all other decision trees.
Each decision tree is made by randomly selecting m variables (features) out of all the variables and finding the best split on the selected variables. The best split is determined by the entropy or unpredictability of the variables. This is done at each node and continued until a node cannot be split further, leading to the leaf nodes. The testing data is then run through each tree and each tree provides a classification. The classifications of all the trees are then taken into account and the final classification of the forest is determined by the majority of the decision trees (Breiman, 2001).
2.3 Deep Belief Neural Network
Artificial Neural Networks (ANN) aim to imitate the biological process of a path of neurons being strengthened in the brain when a skill is learned. An ANN is composed of an input layer which represents the features of the data. The input layer is connected to one or more hidden layers where matrices of weighted connections are used to map the input to the output layer, which consists of the classes of the data. Essentially, a Neural Network learns by updating the matrices of weights until it is able to achieve a high accuracy in mapping the input layer to the output layer. A Deep Belief Neural Network (DBN) is a Neural Network with multiple hidden layers. It can be viewed as a stack of restricted Boltzmann
machine (Hinton, 2009). Boltzmann machines are networks of neuron units that are symmetrically connected. These neuron units make stochastic decisions whether to be on or off (Hinton, 2007). A Boltzmann machine is restricted in that there are no connections between neural units of the same layer (Hinton,
Osindero, & Teh, 2006).
The DBN learns iteratively by updating the weights through the backward propagation algorithm. It works by calculating the net input for each neuron, which is the sum of (inputs * weights) for each connection leading into that neuron (Hecht-Nielsen, 1989). After that, the current output for each neuron is calculated using a logistic function. Then the error is calculated for all neurons. Finally, the error is fed back through the layers and the weights are updated to get a better accuracy.
2.4 Ladder Networks
Ladder Networks can be seen as nested denoising Auto-Encoders (dAE) that share lateral connections between the encoder and decoder at each layer. An auto-encoder tries to learn a classifying function by mapping an input x to an output y. This is prone to over-fitting, which is the classifier having learned the training examples well, but cannot generalize to new data. To avoid over-fitting, noise is introduced, specifically a corrupted version of x is created and the auto-encoder tries to map it to the same y. With Ladder Networks, this happens at each layer, latent variables (variables inferred from observed variables) are used in layers beyond the input layer. Learning is based on minimizing the cost || (ẑ - z) ||2 where
z is the original latent variable and ẑ is the reconstruction of the corrupted version of it. Each layer adds to a cost function for decoder d, Cd (l) = ||z(l) - ẑ(l) ||2 which
trains the layers to learn the denoising function ẑ(l) = g(l) (z̃(l),ẑ(l+1)) which maps
the corrupted z̃(l) onto the estimate without noise, ẑ(l). One of the parts
differentiating Ladder Networks from dAEs are skip connections between the encoder and decoder at each layer that allow some of the details to be represented by the lower layers and the higher ones. An illustration of the architecture of a 3 layer Ladder Network is shown in Figure 1.
In Figure 1, L =3. x → z(l) →z(2) →z(3) → y is the clean feedforward path, x → z̃{(l)} → z̃(2) → z̃(3) → ỹ is the corrupted feedforward path, and ẑ(3) → ẑ(2) → ẑ(1)
→ x̂ is the decoder. The decoder has denoising functions, g{(i)} , and cost
functions, Cd(l), that try to minimize the difference between ẑ(l) and z(l) . See
Rasmus et al., (2015) for more information on Ladder Networks.
3. EXPERIMENTS & RESULTS
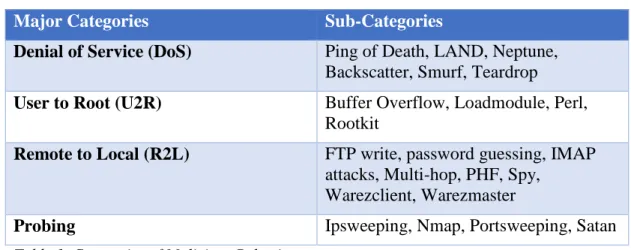
We analyzed the dataset used in the Third International Knowledge Discovery and Data Mining Tools Competition (KDD 1999), held in conjunction with the Fifth International Conference on Knowledge Discovery and Data Mining. The raw training data contains about 4GB of compressed packet capture data from seven weeks of network traffic. This data has been processed into approximately 4.9 million connection records, with a set of 41 features. These features describe various aspects of a particular connection record, such as the service used, protocol, source bytes, and destination bytes (Fiore, Palmieri, Castiglione, & De Santis, 2013). Each sample is labeled as a normal or an abnormal connection. The abnormal connections fall into four main categories with subcategories based on the popular nomenclature of the specific attack at the time (e.g. Ping of Death) (Tavallaee, Bagheri, Lu, & Ghorbani, 2009). Table 1 describes both the categories and subcategories of malicious connections found in the KDD 1999 dataset.
The Random Forest and SVM classifiers were implemented using sci-kit learn (Pedregosa et al., 2011). For both classifiers data was cross-validated using K-fold cross validation (Refaeilzadeh, Tang, & Liu, 2009). Ten folds were used with the test evaluation at the final fold. The DBN was implemented using Theano and Blocks (Theano Development Team, 2016; van Merrënboer et al., 2015). The Ladder Network was implemented using Theano, Blocks and Fuel. Theano is a Python library used in creating and solving mathematical expressions; Blocks allows neural networks to be built on top of Theano; and Fuel provides the datasets to be used in machine learning methods. In order to use the KDD 1999 dataset, the Fuel package for the Ladder Network had to be modified to allow for pre-processing.
Major Categories Sub-Categories
Denial of Service (DoS) Ping of Death, LAND, Neptune, Backscatter, Smurf, Teardrop
User to Root (U2R) Buffer Overflow, Loadmodule, Perl, Rootkit
Remote to Local (R2L) FTP write, password guessing, IMAP attacks, Multi-hop, PHF, Spy,
Warezclient, Warezmaster
Probing Ipsweeping, Nmap, Portsweeping, Satan
Table 1. Categories of Malicious Behavior
3.1 Supervised Classification
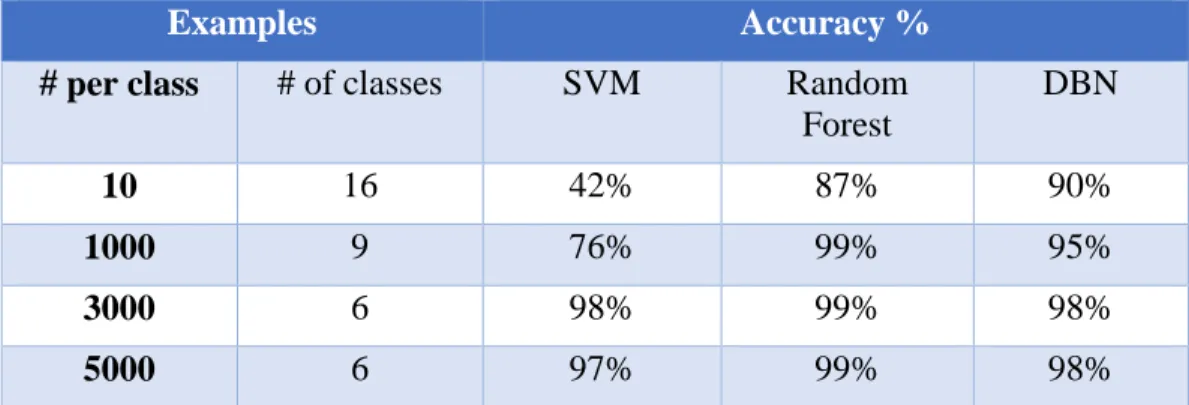
A DBN, a Random Forest classifier, and a SVM classifier were used to analyze the KDD dataset. For each classifier, four tests were run varying the number of examples for each class. The tests were run requiring 10, 1000, 3000, and 5000 examples per class. They correspond to 16, 9, 6, and 6 classes respectively. These classes include one normal class and the rest of the classes belong to
subcategories of attacks. Our experiments differ from Salama et al. (2011) in that they used the four main categories for the abnormal classes. We decided to use the subcategories in order to classify specific types of attacks. Two-thirds of the data was randomly selected for training and the rest for testing. The classification accuracy results are shown in Table 2. The time required for training and testing combined is shown in Table 3.
Examples Accuracy %
# per class # of classes SVM Random Forest DBN 10 16 42% 87% 90% 1000 9 76% 99% 95% 3000 6 98% 99% 98% 5000 6 97% 99% 98%
Table 2. Accuracy of SVM, Random Forest, and DBN classifiers on KDD 1999 data.
Execution Time (sec.)
Examples per class SVM Random Forest DBN 10 .014 1.832 13.2 1000 8.488 5.745 205.2 3000 14.01 8.717 399.6 5000 30.784 14.47 639.0
Table 3. Time needed for runs of supervised classifiers (in seconds)
The Random Forest classifier achieves a high accuracy on the second to fourth tests and does so in the shortest time. The DBN has fairly high accuracy for each test, when it is run for 1000 epochs with two hidden layers of 150 nodes each. However, compared with the other two methods, the DBN takes the longest time.
3.2 Semi-Supervised Classification
Two experiments were performed using Ladder Networks to classify the KDD 1999 dataset. In the first experiment, four tests varying the number of examples required for each class, i.e. 10, 1000, 2000, and 5000 were run. The training data set includes both labeled and unlabeled examples. The ratio of labeled data is 50%. The classification accuracy, training and testing time are given in Table 4.
Examples per class
Accuracy Training Time Testing Time
10 N/A N/A N/A
1000 92.18% 12.4 0.3
3000 98.13% 21.5 0.3
5000 99.03% 21.8 0.4
Table 4.Accuracy, testing, and training time (minutes) required for Ladder Network
For the second experiment we used the dataset requiring 3000 examples in each class and changed the number of labeled examples in different tests from 60, 600, 2400, 9600, and 12000. We keep the total number of data examples constant at 18000, among which 12000 were used for training and the rest for testing. The results are shown in Table 5.
# labeled Percentage Accuracy Training Testing
60 0.5% 97.35 26.1 0.3
600 5.0% 99.06 26.6 0.3
2400 20.% 98.78 26.6 0.3
9600 80.0% 99.2 27.0 0.3
12000 100% 99.18 27.0 0.3
Table 5. Results of Ladder Network with 3000 samples per class and varying the number of labeled samples use, Training and Testing times in minutes. Percentage is from training set.
The accuracy of the Ladder Networks increases as more examples are given per class. However, it achieves a fairly high accuracy (97.35%) even with just 60 (0.5%) labeled examples, or 10 labeled examples per class. This is encouraging since it is good accuracy with few labeled examples, which is desirable for real world use. When using just 10 examples per class, a different architecture of the Ladder Network is required. Therefore, the test with 10 examples per class was not run.
The iterative DBN and Ladder Network take the longest to achieve their results. The Ladder Network was run for 50 epochs and it took 12.4 minutes for 1000 examples per class. The other Ladder Network tests took over 20 minutes. Since retraining may take significant time, Ladder Networks may not be good for real-time intrusion detection, but for forensic analysis, they may still be practical.
4. RELATED WORK
All of the supervised classifiers we have used have their own semi-supervised versions. They have been used not for just intrusion detection, but also for image classification. There is also another hybrid classifier with SVM and DBN (Salama et al., 2011). In addition to different classifiers and different implementations of those classifiers, there is also an alternative to the KDD 1999 dataset available: the NSL-KDD dataset (Tavallaee et al., 2009).
Haweliya & Nigam (2014) used a semi-supervised SVM to classify the NSL-KDD dataset. Their semi-supervised method consisted of self-training where the SVM is trained on labeled data and then is used to classify unlabeled data which is then used to further train the classifier as new labeled data. They also used multiple training methods to compare and achieved 91.9% accuracy at their highest. The problem with self-training is that incorrect classifications can reinforce themselves. Our semi-supervised Ladder Network method does not use questionable labels to train so the problem of self-training is prevented.
Jadidi et al. (2013) use S4VM to classify network data. S4VM improves upon S3VM (the semi-supervised version of SVM) by creating diverse separators with large margins and low densities. They use 10\% labeled examples and achieve an accuracy as high as 93.76% on one of their datasets.
Our method achieved accuracy as high as 99% with a smaller percentage of labeled data. However, for direct comparison, we need to run the Ladder Network on their packet based datasets with the same percentage of labeled examples.
Tian & Gao (2009) used a Genetic Algorithm to optimize a Neural Network and help the neural network avoid finding local minimums and help converge faster. They used a small training set (100 examples) and achieved a low error rate. Their dataset was similar to the KDD 1999 dataset. This work is related to ours as it also achieves a low error while using a Neural Network to classify intrusions.
5. CONCLUSION
In this paper, Ladder Networks, a semi-supervised approach, was used in
analyzing network data. To establish benchmarks, we used well-known, existing supervised learning methods for Network intrusion detection to classify the KDD 1999 dataset: the Deep Belief Network, Support Vector Machine and Random Forest. Two experiments using the Ladder Network were conducted. In the first experiment, where the number of classes and examples per class were changed, the semi-supervised Ladder Network was able to perform well at network data classification in comparison to the supervised classifiers. In the second
experiment, where the number of labeled examples was changed, the Ladder Network was able to maintain results above 90% with varying ratios of labeled and unlabeled examples. In the near future, we would like to use the Ladder Network on the NSL-KDD dataset and other, newer datasets. Other future work includes exploring what other feed-forward neural network architectures could be integrated with the Ladder Network structure to improve classification
performance.
6. ACKNOWLEDGEMENT
We would like to thank Dr. Kaushik Roy, Dr. Albert Esterline, and Mr. William Nick for their guidance and discussion.
This work is partially supported by the National Science Foundation under the grant CNS-1460864. Any opinions, findings, and conclusions or
recommendations expressed in this material are those of the author(s) and do not necessarily reflect the views of the National Science Foundation.
7. REFERENCES
Adankon, M. M. and Cheriet, M. (2010). Genetic algorithm-based training for semi-supervised svm. Neural Computing & Applications, 19(8):1197--1206.
Alom, M. Z., Bontupalli, V., and Taha, T. M. Intrusion detection using deep belief networks. In 2015 National Aerospace and Electronics Conference (NAECON), pages 339--344. Ashfaq, R. A. R., Wang, X.-Z., Huang, J. Z., Abbas, H., and He, Y.-L. (In Press). Fuzziness based
semi-supervised learning approach for intrusion detection system. Information Sciences. Back, T., Hammel, U., and Schwefel, H. P. (1997). Evolutionary computation: comments on the
Bishop, C. M. (2006). Pattern Recognition and Machine Learning (Information Science and Statistics). Springer-Verlag New York, Inc., Secaucus, NJ, USA.
Breiman, L. (2001). Random forests. Machine Learning, 45(1):5--32.
Fiore, U., Palmieri, F., Castiglione, A., and De Santis, A. (2013). Network anomaly detection with the restricted boltzmann machine. Neurocomputing, 122:13--23.
Hasan, M. A. M., Nasser, M., Pal, B., and Ahmad, S. (2014). Support vector machine and random forest modeling for intrusion detection system (ids). Journal of Intelligent Learning Systems and Applications, 6(1):45.
Haweliya, J. and Nigam, B. (2014a). Article: Network intrusion detection using semi supervised support vector machine. International Journal of Computer Applications, 85(9):27--31. Full text available.
Hecht-Nielsen, R. Theory of the backpropagation neural network. In Neural Networks, 1989. IJCNN., International Joint Conference on, pages 593--605 vol.1.
Hinton, G. (2009). Deep belief networks. Scholarpedia, 4:5947.
Hinton, G. E., Osindero, S., and Teh, Y.-W. (2006). A fast learning algorithm for deep belief nets. Neural Computation, 18(7):1527--1554.
Hinton, G. E. (2007). Boltzmann machine. 2(5):1668. revision #91075. Holland, J. (2012). Genetic algorithms. Scholarpedia, 7:1482.
Holtsnider, B. and Jaffe, B. D. (2010). 7.3.3.2 Intrusion Detection and Prevention. Elsevier. Jadidi, Z., Muthukkumarasamy, V., Sithirasenan, E., and Sheikhan, M. (2013). Flow-based
anomaly detection using neural network optimized with gsa algorithm. In 2013 IEEE 33rd International Conference on Distributed Computing Systems Workshops, pages 76--81.
Lin, L.-z., Liu, Z.-g., and Duan, X.-h. Network intrusion detection by a hybrid method of rough set and rbf neural network. In 2010 2nd International Conference on Education Technology and Computer, volume 3, pages V3--317--V3--320.
Pedregosa, F., Varoquaux, G., Gramfort, A., Michel, V., Thirion, B., Grisel, O., Blondel, M., Prettenhofer, P., Weiss, R., Dubourg, V., Vanderplas, J., Passos, A., Cournapeau, D., Brucher, M., Perrot, M., and Duchesnay, E. (2011). Scikit-learn: Machine learning in Python. Journal of Machine Learning Research, 12:2825--2830.
Ponemon Institute (2015). 2015 cost of cybercrime report: United states. Hewlett Packard Enterprise.
Rasmus, A., Valpola, H., Honkala, M., Berglund, M., Raiko, T., and th Annual Conference on Neural Information Processing Systems, N. t. A. C. o. N. I. P. S. N. (2015). Semi-supervised learning with Ladder Networks. Advances in Neural Information Processing Systems, 2015-January:3546--3554.
Refaeilzadeh, P., Tang, L., and Liu, H. (2009). Cross-Validation, pages 532--538. Springer US, Boston, MA.
Salama, M. A., Eid, H. F., Ramadan, R. A., Darwish, A., and Hassanien, A. E. (2011). Hybrid Intelligent Intrusion Detection Scheme, pages 293--303. Springer Berlin Heidelberg, Berlin, Heidelberg.
Schmidhuber, J. (2015). Deep learning in neural networks: An overview. Neural Networks, 61:85--117.
Tavallaee, M., Bagheri, E., Lu, W., and Ghorbani, A. A. A detailed analysis of the kdd cup 99 data set. In 2009 IEEE Symposium on Computational Intelligence for Security and Defense Applications, pages 1--6.
Tian, J. and Gao, M. Network intrusion detection method based on high speed and precise genetic algorithm neural network. In Networks Security, Wireless Communications and Trusted Computing, 2009. NSWCTC '09. International Conference on, volume 2, pages 619--622.
Theano Development Team (2016). Theano: A Python framework for fast computation of mathematical expressions. arXiv e-prints, abs/1605.02688.
Tesfahun, A. and Bhaskari, D. L. (2013). Intrusion detection using random forests classifier with smote and feature reduction. In Cloud Ubiquitous Computing Emerging Technologies (CUBE), 2013 International Conference on, pages 127--132.
Tsai, C.-F., Hsu, Y.-F., Lin, C.-Y., and Lin, W.-Y. (2009). Intrusion detection by machine learning: A review. Expert Systems With Applications, 36(10):11994--12000.
van Merriënboer, B., Bahdanau, D., Dumoulin, V., Serdyuk, D., Warde-Farley, D., Chorowski, J., and Bengio, Y. (2015). Blocks and fuel: Frameworks for deep learning. CoRR,
abs/1506.00619.
Zien, A., Schölkopf, B., and Chapelle, O. (2006). Semi-supervised Learning. Adaptive Computation and Machine Learning. The MIT Press, Cambridge, Mass. (1999). Kdd cup 1999 data. http://kdd.ics.uci.edu/databases/kddcup99/kddcup99.html