European Online Journal of Natural and Social Sciences 2013; www.european-science.com Vol.2, No.3 Special Issue on Accounting and Management.
ISSN 1805-3602
3028
The Relationship between EVA and EPS and DPS Of Listed Companies in
Tehran Stock Exchange
Mahmoud Bani*, Hojjat Tajik, Solmaz Nourizadeh, Hossein Asadi, Abolfazl Bani Department of Accounting, Damghan Branch, Islamic Azad University, Damghan, Iran.
*Email: [email protected] Abstract
Maximizing the profit from investment firms is the major target of shareholders. Now, the leading indicator of economic value added is internal performance measurement. The most fundamental decision-making criteria that may be involved as investors include EPS, DPS dividends of the shareholders. Since the company's EVA economic value can be measured properly, therefore, we decided to study the relationship between EPS and DPS and EVA, a way to achieve the main goal of maximizing the wealth of the investors through investments made to increase the earned profits. In this article, EPS and DPS data of 21 companies from 50 leading companies in Tehran Stock Exchange for the years 2009 to 2012 were collected according to available information. The results of the study showed a significant relationship between EPS and DPS with no economic value.
Keywords: EVA, EPS, DPS, Stock Exchange, Introduction
Different measures of firm performance is measured by shareholder value and judgment. Failure to use appropriate criteria for measuring corporate performance and shareholder value, causing the value of the company's real value is not driven and the resulting loss group is a group of buyers and stock profits. Managers will receive the reward of stock to maximize shareholder value, and to adapt management decisions with shareholder value. Therefore, the increase in the stock price will benefit managers. The application of this point is that if the stock market price is high, decisions are corporate managers and executives and shareholders benefit. However, bonus shares does not provide managerial decision making tools for managers. Furthermore, companies have realized that in order to make decisions consistent with maximizing the value at the operational level, they should be about performance measurement and reward systems to think again. The relation between shareholder value maximization model of managerial decision-making process, Stern Stewart measure of economic value added (EVA) be created. The purpose of this paper is to answer the following questions: What percentage of the value added because of corporate performance management and what percentage is related to economic conditions? And Eva is associated with EPS and DPS? In addition, all managers have said in this article is concerned with the general rise in the stock market can also benefit managers, and appropriate management decisions is not necessarily the benefit. Generally, during the market boom, rewarding managers are reluctant to shareholders, they also benefit from the trend in stock price (Pender 2003). To determine the value of the function, there are two main criteria; one of the models is that the accounting value of shares multiplied by the earnings per share conversion price to income earned and the other, the economic models are of value, in the early 1980s, accounting for as driving or indicators they believed were critical value judgment about a firm's performance, based only on accounting measures, is misleading, since these measures are often poor indicators of economic performance are considered.
Mahmoud Bani, Hojjat Tajik, Solmaz Nourizadeh, Hossein Asadi, Abolfazl Bani
Openly accessible at http://www.european-science.com 3029
Theoretical framework and literature
Economic value, the most important performance criteria by the "Stern Stewart" was introduced in 1991. These performance criteria have been developed in order to provide the criteria and more efficient than traditional performance measures such as earnings, to coincide with the goals of managers and shareholders, and other stakeholders to create economic value against profit after deducting all costs including cost of capital.
EVAt=NOPATt-WACC(Capital t-1 )
EVAt = book value of total assets at the beginning of the period (t-1) end NOPATt = Net operating profit after tax at end of period t
WACC = weighted average cost of capital rate
The most fundamental indicators that could be involved in the investment decision is EPS. Earning per share is the word that stands for the following net income per share in a given fiscal period. One of the cases in the capital markets and investors to buy shares of the company will absorb the high rate of EPS. DPS is between shareholders as dividends. As you know, under the provisions of the Commercial Code of Iran, the amount of net profit for each period should be stored as reserves in the company. Usually some of profit obtained from the internal laws of the retained earnings reserve account resulting in the shareholder's dividends relative to profits in less time. That's why usually the rate of EPS is lower than DPS while the company achieved total profit is divided among the shareholders Brabrst amount of EPS and DPS.
Theory (2000) study entitled "Assessing the relationship between earnings per share and economic value of non-listed companies in Tehran Stock Exchange" was done after examining both the economic value and profit Hrs·hm. They concluded that many of the companies in the sample, despite affirmative action has led to a negative EVA due to the high cost of having the title company and thus there is no significant relationship between economic value and earnings per share. Rezaei (2001) did another study entitled "The effect of the correlation between equity returns and economic value in assessing performance vehicle industry companies in Tehran Stock Exchange". He concluded that there is no significant relationship between EVA and return on equity, and he asserts that the high rate of capital costs has an impact, and the cost of raising a result of the economic value calculated for the companies, equals to or greater than the net operating profit after tax leading to Sfrya EVA, which is negative. Another study investigated the relationship between EVA and stock dividend per share price of the companies listed on the Stock Exchange of Tehran and the results indicate that there is no significant relationship between EVA and dividends per share, but there was a significant relationship between stock price index and, therefore, confirms that the EVA can better estimate the stock price.
Rostami Anvari, and Saddlery (2004) in their study investigated the relationship between EVA and MVA firms with performance evaluation of accounting standards in Tehran Stock Exchange. For this purpose, the data of 64 companies listed in Tehran Stock Exchange, with 221 years of corporate bonds for the years 1998 to 2002 have been used. The results show that, compared to standard EVA operating cash flow, ther is a higher correlation with the market value of firms, but less correlation of earnings between interest, tax, value-added market value of the economy. Grant (1996) showed that there is a relationship between market value and EVA. However, these studies did not separate the effects of EVA and economic impact and control the market. Consequently, all research articles that have already been prepared by the researchers is to point out that there is no significant relationship between economic value and DPS and EPS.
Special Issue on Accounting and Management
Openly accessible at http://www.european-science.com 3030 Research objectives and hypotheses
EVA measures to enhance the performance and value-added management capabilities. Companies are faced with these issues every day and must promote excellent and higher rates of return on various investments using a variety of methods to gain.
Since the EVA profit company can be properly measured, Therefore, we decided to study and compare with EVA EPS and DPS a way to achieve the main goal of maximizing wealth through increasing investors who profit from investments. Based on the theoretical relationship between the different performance evaluation criteria mentioned in the research literature for the purposes of this study the following hypotheses have been formulated:
First hypothesis: There is a significant relationship EVA as a measure of firm valuation and earnings per share EPS growth.
Second hypothesis: There is a significant relationship EVA as a measure of firm valuation and dividend per share DPS.
Methodology
Deductive -inductive approach was used in this study. First, theoretical studies on the inductive method measured the variables to be calculated based on appropriate methods of variable values and then the inductive approach was used to examine the relationship between these variables and the significant economic value added as the dependent variable and the SPE and SPD per share as the independent variable. The time of the study was between 2009-2012 and its scope was Tehran Stock Exchange. The statistical population includes those firms listed in Tehran Stock Exchange during the period 2009-2012 which were active members of the Tehran Stock Exchange.
This article used 21 years data of EPS and DPS among the companies mentioned as 50 top companies in Tehran Stock Exchange and according to the available data, a total of 149 years of company were used to test the hypothesis using the SPSS software.
Hypothesis testing results
First hypothesis: There is a significant relationship between the EVA as a measure of firm valuation and earnings per share EPS growth.
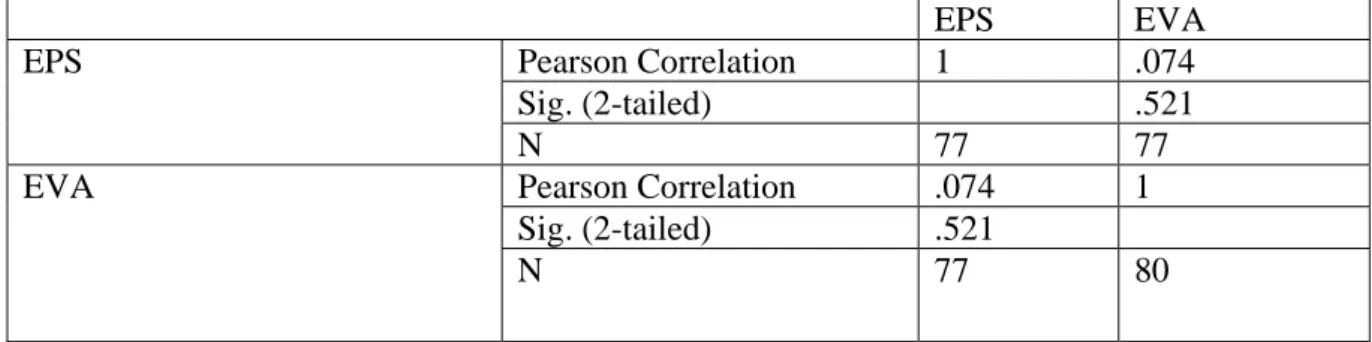
To examine the linear relationship between EVA and EPS, Pearson correlation coefficient as a parametric approach was used as it is clear from table 1.
Table 1. Correlation between EVA and EPS
EPS EVA
EPS Pearson Correlation 1 .074
Sig. (2-tailed) .521
N 77 77
EVA Pearson Correlation .074 1
Sig. (2-tailed) .521
N 77 80
According to the above table, there is the lack of a significant relationship between the SPE and economic value added (0.05 <521. = Sig). Therefore, the results obtained indicate the absence of a significant relationship between EVA AVE SPE per share in listed companies at Tehran Stock Exchange.
Mahmoud Bani, Hojjat Tajik, Solmaz Nourizadeh, Hossein Asadi, Abolfazl Bani
Openly accessible at http://www.european-science.com 3031
Second hypothesis: There is a significant relationship between the EVA as a measure of firm valuation and dividend per share DPS.
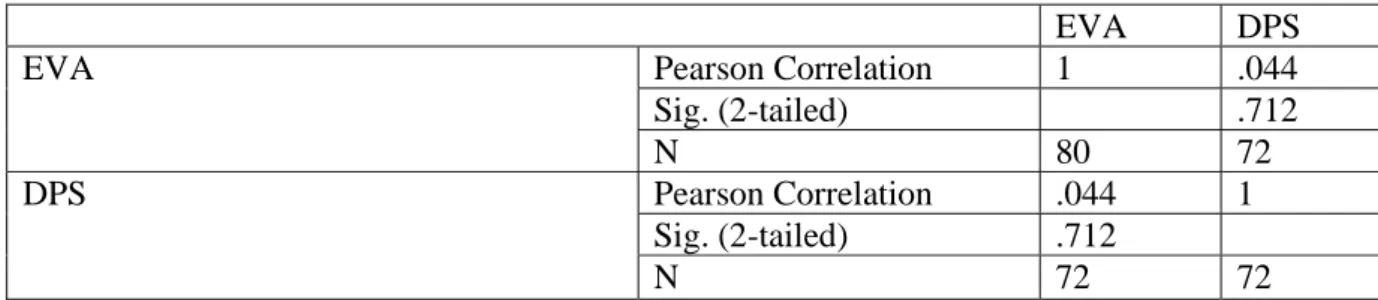
Table 2.Correlation between EVA and DPS
EVA DPS
EVA Pearson Correlation 1 .044
Sig. (2-tailed) .712
N 80 72
DPS Pearson Correlation .044 1
Sig. (2-tailed) .712
N 72 72
As it is clear from the above table, there is no significant relationship between dividend and economic value added (0.05 <0.712 = Sig DPS). The results indicate no significant relationship between the dividend and economic value added.
Discussion and conclusions
Exchange impact on economic development is undeniable and the main task of moving the capital markets to efficiently allocate capital and resources to optimize the manufacturing and service firms. In those countries having effective exchange, all information is reflected in the market price of securities in the market, and there is no possibility of return and return on investment commensurate with the risk associated with it, but in countries where capital markets are influenced by other factors such as non-functioning capital markets, the price of the markets’ securities are substantially different from the true value. Therefore, individual investor should buy stocks an extensive analysis of their own. More important is that when EVA is significant for investors in stock market, a special look at the amount discounted to current value represents the net current value of all capital projects in the company. Therefore, the aim of establishing the company, EVA and its growth is maximized.
Although there is no significant correlation between EPS and DPS with economic value, each of these characteristics has great influence on legal reserve and dividend payments, past experience and anticipated earnings per share this year, leading to investment in Stock Market.
Recommendations
The following suggestions can be used in conjunction with research in Iran's capital market and be useful. Because accounting information for decision making is not enough, corporate managers should provide information as possible, which is the basis of economic judgment.
Using standard economic value added EVA as a measure of executive remuneration and its impact on management performance
Checking the return value of the company and comparing it with the value of the company by economic value added EVA
References
Asad Khan, M., Hussain Shah, N. & Rehman, A. (2011). The Relationship between Stock Return and Economic Value added. Working paper, Institute of Management Science.
Asteriou, D., & Hall, S. G. (2007). Applied Econometrics, A Modern Approach. (2 ed.). China: Palgrave Macmillan.
Special Issue on Accounting and Management
Openly accessible at http://www.european-science.com 3032 Bani, M. (2014) Measuring the relationship between equity and intellectual capital, Management
Science Letters, 739-742.
Bani, M. (2014). A study on relationship between employees’ psychological empowerment and organizational commitment, Management Science Letters, 1197-1200. Clarke, M., Seng, D., & Whiting, R. H. (2011). Intellectual capital and firm performance in Australia. Journal of Intellectual Capital.
Bani, M. (2014). An investigation on the relationship between TQM and ICT in revenue agency organizations, Management Science Letters, 1353-1356.
Bani, M. (2014). The study of relationship between psychological empowerment and job interest (Case study:Tax offices of Tehran), Applied mathematics in Engineering, Management and Technology, 2, 97-102.
Belkaoui,D., & Karpik,S.(2002). Foresight Information Basic of Economic Value Added, Journal of Financial, 84 , 12.
Bluki, G, & Pavlik, A. (2000). Relation between Capital Structure and Performance Managerial, Journal of Cost Management, 51 , 4.
Charoendeesawat, S. (2011). The Explanatory Power of Accounting Measures, EVA and MVA on Stock Returns: Evidence from Thailand Stock Market. Business Management, 8, 29.
Dominique, T. A. (2009).An Empirical Research on the Relationship between Intellectual Capital and Corporate Financial Performance on Indonesian Listed Companies.
Gholam Sajadi Khah, B. (2014). Analysis of the Effect of Intellectual Capital on Financial Performance of Companies Accepted in Tehran's Stock Exchange, mathematics in Engineering, Management and Technology,163-170.
Ministry of Economic Affairs and Finance, Banking and Monetary Policy Secretariat (1387), monetary and banking regulation and its impact on capital markets
Roos, J., Roos, G., Dragonetti, N. C., & Edvinsson, L. (1998). Intellectual capital. Macmillan Business.
Stewart, T.A. (1997) Intellectual Capital: The New Wealth of Organizations, Doubleday/Currency, New York.
Tobin, J. (1969). A general equilibrium approach to monetary theory. Journal of Money, Credit and Banking, 1,15-29.