Evaluation of a Quality Improvement
Intervention to Increase Use of
Telephonic Interpretation
K. Casey Lion, MD, MPHa,b, Beth E. Ebel, MD, MSc, MPHa,b,c,d, Sarah Rafton, MSWc, Chuan Zhou, PhDa,b, Patty Hencz, RNc, Rita Mangione-Smith, MD, MPHa,b
abstract
BACKGROUND:Language barriers are associated with poor health care outcomes,and barriers exist for timely in-person interpretation. Although available on-demand, telephonic interpretation remains underutilized. This study evaluates whether a quality improvement (QI) intervention was associated with rates of interpretation and parent-reported language service use at a children’s hospital.
METHODS:The QI intervention was developed by a multidisciplinary team and included provider education, electronic alerts, standardized dual-handset telephones, and 1-touch dialing in all hospital rooms. Interpreter use was tracked for 12 months before, 5 months during, and 12 months after the intervention. Weekly rates of interpretation per limited English proficient (LEP) patient-day were evaluated by using segmented linear regression. LEP parents were surveyed about professional interpretation and delays in care. Responses before, during, and after the intervention were compared by using thex2test for trend.
RESULTS:Telephonic interpretation rates increased by 53% after the intervention (baseline 0.38 per patient-day, increased 0.20 [0.13–0.28]). Overall (telephonic and in-person) interpretation increased by 54% (baseline 0.96, increased by 0.51 [0.38–0.64]). Parent-reported interpreter use improved, including more frequent use of professional interpreters (53.3% before, 71.8% during, 69.3% after,Ptrend = .001), less frequent use of ad hoc interpreters (52.4% before, 38.1% during, 41.4% after,Ptrend = .03), and fewer interpretation-related delays in care (13.3% before, 7.9% during, 6.0% after,Ptrend = .01).
CONCLUSIONS:This QI intervention was associated with increased telephonic interpreter use and improved parent-reported use of professional language services. This is a promising approach to deliver safe, timely, and equitable care for the growing population of LEP children and families.
Increasing numbers of patients and families report having limited English proficiency (LEP).1Language barriers
in the health care setting are associated with increased cost,2decreased
satisfaction3,4and adherence,5,6
variation in testing and diagnosis,2,7
and increased serious adverse events.8–11Both in-person and
telephonic professional medical interpretation effectively mitigate the risks associated with language barriers,12–14but underutilization
of professional interpreters is widespread.15–19Many providers
choose to“get by”with nonproficient language skills,20and in a 2010 survey,
44% of pediatricians who regularly
aDepartment of Pediatrics anddHarborview Injury
Prevention and Research Center, University of Washington, Seattle, Washington;bCenter for Child Health, Behavior and
Development, Seattle Children’s Research Institute, Seattle, Washington; andcCenter for Diversity and Health Equity,
Seattle Children’s Hospital, Seattle, Washington
Dr Lion conceptualized and designed the study, performed the analyses, and drafted the manuscript; Dr Ebel assisted with study design, participated in analysis planning and interpretation, and reviewed and critically revised the manuscript; Ms Rafton and Ms Hencz contributed to study design and reviewed and provided critical input on the manuscript; Dr Zhou provided critical input on study design and analysis, and reviewed and revised the manuscript; Dr Mangione-Smith participated in study design, contributed to analytic planning and interpretation of results, and critically revised the manuscript; and all authors approved thefinal manuscript as submitted.
www.pediatrics.org/cgi/doi/10.1542/peds.2014-2024
DOI:10.1542/peds.2014-2024 Accepted for publication Sep 23, 2014
Address correspondence to K. Casey Lion, MD, MPH, Center for Child Health, Behavior and Development, Seattle Children’s Research Institute, M/S CW8-6, PO Box 5371, Seattle, WA 98145-5005. E-mail: casey.lion@ seattlechildrens.org
PEDIATRICS (ISSN Numbers: Print, 0031-4005; Online, 1098-4275).
saw families with LEP reported using no professional interpretation.15
The reasons for underuse are multifactorial and, at the system level, involve organizational culture, lack of investment in interpretation, inconsistent identification of language need, and inadequate clinician training.21,22At the encounter level,
provider decision-making includes considerations of their own and the patient’s or family’s language proficiency, convenience, and the expected complexity of the clinical encounter.23–25Unfortunately,
clinicians do not reliably assess their own proficiency,24and a priori
decisions about an encounter’s complexity necessarily account only for the clinician’s agenda, not the family’s. In addition, some families, not accustomed to being offered professional interpretation, bring untrained friends or family members to interpret. This practice of ad hoc interpretation, while embraced by many clinicians for convenience,22
is associated with increased risk for miscommunication and patient harm.26–28
Telephonic interpretation is available on-demand, is less expensive than in-person interpretation, and is accessible in numerous languages. In 2011, a Rapid Process Improvement Workshop was conducted at Seattle Children’s Hospital (SCH) to develop a multifaceted quality improvement (QI) intervention with the goal of increasing inpatient telephonic interpreter use. The primary objective was to increase rates of telephonic interpretation for LEP families of hospitalized children, while maintaining or improving overall interpretation rates. Secondary objectives were to decrease parent-reported delays in care associated with waiting for an in-person interpreter, and to improve parent-reported use of professional interpretation by medical providers.
METHODS
Setting
This QI intervention and evaluation were conducted at SCH, a large children’s hospital in the Pacific Northwest. In 2012, 16% of hospitalized children were from families with LEP. Fifty-six percent of those spoke Spanish; the next most common languages were Somali, Vietnamese, and Russian. Language need was assessed at hospital registration by asking what language the parents or caregivers prefer for medical communication. This registration question replaced the previous question, regarding primary language spoken at home, in July 2011, shortly before the QI intervention. All clinic schedulers and hospital registration staff were trained to ask the new question of all families at every encounter. The preferred language for care was recorded in the patient electronic medical record (EMR). Given that most individuals who prefer a non-English language for medical care have LEP,29we refer to these families
as LEP in this article. The hospital employed 21 professional in-person interpreters and contracted with agencies for in-person language services when needed. Telephonic interpreter services in.100 languages were available in every hospital room 24 hours per day. Most rooms were already equipped with dual handsets and 1-touch dialing. All interpretation services were provided at no cost to families. New physicians and nurses were instructed in the use of in-person and telephonic interpreters, with the stated expectation that all medical communication occur in the family’s preferred language. Provider language proficiency assessment with a validated program was being pilot-tested with select providers beginning in early 2011, 6 months before the intervention. The program was formally implemented in October 2012 (toward the end
of the postintervention period) and included a policy requiring providers and staff not passing the language proficiency test to use professional interpretation for medical communication. This program and policy were adopted to comply with the federal mandate requiring that institutions ensure the linguistic competence of those providing medical care in nonnative languages.30
Previous research has demonstrated such testing may prevent potentially dangerous nonproficient clinical language use.20,31
Despite their availability,
language services at SCH remained underutilized. From 2010 to 2011, over 40% of LEP patients received fewer than 2 professional interpretations per hospital day. Families with LEP who spoke languages other than Spanish were less likely to have access to prompt in-person interpretation, and had a nearly 80% lower odds of meeting that standard compared with Spanish speakers.
Intervention
The QI intervention was developed during a 5-day Rapid Process Improvement Workshop. These workshops are structured events conducted through the hospital Continuous Performance Improvement Department and are based upon the Toyota Lean methodology.32Multidisciplinary
participant teams map the current process, identify barriers and redundancies in the system, develop an intervention, and plan a rapid implementation process with specific evaluation metrics.
The design workshop was conducted in August 2011, and the intervention was implemented from August through December 2011. The intervention consisted of targeted education, institution-wide media, EMR alerts, and telephone equipment upgrade and standardization
multifaceted approach sought to educate providers and decrease barriers to telephonic interpreter use. Education was delivered by Interpreter Services staff at division meetings for physicians, nurses, residents, and support staff. These 10-minute interactive sessions emphasized the importance of using professional interpretation without delaying care, and demonstrated access to telephonic interpretation. During the same period, a series of articles with the theme“Don’t Wait, Communicate!” were posted on the hospital intranet homepage, and links to the articles were emailed to all personnel. The articles highlighted the importance of using telephonic interpretation to communicate with LEP families immediately, rather than delaying care by waiting for in-person interpretation. This message was reinforced with a time-limited alert in the EMR. Over a 3-month period, anyone who ordered in-person interpretation received an alert recommending the use of telephonic interpretation for brief or time-sensitive communications, and reminding them how to access telephonic interpretation. Telephone interpretation equipment and signage were revamped and
standardized throughout the hospital to ensure that 1-touch dialing was clearly marked. An inspection ensured that dual handsets were installed and functioning properly in each room.
Data Collection
The evaluation aimed to determine the intervention impact on (1) overall and telephonic interpreter use, and (2) family-reported receipt of language services and delays in care. Data sources are described below by objective. For analyses, the preintervention period was August 2010 to July 2011; the intervention period was August to December 2011; and the postintervention period was January to December 2012.
Interpreter Use
The analysis included all interpretations for LEP families whose children were hospitalized on a medical or surgical unit between August 2010 and December 2012. Interpreter use data were compiled from orders placed for in-person interpretation and invoices for telephonic interpretation. Each time- and date-stamped interpretation encounter was linked to the child’s medical record number. Using patient admission, discharge, and location data for LEP children, we generated weekly reports measuring professional interpretation per patient-day, telephonic interpretation per patient-day, and telephonic interpretation as a percent of total interpretation.
Parent-Reported Language Services and Delays in Care
Parents of hospitalized children were invited to participate in the National
Research Corporation Picker Family Experience Survey, completed in-person or by telephone between 24 hours before and 7 days after discharge. The survey is routinely offered to all families being
discharged from the hospital, and is self-administered or administered by a research assistant. The Family Experience Survey was developed and validated in adult patients,33then
adapted for andfield-tested with families of hospitalized children.34
The survey was available in multiple languages and professional
interpretation was used to administer the survey when needed. In the survey, caregivers were asked for their preferred language for
discussing their child’s medical care. If the response was a non-English language, several questions about language services were asked. These questions included whether an interpreter (in-person or telephonic) was always present when discussing medical care (always, usually, sometimes, rarely, or never); how often a family or friend (ad hoc interpreter) was used to interpret (always, usually, sometimes, rarely, or never); and whether care was ever delayed while waiting for an interpreter (yes, no, or don’t know).
Analysis
We analyzed temporal changes in interpreter use with segmented linear regression, a method of interrupted time series analysis.35Segmented
linear regression allowed each time period to have its own intercept (base level) and slope (trend), and then comparisons of differences across time periods were made by testing linear combinations of the regression coefficients. If statistically significant differences in intercepts and slopes existed, individual intercepts and slopes for different time periods were retained. If no differences in intercepts and slopes existed, a more parsimonious model assuming a common intercept and slope was subsequently tested. We constructed
FIGURE 1
separate segmented linear regression models for each outcome: (1)
telephonic interpretations per patient-day, (2) overall interpretations per patient-day, and (3) proportion of telephonic interpretation. Weekly averages for each outcome were used in analyses.
For survey data, responses were dichotomized for analysis, with the ideal answer (eg,“always” for having an interpreter present) coded as yes, and all other answers as no. Responses of “don’t know”were dropped from analysis. Percent of families providing this“top-box” response was compiled for each time period (before, during, and after intervention). Changes in parent response over time were evaluated by usingx2trend analysis for proportions.
Human Subjects Review
The SCH Institutional Review Board reviewed and approved the study.
RESULTS
Interpreter Use
Patients with LEP contributed 10 890, 3981, and 9472 patient-days to the before, during, and after intervention periods, respectively. There were no statistically significant within-period changes in outcomes for any of the 3 models (all slope coefficients between20.01 and 0.01, and all correspondingP..1), so we assessed differences in mean values for each time period by using the more parsimonious models without slopes. During the preintervention period, the average number of telephonic interpretations per patient-day was 0.38 (0.33–0.43). There was no significant change during the intervention period (0.04; 95% confidence interval [CI]:20.06 to 0.14), but there was an increase of 0.2 telephonic interpretations per patient-day during the postintervention period (95% CI: 0.13 to 0.28), representing a 53%
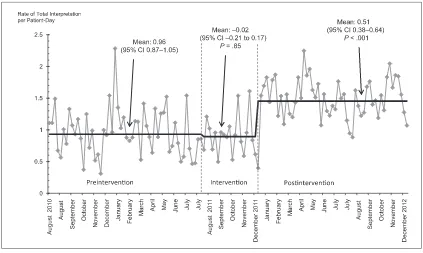
increase over baseline (Fig 2). A similar pattern was seen in overall interpretations per patient-day, representing a 54% increase during the postintervention period in overall interpretation (Fig 3). The proportion of interpretations delivered by telephone was 0.40 at baseline (95% CI: 0.37 to 0.43). There was a small, borderline-significant increase during the intervention (0.05; 95% CI: 0 to 0.11), but it was not maintained during the follow-up period (0; 95% CI:20.04 to 0.04).
Parent-Reported Language Services and Delays in Care
Research assistants approached 286 LEP parents before, 149 during, and 290 after the intervention for survey participation. These represent ∼20% of the LEP admissions to medical or surgical units over the study period. Reasons for nonapproach were generally related to research assistant availability, such as weekend or after-hours discharge and staffing limitations, rather than patient or family characteristics. Of those approached, survey responses were obtained from 185 LEP parents before, 117 during, and 203 after the intervention, for survey response rates of 65%, 79%, and 70%, respectively. Compared with baseline, the proportion of LEP caregivers reporting that a professional interpreter was always used for medical communication increased significantly during and after the intervention, from 53.3% to 71.8% and 69.3%, respectively (Ptrend = .001; Table 1). Over the same period, the proportion of families reporting ad hoc interpretation by a friend or family member decreased
significantly, as did the proportion of families reporting delays in care due to waiting for an interpreter (Table 1).
DISCUSSION
In this evaluation of a QI intervention to improve telephonic interpreter use,
rates of telephonic and overall interpretation per patient-day increased significantly after the intervention and were sustained. The intervention was associated with fewer caregiver reports of interpreter-related delays in care, decreased use of ad hoc interpreters, and improved consistency of
professional interpreter use by health care providers. These significant and sustained improvements in language service use during the care of sick children are likely to decrease risk for errors and improve the communication and comprehension between providers, parents, and patients.
Although the intervention increased rates of telephonic interpretation, we also found increases in overall interpretation. The lack of change in telephonic interpretation as a percent of overall interpretation suggests that in-person interpretation increased at a similar rate during the study period. Ourfindings suggest that while efforts to encourage substitution of remote for in-person interpretation may not have been effective, efforts to increase awareness of the need for professional interpretation were. The concurrent increase in in-person interpretation may stem from the previously reportedfinding that many providers prefer in-person over telephonic interpretation, especially for understanding and addressing cultural nuances and nonverbal aspects of communication.36,37
And while our intervention was successful, more improvement is still needed, because an average of 1.5 interpretations per patient-day is still below the hospital’s minimum goal of 2, and well below the number of times care providers likely enter the room.
element(s) of the intervention was not possible. Multifaceted
interventions have generally been found to be more effective than
single-item interventions,38so
ultimately it may not be helpful to isolate the impact of individual components. However, among some
outcomes (percent telephonic interpretation, ad hoc interpreter use, and professional interpreter use), the period of greatest change was noted
FIGURE 2
Rate of telephonic interpretation per patient-day over time. Diamonds reveal weekly average rate, and the black line reveals mean rate over each study time period, annotated with segmented linear regression results.
FIGURE 3
during intervention implementation, with some attenuation of effect in the following year, suggesting that the changes were likely related to the intervention, rather than a secular trend related to other factors.
Few studies have evaluated the impact of QI interventions to improve the use of professional interpretation. The original Speaking Together learning collaborative, a network of 10 hospitals constituting thefirst national language services QI network (of which SCH was 1), resulted in modest improvements in at least 1 language service process metric per participating hospital, such as screening for preferred language for care.39 At another institution,
installation of standard, dual-handset telephones with easy interpreter access in every hospital room improved provider-reported use of telephone interpretation.40
These interventions demonstrated improvements in the foundational aspects of providing high-quality language services, namely identifying need and improving access, which are essentialfirst steps.
Our QI intervention and evaluation built upon these successes by demonstrating an approach for improving language service
timeliness and use at a hospital with a robust language access program. Unlike previous studies, our evaluation included a full year of pre- and postimplementation data, so our conclusions are unlikely to be attributable to seasonal variation and demonstrate sustained impact over time. Incorporation of language
service process and outcome measures strengthened confidence in the results, because the
intervention increased the number of interpretations per patient-day, and improved parent-reported experience of language services. According to the Institute of Medicine, high quality care should be timely, patient-centered, and equitable41; this QI intervention
succeeded in improving the quality of care delivered to LEP patients and families.
This study had several limitations. This was an uncontrolled study, and the possibility that secular trends or confounding factors accounted for the changes in interpreter use and parent experience cannot be excluded. However, the inclusion of 1 year of pre- and postintervention data decreased the likelihood thatfindings resulted from seasonal variation or short-lived effects. There were 2 additional changes to care for LEP families during the study time period, but unrelated to the study, that deserve mention. The change in registration question to identify language need that occurred immediately preintervention could have caused the appearance of improved interpretation rates by removing non-LEP families from the denominator. However, if that were the case, we would expect to see an immediate, marked change in rates, rather than the more delayed change we found. In addition, it would not have influenced our parent-reported outcomes, because LEP for those analyses was determined by a survey question. The other change was the rollout of language proficiency testing for providers. Pilot testing was in
effect for most of the study, making it unlikely to substantially influence our
findings. The program was officially implemented in October 2012. Although interpretation rates were high in October through November 2012, they were not so high as to cause a statistically significant change over time (slope) during the
postintervention period, making it unlikely that it influenced our results appreciably. A second limitation is that measurement of electronic orders for in-person interpretation may have under- or overestimated actual use. At times, an order may have been placed that was notfilled (eg, no Nepali interpreter available at the requested time), or the ordering provider may have cancelled the request. Alternatively, an in-person interpreter may have been asked to interpret for multiple providers (eg, the nurse and the resident), or may have interpreted for several patients with the same provider without requesting a new order. Providers did not routinely document use of professional interpretation, so it was impossible to validate orders with documented use. However, the relationship between orders and actual interpretations was unlikely to have changed over time, so differences over time are likely accurate. In addition, LEP families completing the survey may not have been representative because of low approach rates, but this lack of representativeness was consistent across all 3 study periods. Finally, this study was conducted at a single institution with a strong preexisting commitment to improving care for LEP patients, which may limit the generalizability of the specific TABLE 1 Parent-Reported Use of Professional Interpreter (In-Person or Telephonic) for Medical Communication, Use of Ad Hoc Interpreter (Family or
Friends), and Delays in Care Before, During, and After the QI Intervention
Before (August 2010–July 2011), % (n/N)
During (August 2011– December 2011), % (n/N)
After (January 2012– December 2012), % (n/N)
x2Test for Trend
Professional interpreter always present when discussing medical care
53.3 (98/184) 71.8 (84/117) 69.3 (140/202) P= .001
intervention to institutions with similar infrastructure and organizational culture.
CONCLUSIONS
This multifaceted QI intervention, developed by using interdisciplinary stakeholder input and consisting of education, electronic alerts, hospital-wide messaging, and equipment standardization, was associated with improved rates of telephonic
interpretation and higher overall use of professional interpretation for hospitalized LEP children and their families. These improvements were accompanied by significantly fewer parent reports of interpretation-associated delays in care, use of ad hoc interpreters, and communication without professional interpretation. Our study demonstrated a successful and replicable approach for
improving use of language services.
Improvements in communication between medical providers, patients, and families is at the heart of patient-centered care, and is a key element in ensuring that every child receives safe, timely, and equitable care.
ACKNOWLEDGMENT
The authors thank Jessica Ramos for her assistance with data review and analysis.
FINANCIAL DISCLOSURE:The authors have indicated they have nofinancial relationships relevant to this article to disclose.
FUNDING:Supported by The Robert Wood Johnson Foundation (grant 65127; PI: Dr Ebel), the Center for Diversity and Health Equity at Seattle Children’s Hospital, and the Department of Continuous Performance Improvement at Seattle Children’s Hospital.
POTENTIAL CONFLICT OF INTEREST:The authors have indicated they have no potential conflicts of interest to disclose.
REFERENCES
1. US Census Bureau. American Community Survey 2006. Available at: http:// factfinder.census.gov/servlet/ DatasetMainPageServlet?_program= DEC&_submenuId=&_lang=en&_ts=. Accessed June 21, 2010
2. Hampers LC, McNulty JE. Professional interpreters and bilingual physicians in a pediatric emergency department: effect on resource utilization.Arch Pediatr Adolesc Med. 2002;156(11): 1108–1113
3. Morales LS, Cunningham WE, Brown JA, Liu H, Hays RD. Are Latinos less satisfied with communication by health care providers?J Gen Intern Med. 1999;14(7): 409–417
4. Mazor SS, Hampers LC, Chande VT, Krug SE. Teaching Spanish to pediatric emergency physicians: effects on patient satisfaction.Arch Pediatr Adolesc Med. 2002;156(7):693–695
5. Kravitz RL, Helms LJ, Azari R, Antonius D, Melnikow J. Comparing the use of physician time and health care resources among patients speaking English, Spanish, and Russian.Med Care. 2000;38(7):728–738
6. Wilson E, Chen AH, Grumbach K, Wang F, Fernandez A. Effects of limited English proficiency and physician language on health care comprehension.J Gen Intern Med. 2005;20(9):800–806
7. Levas MN, Dayan PS, Mittal MK, et al Effect of Hispanic ethnicity and language
barriers on appendiceal perforation rates and imaging in children.J Pediatr. 2014;164(6):1286–1291
8. Cohen AL, Rivara F, Marcuse EK, McPhillips H, Davis R. Are language barriers associated with serious medical events in hospitalized pediatric patients?Pediatrics. 2005;116(3): 575–579
9. Divi C, Koss RG, Schmaltz SP, Loeb JM. Language proficiency and adverse events in US hospitals: a pilot study.Int J Qual Health Care. 2007;19(2):60–67
10. Bartlett G, Blais R, Tamblyn R, Clermont RJ, MacGibbon B. Impact of patient communication problems on the risk of preventable adverse events in acute care settings.CMAJ. 2008;178(12): 1555–1562
11. Lion KC, Rafton SA, Shafii J, et al Association between language, serious adverse events and length of stay among hospitalized children.Hosp Pediatr. 2013; 3(3):219–225
12. Flores G. The impact of medical interpreter services on the quality of health care: a systematic review.Med Care Res Rev. 2005;62(3):255–299
13. Karliner LS, Jacobs EA, Chen AH, Mutha S. Do professional interpreters improve clinical care for patients with limited English proficiency? A systematic review of the literature.Health Serv Res. 2007; 42(2):727–754
14. Crossman KL, Wiener E, Roosevelt G, Bajaj L, Hampers LC. Interpreters: telephonic, in-person interpretation and bilingual providers.Pediatrics. 2010; 125(3). Available at: www.pediatrics.org/ cgi/content/full/125/3/e631
15. DeCamp LR, Kuo DZ, Flores G, O’Connor K, Minkovitz CS. Changes in language services use by US pediatricians. Pediatrics. 2013;132(2). Available at: www.pediatrics.org/cgi/content/full/132/ 2/e396
16. Diamond LC, Wilson-Stronks A, Jacobs EA. Do hospitals measure up to the national culturally and linguistically appropriate services standards?Med Care. 2010; 48(12):1080–1087
17. Ginde AA, Clark S, Camargo CA Jr. Language barriers among patients in Boston emergency departments: use of medical interpreters after passage of interpreter legislation.J Immigr Minor Health. 2009;11(6):527–530
18. Ramirez D, Engel KG, Tang TS. Language interpreter utilization in the emergency department setting: a clinical review. J Health Care Poor Underserved. 2008; 19(2):352–362
19. Schenker Y, Pérez-Stable EJ, Nickleach D, Karliner LS. Patterns of interpreter use for hospitalized patients with limited English proficiency.J Gen Intern Med. 2011;26(7):712–717
on provider use of Spanish for clinical care.Pediatrics. 2012;130(1). Available at: www.pediatrics.org/cgi/content/full/ 130/1/e80
21. Baurer D, Yonek JC, Cohen AB, Restuccia JD, Hasnain-Wynia R. System-level factors affecting clinicians’perceptions and use of interpreter services in California public hospitals.J Immigr Minor Health. 2014;16(2):211–217
22. Bonacruz Kazzi G, Cooper C. Barriers to the use of interpreters in emergency room paediatric consultations. J Paediatr Child Health. 2003;39(4): 259–263
23. Gadon M, Balch GI, Jacobs EA. Caring for patients with limited English proficiency: the perspectives of small group practitioners.J Gen Intern Med. 2007;22 (suppl 2):341–346
24. Lion KC, Thompson DA, Cowden JD, et al. Clinical Spanish use and language proficiency testing among pediatric residents.Acad Med. 2013;88(10): 1478–1484
25. Andres E, Wynia M, Regenstein M, Maul L. Should I call an interpreter?-How do physicians with second language skills decide?J Health Care Poor Underserved. 2013;24(2):525–539
26. Flores G, Abreu M, Barone CP, Bachur R, Lin H. Errors of medical interpretation and their potential clinical
consequences: a comparison of professional versus ad hoc versus no interpreters.Ann Emerg Med. 2012;60(5): 545–553
27. Flores G, Abreu M, Schwartz I, Hill M. The importance of language and culture in pediatric care: case studies from the
Latino community.J Pediatr. 2000;137(6): 842–848
28. Flores G, Laws MB, Mayo SJ, et al. Errors in medical interpretation and their potential clinical consequences in pediatric encounters.Pediatrics. 2003; 111(1):6–14
29. Karliner LS, Napoles-Springer AM, Schillinger D, Bibbins-Domingo K, Pérez-Stable EJ. Identification of limited English proficient patients in clinical care.J Gen Intern Med. 2008;23(10): 1555–1560
30. US Department of Health and Human Services Office of Minority Health. National Standards for Culturally and Linguistically Appropriate Services in Health Care. Washington, DC: US Department of Health and Human Services Office of Minority Health; 2001
31. Moreno MR, Otero-Sabogal R, Newman J. Assessing dual-role staff-interpreter linguistic competency in an integrated healthcare system.J Gen Intern Med. 2007;22(suppl 2):331–335
32. Clark DM, Silvester K, Knowles S. Lean management systems: creating a culture of continuous quality improvement. J Clin Pathol. 2013;66(8):638–643
33. Jenkinson C, Coulter A, Bruster S. The Picker Patient Experience Questionnaire: development and validation using data from in-patient surveys infive countries. Int J Qual Health Care. 2002;14(5): 353–358
34. Co JP, Sternberg SB, Homer CJ. Measuring patient and family
experiences of health care for children. Acad Pediatr. 2011;11(suppl 3):S59–S67
35. Wagner AK, Soumerai SB, Zhang F, Ross-Degnan D. Segmented regression analysis of interrupted time
series studies in medication use research.J Clin Pharm Ther. 2002; 27(4):299–309
36. Locatis C, Williamson D, Gould-Kabler C, et al. Comparing in-person, video, and telephonic medical interpretation. J Gen Intern Med. 2010;25(4): 345–350
37. Nápoles AM, Santoyo-Olsson J, Karliner LS, O’Brien H, Gregorich SE, Pérez-Stable EJ. Clinician ratings of interpreter mediated visits in underserved primary care settings with ad hoc, in-person professional, and video conferencing modes.J Health Care Poor Underserved. 2010;21(1):301–317
38. Hulscher ME, Wensing M, van Der Weijden T, Grol R. Interventions to implement prevention in primary care. Cochrane Database Syst Rev. 2001;(1): CD000362
39. Regenstein M, Huang J, West C, Trott J, Mead H, Andres E. Improving the quality of language services delivery:findings from a hospital quality improvement initiative.J Healthc Qual. 2012;34(2): 53–63
40. Tuot DS, Lopez M, Miller C, Karliner LS. Impact of an easy-access telephonic interpreter program in the acute care setting: an evaluation of a quality improvement intervention.Jt Comm J Qual Patient Saf. 2012;38(2):81–88
DOI: 10.1542/peds.2014-2024 originally published online February 23, 2015;
2015;135;e709
Pediatrics
Mangione-Smith
K. Casey Lion, Beth E. Ebel, Sarah Rafton, Chuan Zhou, Patty Hencz and Rita
Interpretation
Evaluation of a Quality Improvement Intervention to Increase Use of Telephonic
Services
Updated Information &
http://pediatrics.aappublications.org/content/135/3/e709 including high resolution figures, can be found at:
References
http://pediatrics.aappublications.org/content/135/3/e709#BIBL This article cites 37 articles, 7 of which you can access for free at:
Subspecialty Collections
sub
http://www.aappublications.org/cgi/collection/quality_improvement_
Quality Improvement
unication_skills_sub
http://www.aappublications.org/cgi/collection/interpersonal_-_comm
Interpersonal & Communication Skills
e_management_sub
http://www.aappublications.org/cgi/collection/administration:practic
Administration/Practice Management
following collection(s):
This article, along with others on similar topics, appears in the
Permissions & Licensing
http://www.aappublications.org/site/misc/Permissions.xhtml in its entirety can be found online at:
Information about reproducing this article in parts (figures, tables) or
Reprints
DOI: 10.1542/peds.2014-2024 originally published online February 23, 2015;
2015;135;e709
Pediatrics
Mangione-Smith
K. Casey Lion, Beth E. Ebel, Sarah Rafton, Chuan Zhou, Patty Hencz and Rita
Interpretation
Evaluation of a Quality Improvement Intervention to Increase Use of Telephonic
http://pediatrics.aappublications.org/content/135/3/e709
located on the World Wide Web at:
The online version of this article, along with updated information and services, is
by the American Academy of Pediatrics. All rights reserved. Print ISSN: 1073-0397.