Author for correspondence:
Department of Electronics and Communication Engineering, K.S.Rangasamy College of Technology, Nammakal, India
Volume-7 Issue-2
International Journal of Intellectual Advancements
and Research in Engineering Computations
Analysis and detection of bone tumor in MRI images using machine
learning
Vanitha K
1, Jeeva S
2, Nandhine K T
2, Nihal M A
2, Monisha K
2Assistant Professor
1, UG Students
2Department of Electronics and Communication Engineering, K.S.Rangasamy College of
Technology, Nammakal, India
ABSTRACT
Image processing have a vast area under research, in which Medical Imaging is the most significant area to work in. Basically Medical Imaging can be explained as the process of creating human body images for medical and research work. For tumor detection various techniques such as MRI (Magnetic Resonance Imaging), CT (Computerised tomography) scan and Microwave are available among mentioned techniques MRI delivers the best images as it has higher resolution. The abnormalities of the bone can be identified e asily by MRI imaging. Because, the MRI images are of low contrast and contain speckle noise. The image quality may not be good for analyzing. So, to reduce speckle noise and for better analyzing, preprocessing can be done using gabor filter. To increase the contrast of the image using adaptive histogram equalization .Then segmentation method is used to segment the tumor part of bone using k -Means algorithm. Feature extraction can be used to extract and speed up the decision-making process for SVM. Finally, the output is displayed in SVM and this helps to increase the accuracy of an abnormalities. In this paper the tumor detection have been proposed using machine learning.
Keywords:
Tumor detection, Medical image, Machine learningINTRODUCTION
This Disease can begin wherever in the body. It begins when cells become crazy and group out ordinary cells. This makes it difficult for the body to work the way it should. Tumor can be dealt with extremely well for some individuals. Truth be told, more individuals than any other time in recent memory have full existences after tumor treatment. Malignancy isn't only one infection. There are many sorts of disease. It's not only one infection. Malignancy can begin in the lungs, the bosom, the colon, or even in the blood. Diseases are indistinguishable in some ways, yet they are diverse in the ways they develop and spread. Accurate segmentation of bone cancer is an important task for several medical applications.
For example, it can be helpful for therapy evaluation, treatment planning, modeling of pathological bones, etc. However, this task is a challenging problem because there is a large class of tumor types which vary greatly in size and position, have a variety of shape and appearance properties, have intensities overlapping with normal bone areas, and may deform and defect the surrounding structures. Moreover, the majority of images modalities may contain various amounts of noise and artifacts. Traditionally, bone cancers segmentation is performed manually by marking the tumor regions by a human expert. This process is time-consuming, impractical and non- reproducible. So, a semi or a fully automatic and robust segmentation is highly required in order to generate quickly satisfactory segmentation results.
2919
Vanitha K et al., Inter. J. Int. Adv. & Res. In Engg. Comp., Vol.–07(02) 2019 [2918-2924]
In general, a single medical image modality cannot provide comprehensive and accurate information, so considering more than one acquisition protocols can provide much more useful information about the bone tumor and this can be achieved through image fusion process. Such process is used to derive useful information in order to enhance and taking account the image content by fusing for example computer tomography (CT) image and magnetic resonance imaging (MRI) [1-5].
PROPOSED METHODOLOGY
In this paper a method is introduced to detect bone cancer by using machine learning algorithm. Hence in this paper a novel approach have been proposed which will comprised of the number of stages which will ultimately lead to the proper detection of enchondroma tumor i.e. bone tumor. A simple flow chart for the proposed system as follows:
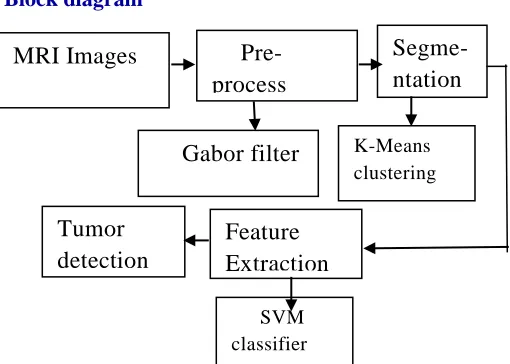
Block diagram
Fig 1.Block of Bone Tumor detection
The main objective is to detect the tumor present in the bone, but most of the times it happens that in methods of tumor detection the images obtained comes up with the greater noise factor which restrict the area to operate as it doesn’t give the exact location of tumor and the affected tissues [6].
Input Image
In this method is used to perform some operations on an image, in order to get an
enhanced image or to extract some useful information from it. It is a type of signal processing in which input is an image and output may be image or characteristics or features associated with that image. The machine learning methods classify cancer patients into high or low-risk groups. Therefore, the main aim of utilizing these techniques is to diagnose cancer and increase the efficiency of treatment and progress the speed of modelling of cancerous conditions [7-12].
MRI Images
Pre-process
Segme-ntation
Gabor filter
K-MeansFig 2. MRI input image
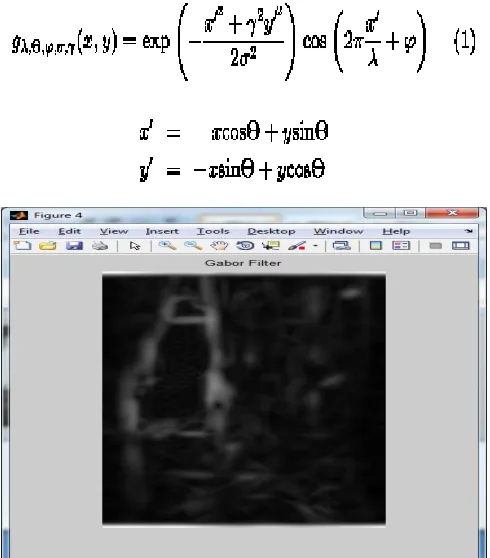
Preprocessing
The main goal of the pre-processing is to improve the image quality to make it ready for further processing by removing or reducing the unrelated and surplus parts in the background. Hence pre-processing is essential to improve the quality. Neighbouring pixels corresponding to one
object in real images have the same or similar brightness value and if a distorted pixel can be picked out from the image, it can be restored as an average value of neighbouring pixels.A gabor filter is acombination of a Gaussian filter and a sinusoidal term.
2921
Vanitha K et al., Inter. J. Int. Adv. & Res. In Engg. Comp., Vol.–07(02) 2019 [2918-2924]
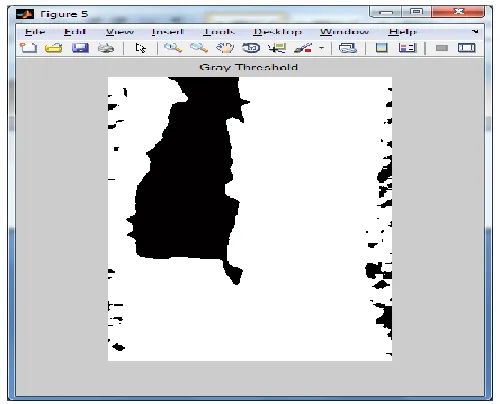
Segmentation
Image segmentation is the classification of an image into different groups. Many researches have been done in the area of image segmentation using clustering. There are different methods and one of the most popular methods is k-means clustering algorithm. K-Means clustering algorithm is an unsupervised algorithm and it is used to segment the interested area from the background. But before applying K-Means algorithm, first partial stretching enhancement is applied to the image to improve the quality of the image. So subtractive cluster is used to generate the initial centers and these centers are used in k-Means algorithm for the segmentation of image. Then finally medial filter is applied to the segmented image to remove any unwanted region from the image. But it produces different cluster result for different number of number of cluster. So it is required to initialize the proper number of cluster, k2. Again, it is required
to initialize the k number of centroid. Different value of initial centroid would result different cluster.
K-Means clustering is a method of cluster analysis which aims to partition observations into number of clusters in which each observation belongs to the cluster with the nearest mean. The steps involved in the K-Means clustering are used in this method and is described as follows. 1. Convert the subjected MRI test image from
RGB colour space to gray scale G.
2. Partition the gray scale data points to R arbitrary centroids, one for each cluster. 3. Determine new cluster centroid by calculating
the mean values of all the cluster elements. 4. Determine distance between the cluster
centroid and the cluster elements and obtain new cluster.
5. Repeat process from step (ii) till a defined number of iterations are performed.
Fig 5. Segmented image
Feature Extraction
Support Vector Machines, a method for the classification of both linear and nonlinear data. In a casing, a support vector machine (SVM) is an algorithm that works as follows. It uses a nonlinear mapping to renovate the unique training data into a higher dimension. Surrounded by this new dimension, it examines for the linear optimal separating hyperplane i.e., a “decision boundary” sorting out the tuples of one class from another.
SVM classifier finds the most appropriate separating hyper plane that maximizes the hyper plane between two classes in a dataset with two classes. To explain through an example, here used a dataset where some data samples in this dataset are used for training and the other samples are used for testing. Firstly, after finding the hyperplane using training data, the test data is then used. If the test data is located on the hyper plane, the class is included.
2923
Vanitha K et al., Inter. J. Int. Adv. & Res. In Engg. Comp., Vol.–07(02) 2019 [2918-2924]
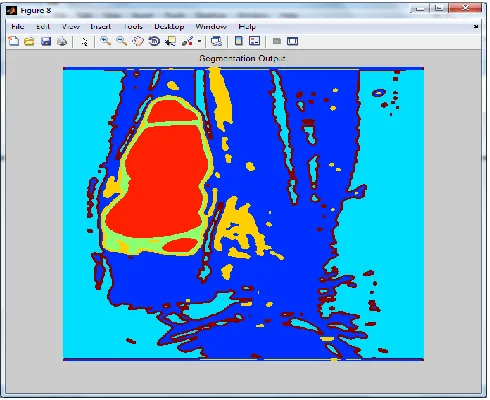
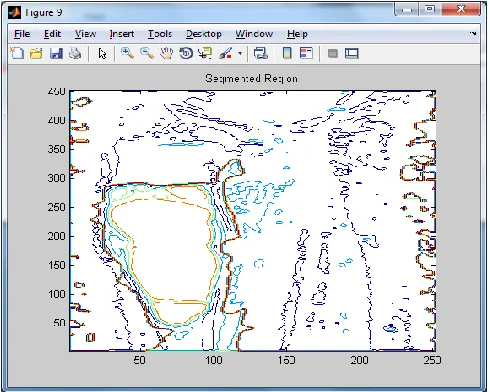
Tumor detection
The clusters with high intensity pixels are isolated from the MRI image which forms the tumor image. Some of the features like as area,
centroid and perimeter can be calculated from the tumor image.
Fig 7. Extracted region
CONCLUSION
Gabor filter is the only filter which is used to analyze the texture of the MRI image and it is also orientation-sensitive. So in preprocessing, Gabor filter is used to remove speckle noise. Then, the segmentation method was performed to segment
the tumor part from the MRI image by using k-Means algorithm. And the segmented image was obtained. After that compare the two classifiers with the accuracy of the result and finally shows the better classifier in the comparison of both the classifier with the better accuracy in the result.
REFERENCE
[1]. Krupali D. Mistry, Bijal J. Talati “ Integrated Approach for Bone Tumor Detection from MRI Scan Imagery ”on International conference on signal and Information Processing (IconSIP) 2016.
[2]. Afshan, Nailah, Shaima Qureshi, and Syed Mujtiba Hussain, “Comparative study of tumor detection algorithms”, Medical Imaging, m-Health and Emerging Communication Systems (MedCom), 2014 International Conference on. IEEE, 2014.
[3]. Kishor Kumar Reddy C, Anisha P R, Narasimha Prasad L V, “A Novel Approach for Detecting the Bone Cancer and its Stage based on Mean Intensity and Tumor Size”, Recent research in applied computer science, 2015.
[4]. Abdulmuhssin Binhssan, “Enchondroma tumor Detection”, International Journal of Advanced Research in Computer and Communication Engineering Vol. 4, Issue 6, June 2015.
[5]. Avula, Madhuri, Narasimha Prasad Lakkakula, and Murali Prasad Raja, "Bone Cancer Detection from MRI Scan Imagery Using Mean Pixel Intensity“, Modelling Symposium (AMS), 2014 8th Asia. IEEE, 2014.
[7]. R.Suganya, R.Shanthi,” Fuzzy C - Means Algorithm- A Review” International Journal of Scientific and Research Publications, Volume 2, Issue 11, November 2012.
[8]. Adele P. Peskin and Karen Kafadar, “Robust Volume Calculations Of Tumors Of Various Sizes” Scientific Application and Visualization Group National Institut e of Standards and Technology, Boulder, Colorado 80305 USA.
[9]. Soumi Ghosh, Sanjay Kumar Dubey “Comparative Analysis of K-Means and Fuzzy C-Means Algorithms”, International Journal of Advanced Computer Science and Applications, Vol. 4, No.4, 2013 [10].Reddy K. K., Anisha P. R., & Narasimha L. V., “An approach for detecting the bone cancer and its stage
based on mean intensity and tumor size”, Recent Researches in Applied Computer Science Proceedings of Acoustics, Speech, and IEEE International Conference on Signa l Processing, 2017.
[11].Avula, Madhuri, Narasimha Prasad Lakkakula, and Murali Prasad Raja. “A computer-aided diagnosis system for whole body bone scan using single photon emission computed tomography ”, modeling symposium (ams), 8, 2017.