Parametric optimization on Wire EDM for the
WPS Die Steel
Mayank M. Ghodasara Dr. D. H. Pandya
PG Student Professor
Department of Mechanical Engineering Department of Mechanical Engineering
LDRP Institute of Technology & Research,Gandhinagar LDRP Institute of Technology & Research,Gandhinagar
382015, India 382015, India
Abstract
An experimental study has conducted, in this work to determine statistical models for optimization of process parameters in wire EDM. Wire electrical discharge machining (WEDM) technology has extensively used in the field of medical, mould making, Die making , aerospace and automobile industries. WPS Die Steel(contains 1.5-1.8% carbon) is the hard material so that cutting by other machining is very difficult. But this cutting process make easy with wire EDM.WPS is widely used in making the press dies for cutting and forming operation therefore surface finishing of it is very important. The paper is focusing on to find out the combination of process parameters for optimum surface roughness and material removal rate (MRR) in wire electro discharge machining (EDM) of WPS Die Steel. The best combination of machining parameter viz. machine feed, pulse on time and pulse off time. The paper highlights the importance of process parameters and different machining conditions on MRR, surface roughness (Ra) and surface topography. In this work, machine feed, pulse on time and pulse off are input parameters and surface roughness and MRR as output parameters. The optimal values of these parameters have defined with the aim of achieving the better surface roughness and higher MRR.
Keywords: Wire EDM; WPS die Steel; MRR; Surface roughness
________________________________________________________________________________________________________
I. INTRODUCTION
Wire EDM can machine anything that is electrically conductive regardless of the hardness, from relatively common materials such as tool steel, aluminium, copper, and graphite, to exotic space-age alloys including hastaloy, waspaloy, inconel, titanium, carbide, polycrystalline diamond compacts and conductive ceramics. The wire does not touch the workpiece, so there is no physical pressure imparted on the workpiece compared to grinding wheels and milling cutters. The amount of clamping pressure required to hold small, thin and fragile parts is minimal, preventing damage or distortion to the workpiece
.
[2].Wire EDM also gives designers more latitude in designing dies, and management more control of manufacturing, since the machining is completed automatically. Parts that have complex geometry and tolerances don't require you to rely on different skill levels or multiple equipment. Substantial increases in productivity is achieved since the machining is untended, allowing operators to do work in other areas. Most machines run overnight in a "lights-out" environment. Long jobs are cut overnight, or over the weekend, while shorter jobs are scheduled during the day. Most workpieces come off the machine as a finished part, without the need for secondary operations. It's a one-step process.
Wire EDM Principle:
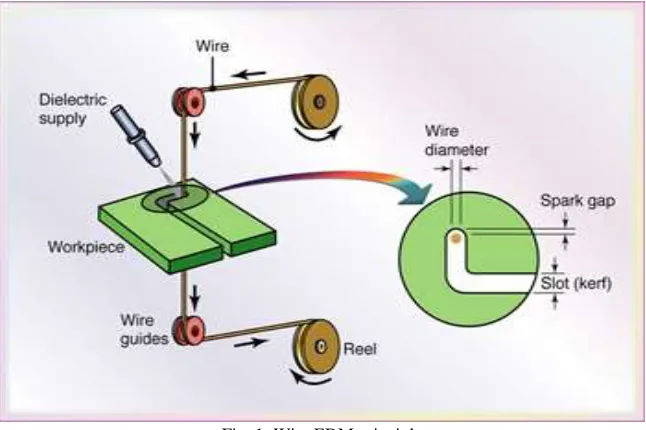
Fig. 1: Wire EDM principle
D.C servo motors. The travelling wire is continuously fed from wire feed spool and collected on take up spool which moves though the work piece and is supported under tension between a pair of wire guides located at the opposite sides of the work piece. The lower wire guide is stationary whereas the upper wire guide, supported by the U-V table, can be displaced transversely along U and V-axis with respect to lower wire guide. The upper wire guide can also be positioned vertically along Z-axis by moving the quill.Working principle is shown in Fig.1 [2].
A series of electrical pulses generated by the pulse generator unit is applied between the work piece and the travelling wire electrode, to cause the electro erosion of the work piece material. As the process proceeds, the X-Y controller displaces the worktable carrying the work piece transversely along a predetermined path programmed in the controller. While the machining operation is continuous, the machining zone is continuously flushed with water passing through the nozzle on both sides of work piece. Since water is used as a dielectric medium, it is very important that water does not ionize. Therefore, in order to prevent the ionization of water, an ion exchange resin is used in the dielectric distribution system to maintain the conductivity of water [2].
Material selection(WPS Die Steel)
Fig. 2:
Chemical Composition:
Table – 1
Composition of WPS Die Steel Material Elements Weight Limits % Actual Weight %
C 1.5-1.8 1.5
Ch 10-12 12
V 1.00-2.15 1.00
Wire Material:
The copper wire had been used for the experiment and its chemical composition is CuZn37%. Property of copper soft wire
- Prevent brass powder sticking - Reduce wire breakage - Excellence straightness - Wire dia=0.10-0.30mm
- Tensile strength=440-540 N/mm2 - Elongation=20%
Experimental setup
This experiment had been performed at swastika wire cut-rajkot. The ECOCUT wire EDM had been used for experiment. The machine specification for the particular machine is describing in below table no 2.
Table – 2
Technical Specification of wire EDM machine
Model Specification
Table size 440*650 mm
Max work piece height 200 mm Max work piece weight 500 kg Main table traverse(x,y) 300*400 mm Aux. table traverse(u,v) 80*80 mm
Max taper angle +_300/50 mm
Max JOG speed 900 mm/min
Resolution 0.0005 mm
Max wire spool capacity 6 kg Wire electrode diameter 0.25mm
Cooling system 1700 kcal
Input power supply 3 phase, AC 415 V , 50Hz
Wire EDM variables and their levels.
Table – 3 Input parameters and levels
Symbol Input Parameters Level 1 Level 2 Level 3 A Pulse on time(µs) 112 116 120 B Pulse off time(µs) 50 55 60
C Machine Feed 0.6 0.9 1.2
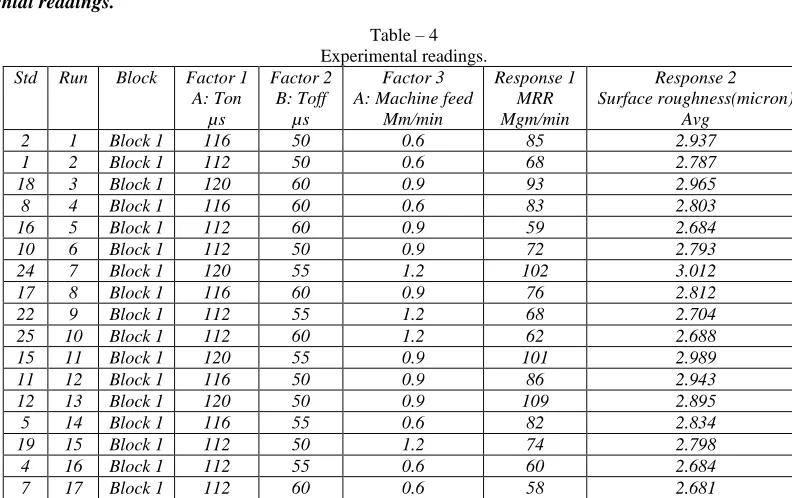
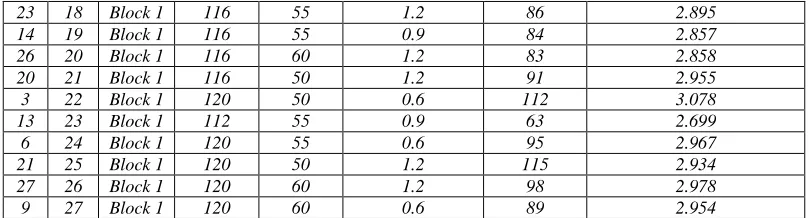
Experimental readings.
Table – 4 Experimental readings. Std Run Block Factor 1
A: Ton µs Factor 2 B: Toff µs Factor 3 A: Machine feed
Mm/min Response 1 MRR Mgm/min Response 2 Surface roughness(micron) Avg
2 1 Block 1 116 50 0.6 85 2.937
1 2 Block 1 112 50 0.6 68 2.787
18 3 Block 1 120 60 0.9 93 2.965
8 4 Block 1 116 60 0.6 83 2.803
16 5 Block 1 112 60 0.9 59 2.684
10 6 Block 1 112 50 0.9 72 2.793
24 7 Block 1 120 55 1.2 102 3.012
17 8 Block 1 116 60 0.9 76 2.812
22 9 Block 1 112 55 1.2 68 2.704
25 10 Block 1 112 60 1.2 62 2.688
15 11 Block 1 120 55 0.9 101 2.989
11 12 Block 1 116 50 0.9 86 2.943
12 13 Block 1 120 50 0.9 109 2.895
5 14 Block 1 116 55 0.6 82 2.834
19 15 Block 1 112 50 1.2 74 2.798
23 18 Block 1 116 55 1.2 86 2.895
14 19 Block 1 116 55 0.9 84 2.857
26 20 Block 1 116 60 1.2 83 2.858
20 21 Block 1 116 50 1.2 91 2.955
3 22 Block 1 120 50 0.6 112 3.078
13 23 Block 1 112 55 0.9 63 2.699
6 24 Block 1 120 55 0.6 95 2.967
21 25 Block 1 120 50 1.2 115 2.934
27 26 Block 1 120 60 1.2 98 2.978
9 27 Block 1 120 60 0.6 89 2.954
ANOVA for Material Removal Rate.
Table – 5 ANOVA response for MRR
Sum of Mean F p-value
Source Squares df Square Value Prob > F
Model 7652.222 18 425.1235 402.7485 < 0.0001 significant A-Ton 6460.222 2 3230.111 3060.105 < 0.0001
B-Toff 881.5556 2 440.7778 417.5789 < 0.0001 C-M/C FEED 162.6667 2 81.33333 77.05263 < 0.0001 AB 146.8889 4 36.72222 34.78947 < 0.0001 AC 0.444444 4 0.111111 0.105263 0.9774 BC 0.444444 4 0.111111 0.105263 0.9774 Residual 8.444444 8 1.055556
Cor Total 7660.667 26
The Model F-value of 402.75 implies the model is significant. There is only a 0.01% chance that a "Model F-Value" this large could occur due to noise. Values of "Prob > F" less than 0.0500 indicate model terms are significant. In this case A, B, C, AB are significant model terms.
Std. Dev. 1.027402 R-Squared 0.998898 Mean 89.77778 Adj R-Squared 0.996417 C.V. % 1.144384 Pred R-Squared 0.987444 PRESS 96.1875 Adeq Precision 70.64844 Final Equation in Terms of Coded Factors:
MRR =+89.78-18.89 * A[1]-0.11 * A[2]+7.44 * B[1]-1.00 * B[2]-2.89* C[1]-0.22* C[2]-0.67 * A[1]B[1]-3.44 * A[2]B[1]-0.56 * A[1]B[2]+1.33 * A[2]B[2]+0.000* A[1]C[1] +0.22 * A[2]C[1]+0.000 * A[1]C[2]-0.11 * A[2]C[2]+0.000
* B[1]C[1]+0.11* B[2]C[1] +0.000* B[1]C[2]+0.11 * B[2]C[2]
ANOVA for Surface Roughness:
Table – 6
ANOVA for Surface roughness
Sum of Mean F p-value
Source Squares df Square Value Prob > F
Model 0.346279333 18 0.019237741 15.89458062 0.0002 significant A-Ton 0.286843556 2 0.143421778 118.4977508 < 0.0001
B-Toff 0.028250889 2 0.014125444 11.67070596 0.0042 C-M/C FEED 0.001902889 2 0.000951444 0.786101166 0.4879 AB 0.016875556 4 0.004218889 3.485724777 0.0626 AC 0.005272889 4 0.001318222 1.089139815 0.4235 BC 0.007133556 4 0.001783389 1.4734692 0.2964 Residual 0.009682667 8 0.001210333
Cor Total 0.355962 26
The Model F-value of 15.89 implies the model is significant. There is only a 0.02% chance that a "Model F-Value" this large could occur due to noise. Values of "Prob > F" less than 0.0500 indicate model terms are significant. In this case A, B are significant model terms. Values greater than 0.1000 indicate the model terms are not significant.
Std. Dev. 0.034789845 R-Squared 0.972798595 Mean 2.858666667 Adj R-Squared 0.911595432 C.V. % 1.21699552 Pred R-Squared 0.690158992 PRESS 0.110291625 Adeq Precision 12.35068145
The "Pred R-Squared" of 0.6902 is not as close to the "Adj R-Squared" of 0.9116 as one might normally expect. This may indicate a large block effect or a possible problem with your model and/or data. Things to consider are model reduction, response tranformation, outliers, etc.
Final Equation in Terms of Coded Factors:
SR AVG =+2.86-0.13* A[1]+0.018 * A[2]+0.044 * B[1]-9.667E-003* B[2] -3.333E-004 * C[1] -0.010 * C[2]+0.025 * A[1]B[1] +0.024 * A[2]B[1] -0.019* A[1]B[2] -5.444E-003 * A[2]B[2]-6.556E-003
* A[1]C[1]-0.019* A[2]C[1] +0.011 * A[1]C[2] +3.667E-003* A[2]C[2] +0.032 * B[1]C[1] -0.020 * B[2]C[1]-0.015 * B[1]C[2] +9.444E-003 * B[2]C[2]
II. CONCLUSION
By performing and analysing the experiment we can conclude that the input parameter such as Ton ,Toff , machine feed are effect on material WPS Die Steel differently with output parameters(MRR and SR).
- With increasing Ton time, MRR and SR are increase. - With increasing Toff time, MRR and SR are decrease. - With increasing machine feed, MRR and SR are increase.
- By optimising ,For getting maximum MRR and better surface roughness the input values are Ton=116µs,Toff=55 µs,machine feed=0.6.
- In this experiment the maximum MRR is 123 mgm/min and Average surface roughness is 2.681 micron.
REFERENCES
[1] Aniza Aliasa, Bulan Abdullaha, Norliana Mohd Abbasa, Influence of machine feed rate in wedm of titanium ti-6al-4v with constant current (6a) using brass wire, iris 2012, Procedia Engineering 411806 – 1811
[2] C. Bhaskar Reddy1 G. Jayachandra Reddy2, C. Eswara Reddy,Growth of Electrical Discharge Machining and Its Applications – A Review ,IJERD, Volume 4, Issue 12 (November 2012), PP. 13-22
[3] Hsien-Ching Chen a, Jen-Chang Lin b, Yung-Kuang Yang b, Chih-Hung Tsai c, Optimization of wire electrical discharge machining for pure tungsten using a neural network integrated simulated annealing approach,, Expert Systems with Applications 37 (2010) 7147–7153
[4] Milan Kumar Dasa, Kaushik Kumarb, Tapan Kr. Barmana and Prasanta Sahooa, Application of Artificial bee Colony Algorithm for Optimization of MRR and Surface Roughness in EDM of EN31 tool steel, ICMPC 2014, Procedia Materials Science 6 ( 2014 ) 741 – 751
[5] Amitesh Goswami, Jatinder Kumar, Optimization in wire-cut EDM of Nimonic-80A using Taguchi's approach and utility concept, Engineering Science and Technology, an International Journal 17 (2014) 236e246
[6] Zahid A. Khana, Arshad N. Siddiqueea, Noor Zaman Khana , Urfi Khanb, G. A. Quadirc, Multi response optimization of Wire electrical discharge machining process parameters using Taguchi based Grey Relational Analysis, ICMPC 2014, Procedia Materials Science 6 ( 2014 ) 1683 – 1695
[7] Shajan Kuriakose, M.S. Shunmugam, Multi-objective optimization of wire-electro discharge machining process by Non-Dominated Sorting Genetic Algorithm, Journal of Materials Processing Technology 170 (2005) 133–141
[8] Ibrahem Maher a, Liew Hui Lingb, Ahmed A. D. Sarhan c,, M. Hamdi d, Improve wire EDM performance at different machining parameters – ANFIS modeling , IFAC-PapersOnLine 48-1 (2015) 105–110
[9] Aminollah Mohammadi, Alireza Fadaei Tehrani, Ehsan Emanian, Davoud Karimi, Statistical analysis of wire electrical discharge turning on material removal rate, journal of materials processing technology 2 0 5 ( 2 0 0 8 ) 283–289
[10] Rajarshi Mukherjee, Shankar Chakraborty, Suman Samanta, Selection of wire electrical discharge machining process parameters using non-traditional optimization algorithms, Applied Soft Computing 12 (2012) 2506–2516
[11] V. Chengal Reddya, N. Deepthib, , N.Jayakrishnac, Multiple Response Optimization of Wire EDM on Aluminium HE30 by using Grey Relational Analysis,4thICMPC, Materials Today: Proceedings 2 ( 2015 ) 2548 – 2554
[12] S. Sarkar, S. Mitra, B. Bhattacharyya, Parametric analysis and optimization of wire electrical discharge machining of -titanium aluminide alloy, Journal of Materials Processing Technology 159 (2005) 286–294
[13] D.Sudhakaraa,G.Prasanthib, Application of Taguchi Method for Determining Optimum SurfaceRoughness in Wire Electric Discharge Machining of P/M Cold Worked Tool Steel (Vanadis-4E), GCMM 2014, Procedia Engineering 97 ( 2014 ) 1565 – 1576