MUHAMMAD ADNIN BIN MAT BAHARI
A report submitted in partial fulfilment of the requirements for the award of the degree of
Bachelor of Mechanical Engineering
Faculty of Mechanical Engineering UNIVERSITI MALAYSIA PAHANG
ABSTRACT
An open-loop low-speed wind tunnel is one of the easiest ways to study about aerodynamics for undergraduate studies. The objectives of this project are to propose a design with detail analysis, fabrication of a small scale open-loop low-speed wind tunnel and to validate the designed wind tunnel through performance testing with the existing instrumentations available in the laboratory. The wind tunnel was designed by considering the essential parts of the wind tunnel with the proper justifications before modelled with Computer Aided Design (CAD) and then tested using the Computational Fluid Dynamics (CFD). After obtaining the desired simulation result, the designed wind tunnel was fabricated and then followed by the test models. Then the wind tunnel undergoes the performance testing for validation and calibration. For the Ahmed Body flow pattern testing, the flow behaves just like the flow pattern tested in calibrated wind tunnel. For the case study testing, a cylinder model was used and the highest flow speed is 0.4317 m/s while the slowest flow speed is 0.1401 m/s. However for the case study experiment, the result obtained is not at its best condition as there is wake flow generated around the cylinder body and further improvement is required to obtain the undoubtedly results.
ABSTRAK
Terowong angin terbuka berhalaju rendah adalah salah satu daripada cara yang termudah untuk mempelajari perkara yang berkenaan dengan aerodinamik. Objektif untuk projek ini adalah untuk menghasilkan rekaan yang teliti dan membina terowong angin terbuka serta menguji keupayaan terowong angin tersebut dengan kelengkapan yang ada di makmal. Terowong angin tersebut direka dengan mengambil kira justifikasi-justifikasi yang betul pada bahagian-bahagian yang penting sebelum dimodelkan dengan Computer Aided Design (CAD) dan disimulasikan dengan menggunakan Computational Fluid Dynamics (CFD). Setelah mendapatkan keputusan simulasi yang diingini, terowong angin terus dibina dan diikuti oleh model ujian. Kemudian terowong angin tersebut diuji untuk penilaian keupayaan supaya setaraf dengan terowong angin yang telah lulus penilaian. Untuk eksperimen corak arus menggunakan Ahmed Body, corak arus yang diperolehi menunjukkan ciri-ciri persamaan yang ketara dengan corak arus yang diperoleh melalui model yang diuji dengan terowong angin yang ideal. Untuk kajian kes, model silinder telah digunakan dan halaju arus yang paling tinggi adalah 0.4317 m/s manakala halaju arus yang paling rendah adalah 0.1401 m/s. Walaubagaimanapun, eksperimen bagi kajian kes, bacaan-bacaan yang diperolehi adalah bukan bacaan-bacaan yang terbaik kerana terdapat arus tidak stabil terhasil di sekeliling model silinder dan beberapa penambahbaikan perlu dilakukan untuk mendapatkan keputusan kajian yang tidak diragui.
TABLE OF CONTENTS Page SUPERVISOR’S DECLARATION ii STUDENT’S DECLARATION iv DEDICATION v ACKNOWLEDGEMENTS vi ABSTRACT vii ABSTRAK viii
TABLE OF CONTENTS viii
LIST OF FIGURES xiii
LIST OF TABLES xv
LIST OF SYMBOLS xvi
LIST OF ABBREVIATIONS xvii
CHAPTER 1 INTRODUCTION
1.1 Project Background 1
1.2 Problem Statement 1
1.3 Project Objective 2
1.4 Scope of study 2
CHAPTER 2 LITERATURE REVIEW
2.1 Introduction 3
2.2 Design of wind tunnel 2.2.1 Theory of wind tunnel 2.2.2 Bernoulli’s principle
2.2.3 Effect of flow and pressure on Bernoulli’s Principal
3 4 4 8
2.2.4 Reynold’s number effect 2.2.5 Wind tunnel classification 2.2.6 Speed regime 2.2.7 Tunnel geometry 2.2.8 Working fluid 9 9 10 11 12 2.3 2.4
Fabrication of wind tunnel 2.3.1 Design parameters 2.3.2 Contracting cone 2.3.3 Honeycomb 2.3.4 Testing chamber 2.3.5 Diffuser
Testing of wind tunnel 2.4.1 Ahmed Body Theorem 2.4.2 Pressure measurement 13 13 14 15 16 17 17 18 19 2.5 Summary 20 CHAPTER 3 METHODOLOGY 3.1 Introduction 22
3.2 Flow chart of study 22
3.3 Conceptual study 24
3.4 Design method
3.4.1 Contracting cone design
24 25 3.5 Design justification
3.5.1 Item consideration
3.5.2 Contracting cone dimensions 3.5.3 Entrance length formula,El 3.5.4 Contraction ratio, c 28 28 28 28 30 3.6 Design Analysis 31
3.7 Model selection 3.7.1 Ahmed Body
3.7.2 Case study: Cylinder
31 32 32 3.8 3.9 3.10 Fabrication process 3.8.1 Wind tunnel
3.8.2 Position of model testing
3.8.3 Position of smoke generator outlet Experimental technique Simulation technique 32 33 35 36 36 37
CHAPTER 4 RESULTS AND DISCUSSIONS
4.1 4.2
Introduction
Selection of contracting cone 4.2.1 Contracting cone 4.2.2 Testing chamber 4.2.3 Honeycomb effect 41 41 41 47 50 4.3 Calculation of Reynolds number
4.3.1 Reynold’s number of Ahmed Body and cylinder model
51 52 4.4 Ahmed Body analysis
4.4.1 Analysis on front part 4.4.2 Analysis on slant angle
52 52 53 4.5 Discussion on Ahmed Body
4.5.1 Smoke generator 4.5.2 Air gaps 4.5.3 Honeycomb alignment 4.5.4 Summary 55 55 55 56 44 56
4.6
4.7
Cylinder Model Analysis 4.6.1 Introduction 4.6.2 Result
Discussion on case study 4.7.1 Wake region 56 56 57 58 59 CHAPTER 5 CONCLUSION 5.1 Conclusions 60 5.2 Recommendations 5.2.1 Material change 5.2.2 Fan change 5.2.3 Portability 5.2.4 Adjustable cone 61 61 61 61 62 REFERENCES 63 APPENDIX
Appendix A: Isometric wind tunnel
65
66
LIST OF FIGURES
Figure No. Title Page
2.1 2.1(a) 2.1(b) 2.1(c)
A pitot tube system
Subsonic wind tunnel system Supersonic wind tunnel system Hypersonic wind tunnel system
7 10 10 10 2.2(a) 2.2(b)
A conceptual diagram of an open-loop wind tunnel A conceptual diagram of a closed-loop wind tunnel
11 12
2.3 Water tunnel system 13
2.4 Open-loop and closed-loop wind tunnel comparison diagram 14
2.5 Wooden contracting cone 15
2.6 Honeycomb (air flow straightener) 16
2.7 Testing chamber of a wind tunnel 16
2.8 Diffuser diagram of a wind tunnel 17
2.9 Vortex region of an Ahmed Body 19
2.10 Multi-tube manometer at Fluid Mechanics Laboratory 20
3.1 Project flow chart diagram 23
3.2 6:1 contracting cone 25 3.3 8:1 contracting cone 26 3.4 3.5 3.6(a) 3.6(b) 3.6(c) 9:1 contracting cone
The dimension of Ahmed Body model. A completed wind tunnel
A testing chamber A honeycomb (329 cells) 27 32 34 35 35 3.6(d) 3.6(e)
An axial exhaust fan
A set of a hot-wire anemometer
35 35
.
3.7(a) A side view of the model 36
3.7(b) A top view of the model 36
3.8 3.9 3.10 3.11
An anemometer sensor inside the test section Computational domain and boundary condition Grid refinement around the Ahmed body model
A velocity testing using Solidworks 2011 Flow Simulation
37 38 39 40 4.1(a) Air flow speed simulation for 6:1 contracting cone 42 4.1(b) Air flow pressure simulation for 6:1 contracting cone 42 4.2(a)
4.2(b)
Graph of Air Flow Speed against Points Graph of Air Flow Pressure against Points
44 45 4.3 4.4 4.5 4.6(a) 4.6(b) 4.7 4.8(a) 4.8(b) 4.9(a) 4.9(b) 4.10
Pressure distribution points inside the testing chamber
Graph of pressure distribution against points inside the testing chamber
An isometric view of the designed honeycomb The velocity cutplot of the hexagonal honeycomb The Pressure cutplot of the hexagonal honeycomb The position of the Ahmed Body before the experiment Smoke flow pattern at the slant surface and rear surface (Top view)
Smoke flow pattern at the slant surface and rear surface (Side view)
High drag flow structure Low drag flow structure
The graph of velocity, m/s versus the points at 2.0 m/s velocity of air flow 47 48 50 50 51 53 53 53 54 54 58
LIST OF TABLES
Table No. Title Page
4.1 4.2 4.3 4.4 4.5 4.6
Air flow speed and pressure distribution for 6:1, 8:1 and 9:1 cone Table of pressure difference inside contracting cones
The air flow pressure distributions inside every contracting cone Reynold’s Number for Ahmed Body and Cylinder model
Reynold’s Number and drag coefficient for cylinder Velocity at V = 2.0 m/s 43 46 48 52 56 57
LIST OF SYMBOLS
Re Reynolds Number
v
V, Fluid velocity
D Lateral dimension (diameter) L Lateral dimension (length) Kinematic viscosity of fluid
Dynamic viscosity of fluid
Fluid density El Le Cr m cm mm º C Entrance length Length of entrance Contraction ratio meter centimeter milimeter Degree Celsius
LIST OF ABBREVIATIONS
CAD Computer-Aided Design
CFD Computational fluid dynamic CR 3D 2D Contraction ratio 3 Dimensional 2 Dimensional
1.1 PROJECT BACKGROUND
The process for design, fabrication, and testing of an open-loop low-speed wind tunnel is discussed in this report. Important parameters in design and analysis of the small scale wind tunnel will also be presented in this chapter.
Commonly, the wind tunnel is widely used in laboratory research as well as for automotive and aeronautics industries. For instance, wind tunnel is used to enhance the performance of cars such as the new development of windshield or front bumper for better fuel efficiency and also to reduce the wind-noise. Moreover, another advantage of using wind-tunnels is the experiments can be performed under well controlled steady flow circumstances compared to experiments in the open environment. Before the wind tunnel can be used to carry out experiment, it must have instrument devices to measure the system for the wind tunnel. Generally, series of studies had been conducted in this project to make sure that the wind tunnel can carry out the experiment with the aid of several devices to be attached to the wind tunnel to come up with reliable results.
1.2 PROBLEM STATEMENT
Previously, there is no reliable small scale suction type have been developed in UMP. However, there is one discharge type wind tunnel that is available in the laboratory. But, the air flow generated inside the wind tunnel is interrupted by the fan’s blade that caused the air flow to be unsteady flow. According to aerodynamic study, the
1.3 PROJECT OBJECTIVE The objectives of this project are:
(i) To propose a design, fabricate and perform detail analysis of an open-loop low-speed wind tunnel.
(ii) To validate the performance of the designed wind tunnel through the testing with the existing instrumentations available in the laboratory.
1.4 SCOPE OF STUDY
The scope of this project consists of:
(i) Detail design and analysis about an open-loop low-speed wind tunnel. The detail design consists of the justification of every essential part of the wind tunnel such as the contracting cone, honeycomb, testing section, axial fan and also the diffuser.
(ii) Computational Fluid Dynamic (CFD) to aid the designation of the wind tunnel. In this project, the CFD software used is Solidworks Flow Simulation 2011.
(iii) Validation and calibration of the designed wind tunnel using Ahmed Body and cylinder model.
CHAPTER 2
LITERATURE REVIEW
2.1 INTRODUCTION
In the nineteenth century, the astronauts to-be had studied the flight principles of the birds in order to design an aircraft. Then, humans start to make many kinds of flying machines and aviation structures. Carrying a big hope, a birdlike structure was repetitively constructed and tested in order to bring human to fly like birds. Unfortunately, the flying structure was failed each time it was tested. Soon after that, various approaches of aerodynamic studies were carried out to improvise the flying machine. Before the existence of wind tunnel, the whirling arm was used to study the air flow behavior on aircraft surfaces. The whirling arm allows people to study about the aerodynamic factors that should be emphasized in aircraft design by moving the aircraft part around in normal atmospheric condition. However, to enhance the result of the study, a better device needs to be designed. Until 1871, Frank Wenham, a Council Member of the Aeronautical Society of Great Britain, designed and operated the first wind tunnel using a steam engine powered blower fan. This first achievement of wind tunnel construction triggered a rapid development of aerodynamic study on aircraft model until now.
2.2 DESIGN OF WIND TUNNEL
In order to construct a reliable open-loop low-speed wind tunnel, the studies about designation of wind tunnels have to be carried out to avoid from making any mistakes while designing, fabricating and also testing the wind tunnel.
According to Woodford (2011) in his journal, the basic idea of a wind tunnel is crude and simple. It is like a huge pipe that wraps around on itself in a circle or square with a fan in the middle. Then, switch on an axial fan and the air flow will flowing through it. After that, place a little door so that a model can get in a test room in the middle of the pipe and there is a wind tunnel.
In practice, it is a bit more sophisticated than that. Instead of being uniformly shaped all the way round, the pipe is wider in some places and much narrower in others. Where the pipe is narrow, the air has to speed up to get through. The narrower the pipe, the faster it has to go. It works just like a bicycle pump, where the air speeds up when you force it out through the narrow nozzle, and like a windy valley where the wind blows much harder, focused by the hills on either side.
Aerodynamicists use wind tunnels to test models of proposed aircraft. In the tunnel, the engineer can carefully control the flow conditions which affect forces on the aircraft. By making careful measurements of the forces on the model, the engineer can predict the forces on the full scale aircraft. And by using special diagnostic techniques, the engineer can understand and improve the performance of the aircraft.
Wind tunnels are designed for a specific purpose and speed range and there is a wide variety of wind tunnel types and model instrumentation. The model to be tested in the wind tunnel is placed in the test section of the tunnel. The speed in the test section is determined by the design of the tunnel. The choice of speed range affects the design of the wind tunnel due to compressibility effects.
2.2.2 Bernoulli’s principle
The relationship between the velocity and pressure effects by a moving liquid is described by the Bernoulli's principle which states that as the velocity of a fluid increases, the pressure exerted by that fluid decreases. This principle is valid for both liquid and gas. Airplanes get a part of their lift by taking advantage of Bernoulli's
through a pipe to the cross sectional area of the pipe. It says that as a radius of the pipe decreases the speed of fluid flow must increase and vise-versa.
In practice, for inviscid incompressible (i.e., ignoring the effects of viscosity and assuming density is constant) follow the principle of continuity and the Bernoulli equation become useful in determining average flow properties along a streamline. Time-average velocity measurements can be made with a pitot-static tube. The operation of a pitot-static tube is based upon the Bernoulli equation which for a steady incompressible flow takes the form. The Bernoulli’s principle states for a fluid flowing at a certain velocity, pressure surrounding this fluid will be decreased. The explanation of the principle can be seen through its equation, the Bernoulli equation. This equation is an approximate relation between pressure, velocity and elevation. It is valid in regions of steady, incompressible flow where net frictional forces are negligible. The Bernoulli equation can be stated as:
The continuity equation is given by Equation 2.1 as below:
AV = Constant → dA
A = -dV
V
Equation 2.1 is the continuity equation that representing the nature law of air velocity when the air flowing through a pipe or duct. The increment of the flowing area will cause the air velocity to decrease. The decrement of air velocity will occur along the increment of the passing area. In other word, the air velocity is inversely proportional to the passing area in a pipe or duct. This equation is required while designing the wind tunnel as the equation proving that the area factor is very important in designing the contracting cone and the diffuser.
V
m2 = 2 C 2 C2-1 Psettling - pm ρ ≈ 2 Δp ρThe Bernoulli equation can be obtained or derived by applying the conservation of linear momentum principle. The key approximation in the derivation of the Bernoulli equation is that viscous effects are negligibly small compared to inertial, gravitational and pressure effects. In theory, this fluid is called inviscid fluid.
The operation of a pitot-static tube is based upon the Bernoulli equation which for a steady incompressible flow takes the form. The Bernoulli’s principle states for a fluid flowing at a certain velocity, pressure surrounding this fluid will be decreased. The explanation of the principle can be seen through its equation, the Bernoulli equation. This equation is an approximate relation between pressure, velocity and elevation. It is valid in regions of steady, incompressible flow where net frictional forces are negligible. The Bernoulli equation can be stated as Equation 2.3:
P ρg
+
v2 2g+ z= constant Where, P ρg= static head z= elevation v2 2g= dynamic headFrom that equation, the proper manner of understanding about the flow speed of wind tunnel at each point is:
(2.2)
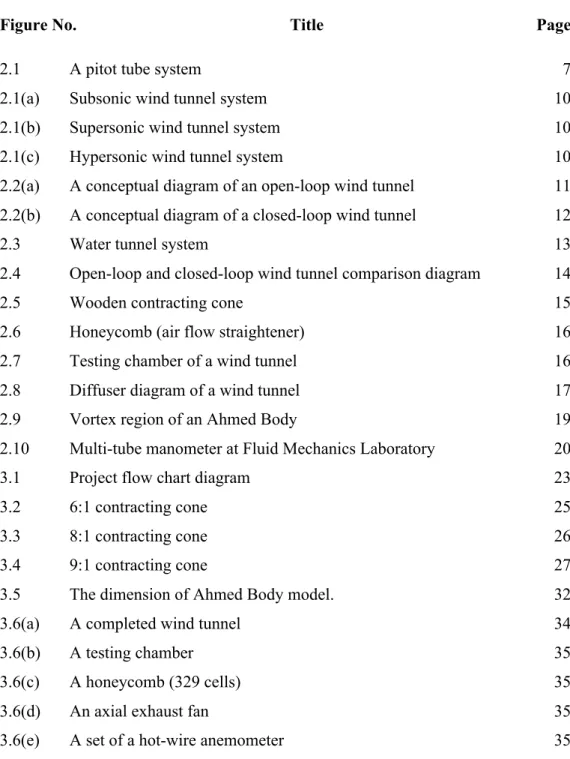
Figure 2.1:A pitot tube system Source: Pitot, 1732
From the figure 2.1, there are Point 1 and Point 2 at in front of the pitot tube. Stagnation points exist at the surface of objects in the flow field, where the fluid is brought to rest by the object.
P1 ρ
+
v12 2+
gZ1=
P2 ρ+
v22 2+
gZ2 Where,v
2= 0
Z1=
Z2 P2-P1 ρ + v22-v12 2 = 0 Point 1 (2.4) (2.5)Hence, this static pressure is called the stagnation pressure. Point 2 is at the stagnation point where the velocity is at that point is 0. Stagnation pressure is equal to the dynamic pressure plus static pressure. Hence, the total pressure is equal to dynamic 8 pressures plus static pressure so, in incompressible flows, stagnation pressure is equal to total pressure.
The pressure at Point1 and Point 2 can be measure with using hydrostatics equation, which shown in Equation (2.6.a) and (2.6.b):
P1 = Patm+ gℎ ; P2 = Patm+ gℎ ,
The Bernoulli equation could obtained or derived the by applying the conservation of linear momentum principle. The key approximation in the derivation of the Bernoulli equation is that viscous effects are negligibly small compared to inertial, gravitational and pressure effects. In theory, this fluid is called in viscid fluid.
2.2.3 Effect of flow and pressure on Bernoulli’s Principal
Factor that occur the concept of Bernoulli’s Principal is when the speed of a liquid or gas is low, the pressure is high, and where the speed of a liquid or gas is high, the pressure is low. Then, the speed a moving fluid or gas has an effect on the pressure exerted by the fluid decreases. As the speed of a moving liquid or gas increase, the pressure within that fluid decreases. When flow speed is at high velocity, liquid or gas trade their kinetic energy for pressure. Last factor for the drag characteristic is the faster velocities exert less pressure than slow moving velocities. (Kenneth Leet, Chia-Ming Uang. 2004).
(2.6.a) (2.6.b)
Osborne Reynolds first introduced the dimensionless constant that bears his name in his 1883, in a paper he published in the Philosophical Transactions of the Royal Society. The paper, “An Experimental Investigation Of The Circumstances Which Determine Whether Motion Of Water Shall Be Direct Or Sinuous And Of The Law Of Resistance In Parallel Channels”, detailed the findings of his experimental work.
The vortex shedding from a bluff body is a function of the Reynolds Number (Re). The flow characteristics of wind passing across bluff body are depend on how the magnitude of inertial to viscous within the flow.
The Reynolds Number is defined as:
= or = ρVL
μ
Where,
V= the wind velocity, D or L is the lateral dimension of the body,
υ= kinematics viscosity of air,
μ= dynamic viscosity of air,
ρ = density of air
2.2.5 Wind tunnel classification
There are great deals of way to classify the wind tunnel. Several types of wind tunnel have been invented for various functions toward the study of aerodynamic. The variously types of wind tunnel are actually the evolution of the subsonic wind tunnel. Then, the existence of other wind tunnel starts to take place in aerodynamic research. Basically, the wind tunnel can be classified by its speed regime, tunnel geometry and also the working fluid in the tunnel.
Wind tunnels are often denoted by the speed in the test section relative to the speed of sound. The ratio of the air speed to the speed of sound is called the Mach number. Tunnels are classified as subsonic (M < 0.8), transonic (0.8 < M < 1.2), supersonic (1.2 < M < 5.0) , or hypersonic (M > 5.0). The distinction of Mach number is caused by the relative importance of compressibility effects. For subsonic flows, the effects of compressibility may be neglected; for transonic and supersonic flows, compressibility effects must be considered. For hypersonic flows, we must make additional considerations for the chemical state of the gas. The scaling effects of the Mach number can be theoretically derived from the conservation of momentum of the air in the tunnel. Compressibility affects the design of the test section of a wind tunnel: for subsonic tunnels, the test section has the smallest cross-sectional area of the tunnel; for supersonic tunnels, the throat of the nozzle has the smallest area and the test section area is chosen to achieve a desired Mach number in the test section. The wind tunnels are shown in Figure 2.1(a) through 2.1(c).
Figure 2.1(a):A subsonic wind tunnel. Figure 2.1(b):Supersonic wind tunnel.
Figure 2.1(c) :A closed loop hypersonic wind tunnel. Source: Benson, 2009
Tunnel Geometry is one of the big factors to classify the wind tunnel. Actually the wind tunnel geometry can be separated in to two sections, an open-loop and a closed-loop wind tunnel.
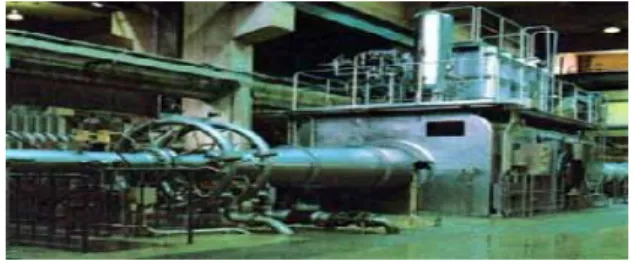
For an open-loop wind tunnel as shown in Figure 2.2(a), the air exhausted from the diffuser did not used back into the next cycle of the flow generation, instead, the air sucked from the contracting cone is the fresh air from the surrounding air that does not under goes any compression or heating. Tom Benson (2009) states that, “A wind tunnel that is open on both ends and draws air from the room into the test section is called an open return tunnel”. The advantages of the open-loop wind tunnel is the reduction in the cost of construction as there is no heat exchanger needed for the next cycle of flow generation. In addition, the materials used are lesser as there is no ducts construction needed to connect from the tunnel’s diffuser to its contracting cone. As for the closed-loop wind tunnel as shown in Figure 2.2(b), the geometry is very different from the open-loop wind tunnel. Closed-loop or as known as closed return wind tunnel requires a duct construction to connect the diffuser back to the entrance of the contracting cone. Heat exchanger is needed in this tunnel construction in order to reduce the air temperature to be used back in the next cycle of flow generation after the air temperature is slightly rose after being compressed by the fan.
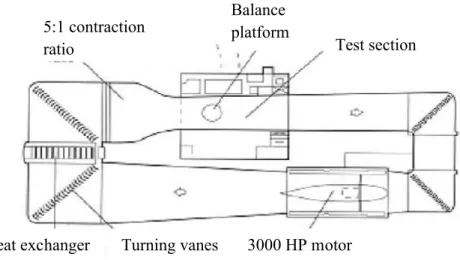
Figure 2.2(a) :A conceptual diagram of an open-loop wind tunnel. Source: Kasravi, 2004
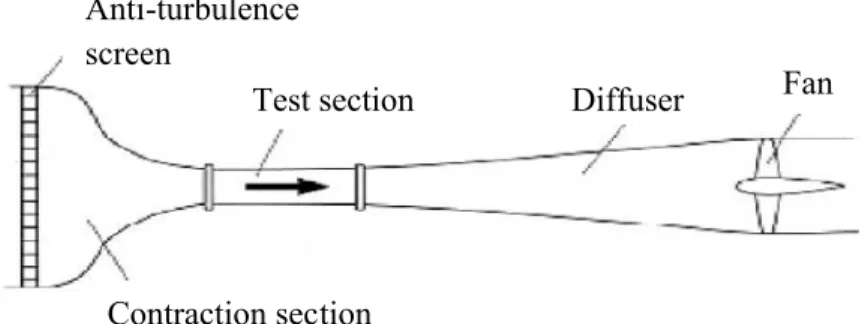
Anti-turbulence screen
Test section Diffuser Fan
Figure 2.2(b) :A conceptual diagram of a closed-loop wind tunnel. Source: Kasravi, 2004
2.2.8 Working Fluid
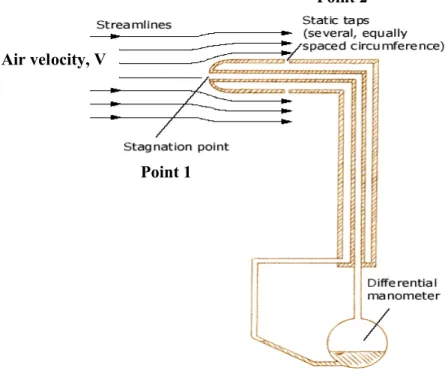
According to Tom Benson (2009), the wind tunnels can be designated by the type of fluid that is used in the tunnel. For lower speed aircraft wind tunnel testing, air moves through the tunnel. To visualize shock waves for high speed aircraft, or to study the flow around submarines or boats, water is used as the working fluid. A water tunnel is shown in Figure 2.3. In some hypersonic facilities, nitrogen or helium has been used as the working fluid. Similarly, cryogenic nitrogen has been used for high Reynold’s number testing of transonic flows.
There are several wind tunnels around the world that are used to study ice build-up on aircraft parts. These icing tunnels include refrigeration devices to cool the air in the tunnel and water spray devices to provide liquid droplets in the test section.