Doctoral Dissertations Student Theses and Dissertations
Fall 2015
Methods and algorithms for service selection and
Methods and algorithms for service selection and
recommendation (preference and aggregation based)
recommendation (preference and aggregation based)
Kenneth Kofi Fletcher
Follow this and additional works at: https://scholarsmine.mst.edu/doctoral_dissertations
Part of the Computer Sciences Commons Department: Computer Science
Department: Computer Science
Recommended Citation Recommended Citation
Fletcher, Kenneth Kofi, "Methods and algorithms for service selection and recommendation (preference and aggregation based)" (2015). Doctoral Dissertations. 2445.
https://scholarsmine.mst.edu/doctoral_dissertations/2445
This thesis is brought to you by Scholars' Mine, a service of the Missouri S&T Library and Learning Resources. This work is protected by U. S. Copyright Law. Unauthorized use including reproduction for redistribution requires the permission of the copyright holder. For more information, please contact [email protected].
METHODS AND ALGORITHMS FOR SERVICE SELECTION AND RECOMMENDATION
(PREFERENCE AND AGGREGATION BASED)
by
KENNETH KOFI FLETCHER
A DISSERTATION
Presented to the Faculty of the Graduate School of the MISSOURI UNIVERSITY OF SCIENCE AND TECHNOLOGY
In Partial Fulfillment of the Requirements for the Degree
DOCTOR OF PHILOSOPHY in
COMPUTER SCIENCE
2015
Approved
Xiaoqing (Frank) Liu, Advisor Maggie X. Cheng
Wei Jiang Sriram Chellappan
2015
Kenneth Kofi Fletcher All Rights Reserved
ABSTRACT
In order for service users to get the best service that meets their requirements, they prefer to personalize their non-functional attributes, such as reliability and price. However, the personalization makes it challenging because service providers have to deal with conflicting non-functional attributes when selecting services for users. In addition, users may sometimes want to explicitly specify their trade-offs among non-functional attributes to make their preferences known to service providers. Typically, users’ service search requests with conflicting non-functional attributes may result in a ranked list of services that partially meet their needs. When this happens, it is natural for users to submit other similar requests, with varying preferences on non-functional attributes, in an attempt to find services that fully meet their needs. This situation produces a challenge for the users to choose an optimal service based on their preferences, from the multiple ranked lists that partially satisfy their request.
Existing memory-based collaborative filtering (CF) service recommendation methods that employ this recommendation technique usually depend on non-functional attribute values obtained at service invocation to compute the similarity between users or items, and also to predict missing non-functional attributes. However, this approach is not sufficient because the non-functional attribute values of invoked services may not necessarily satisfy their personalized preferences.
The main contributions of this work are threefold. First, a novel service selection method, which is based on fuzzy logic, that considers users’ personalized preferences and their trade-offs on non-functional attributes during service selection is presented. Second, a method that aggregates multiple ranked lists of services into a single aggregated ranked list, where top ranked services are selected for the user is also presented. Two algorithms were proposed: 1) Rank Aggregation for Complete Lists (RACoL), that aggregates complete ranked lists and 2) Rank Aggregation for Incomplete Lists (RAIL) to aggregate incomplete ranked lists. Finally, a CF-based service recommendation method that considers users’ personalized preference on non-functional attributes if proposed. Examples using real-world services are presented to evaluate the proposed methods and experiments are carried out to validate their performance.
ACKNOWLEDGMENTS
I am indebted to many people and wish to thank all who have helped me through the course of this project. First of all, I thank my advisor, Dr. Xiaoqing (Frank) Liu, who has encouraged and challenged me throughout the research. Secondly, I also want to thank Drs. Maggie X. Cheng, Wei Jiang, Frank Liou and Sriram Chellappan for serving on my dissertation committee and taking time to review this work.
I am most grateful to my wife, Esi Adeborna, my parents Mr. and Mrs. Albert Fletcher, and my sister, Mrs. Alberta Ocran, for their encouragement and support. I also want to thank my friends, Prof. Richard Amankwah of the University of Mines and Technology, Ghana, and Mr. and Mrs. Robert Bowers. Finally, I want to show my appreciation to my grandparents, Mr. and Mrs. Dennis Meisinger. May the good Lord bless us all.
TABLE OF CONTENTS
Page
ABSTRACT ... iii
ACKNOWLEDGMENTS ... iv
LIST OF ILLUSTRATIONS ... viii
LIST OF TABLES ... x
SECTION 1. INTRODUCTION ... 1
2. PERSONALIZED PREFERENCE AND TRADE-OFF BASED SERVICE SELECTION (PPTSS) ... 5
2.1. BACKGROUND AND RELATED WORK ... 5
2.1.1. Service Selection Based on Non-Functional Attributes.. ... 5
2.1.2. Fuzzy Logic Service Selection Methods.. ... 6
2.2. THE SERVICE SELECTION METHOD ... 8
2.3. PERSONALIZED INDIVIDUAL NON-FUNCTIONAL ATTRIBUTE REQUIREMENT SPECIFICATION USING FUZZY PROPOSITIONS ... 12
2.4. PERSONALIZED SERVICE TRADE-OFFS ... 15
2.4.1. Relationships Among Non-Functional Attributes.. ... 15
2.4.2. Aggregating Non-Functional Attributes Using Fuzzy Connectives. ... 16
2.5. DEFUZZIFICATION OF LINGUISTIC WEIGHTS ... 18
2.6. ILLUSTRATIVE EXAMPLE ... 19
2.7. PROTOTYPE IMPLEMENTATION AND ITS EVALUATION ... 25
2.7.1. Service Selection Prototype.. ... 25
2.7.1.1 The input handler.. ...25
2.7.1.2 Functional matching engine. ...27
2.7.1.3 Service ranking engine. ...28
2.7.1.4 Evaluation of the implementation. ...28
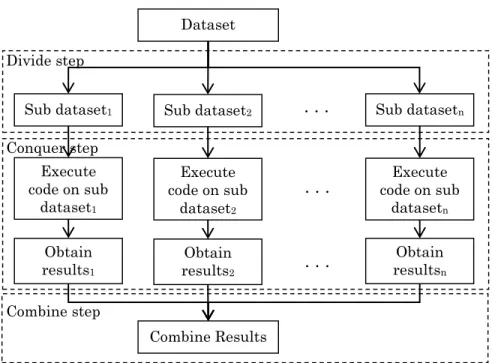
2.7.1.5 Parallel implementation.. ...28
2.7.2. Application with Real Airline Services. ... 29
2.7.2.2 User inputs and satisfaction functions.. ...30
2.7.2.3 Evaluation.. ...33
2.7.3. Experimental Evaluation.. ... 34
2.7.4. Impact of Membership Functions and Weights on the Evaluation.. ... 36
2.7.4.1 Strengthening/relaxing membership function of individual non-functional attributes.. ...36
2.7.4.2 Increasing/decreasing weights of individual non-functional attributes.. ...38
2.8. CONCLUSION ... 38
3. AGGREGATING RANKED SERVICES FOR SELECTION (ARSS) ... 40
3.1. MOTIVATION ... 40
3.2. BACKGROUND AND RELATED WORK ... 41
3.3. OVERVIEW OF THE METHOD ... 45
3.3.1. Framework Description. ... 45
3.4. SERVICE AGGREGATION ENGINE ... 46
3.4.1. Distance Measures.. ... 47
3.4.2. Rank Aggregation for Complete Lists (RACoL) Algorithm.. ... 49
3.4.3. Rank Aggregation for Incomplete Lists (RAIL) Algorithm.. ... 53
3.5. EVALUATION... 55
3.5.1. RACoL Evaluation. ... 56
3.5.2. RAIL Evaluation. ... 60
3.6. VALIDATION ... 65
3.6.1. Validating Results from RACoL Algorithm. ... 65
3.6.2. Validating Results from RAIL Algorithm. ... 66
3.7. CONCLUSIONS... 67
4. A METHOD FOR PERSONALIZED PREFERENCE-BASED SERVICE RECOMMENDATION VIA COLLABORATIVE FILTERING ... 69
4.1. MOTIVATION AND SUMMARY OF CONTRIBUTIONS ... 69
4.2. BACKGROUND AND RELATED WORK ... 72
4.2.1. Service Recommendation Based on Collaborative Filtering.. ... 72
4.3. PERSONALIZED PREFERENCE COLLABORATIVE FILTERING
METHOD ... 73
4.3.1. Problem Formulation.. ... 75
4.4. PERSONALIZED PREFERENCE RECOMMENDATION ALGORITHM .. 75
4.4.1. Similarity Computation.. ... 75
4.4.2. Similar Neighbor Determination. ... 81
4.4.3. Missing Satisfaction Value Prediction. ... 81
4.4.4. Service Recommendation. ... 83
4.5. EXPERIMENTS ... 83
4.5.1. Dataset Description and Experimental Setup. ... 83
4.5.2. Performance Comparison. ... 84
4.5.3. Impact of Value. ... 85
4.6. CONCLUSIONS... 87
BIBLIOGRAPHY ... 88
LIST OF ILLUSTRATIONS
Figure Page
2.1. Framework of the personalized preference and trade-off based service selection .... 8
2.2. The service ranking engine process ... 9
2.3. Membership function for Response Time non-functional attribute ... 13
2.4. Membership function for Reputation non-functional attribute ... 14
2.5. Typical relationships among non-functional attributes... 17
2.6. Triangular membership functions for the seven linguistic terms... 19
2.7. Fuzzified throughput value of service 4 ... 21
2.8. Screenshot of the personalized preference and trade-off based service selection prototype ... 26
2.9. Parallel implementation of the service selection system ... 29
2.10. Execution time of the services selection system ... 35
2.11. Execution time of the services selection system parallel implementation ... 35
2.12. Strengthening the Reputation non-functional attribute ... 36
2.13. Relaxing the Response Time non-functional attribute. ... 37
3.1. Framework of the proposed services aggregation method ... 47
3.2. A complete bipartite graph with edge cost. ... 50
3.3. A flow network with antiparallel edges ... 52
3.4. Using algorithm 2 to find the minimum-cost perfect matching ... 53
3.5. (a) Incomplete rankings and their missing elements. (b) Computing the ranks of missing elements of 𝜎1 from other lists ... 55
3.6. A complete bipartite graph... 58
3.7. Solution of the minimum perfect matching algorithm ... 59
3.8. A complete bipartite graph... 61
3.9. Solution to the minimum-cost perfect matching problem using l=k+1 method to calculate the edge costs ... 64
3.10. Solution to the minimum-cost perfect matching problem using l=(3k-2z+1)/2 method to calculate the edge costs ... 64
3.11. Solution to the minimum-cost-perfect matching problem using the random position method to calculate the edge costs ... 64
3.12. Solution to the minimum-cost-perfect matching problem using RAIL
algorithm to calculate the edge costs ... 65 3.13. A graph showing a comparison of RACoL with Borda Count and Reciprocal
Rank based on the Kemeny Measure of each solution to their original 5 input ranked lists ... 66 3.14. A graph showing the total minimum cost, normalized to maximum possible
total cost, for each of the solution on the 5 ranked lists. A lower score indicates better selection. The total minimum cost is the total penalty for placing an item in a position as defined in (19) ... 67 3.15. A graph showing the Kemeny Measure of each solution to their original
input lists on the 5 input ranked lists ... 68 4.1. Framework of the personalized preference collaborative filtering method
for service recommendation ... 74 4.2. Impact of delta ( ) ... 87
LIST OF TABLES
Table Page
2.1. List of Services Satisfying User’s Functionality ... 16
2.2. The Seven Linguistic Terms, Their Fuzzy Numbers, and Corresponding Importance Value ... 19
2.3. List of Service Requests from 5 Different Users ... 20
2.4. The List of Services and Their Non-Functional Attribute Values with Accounting Functionality... 21
2.5. Ranked Services Based on User 1’s Trade-off Strategy ... 23
2.6. Ranked Services Based on User 2’s Trade-Off Strategy ... 23
2.7. Ranked Services Based on User 3’s Trade-off Strategy ... 24
2.8. Ranked Services Based on User 4’s Trade-off Strategy ... 24
2.9. Ranked Services Based on User 5’s Trade-off Strategy ... 25
2.10. Ranked Services Based on Request 2 ... 27
2.11. List of Service Request from 5 Users ... 30
2.12. Membership Function ... 31
2.13. Top-5 out of 3498 Services Based on User 1’s Personalized Preference and Trade-off Strategy ... 31
2.14. Top-5 out of 7468 Services Based on User 2’s Personalized Preference and Trade-off Strategy ... 31
2.15. Top-5 out of 8409 Services Based on User 3’s Personalized Preference and Trade-off Strategy ... 32
2.16. Top-5 out of 7927 Services Based on User 4’s Personalized Preference and Trade-off Strategy ... 32
2.17. Top-5 out of 15441 Services Based on User 5’s Personalized Preference and Trade-off Strategy ... 33
2.18. Top-5 out of 3498 Services Based on the above Trade-off Strategy ... 34
2.19. Strengthened Membership Functions ... 37
2.20. Top-5 out of 7468 Services Based on User 2’s Personalized Preference and Trade-off Strategy with Strengthened Non-Functional Attribute ... 37
2.21. Top-5 out of 7468 Services Based on User 2’s Personalized Preference and Trade-off Strategy with Decreased Weights ... 38
3.1. Three Similar Requests Showing the Differences in Preferences on
Non-Functional Attributes ... 41
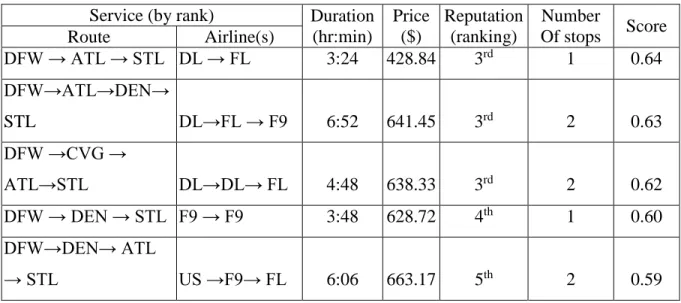
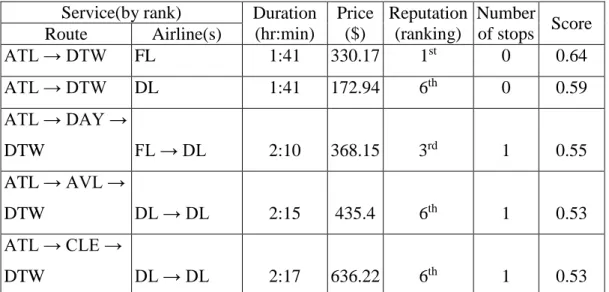
3.2. Suggested Ranked List of Flights that Closely Match User’s Initial Request ... 41
3.3. Suggested Ranked List of Flights that Closely Match User’s First Modified Request ... 41
3.4. Suggested Ranked List of Flights that Closely Match User’s Second Modified Request ... 42
3.5. Aggregated Ranked List of Flights From Tables 3.2, 3.3, and 3.4 ... 42
3.6. Ranked Services Based on Request 1 ... 57
3.7. Ranked Services Based on Request 2 ... 57
3.8. Ranked Services Based on Request 3. ... 57
3.9. Ranked Services Based on Request 4 ... 57
3.10. Edge Costs for all Edges in Figure 3.6 ... 58
3.11. Aggregated Results ... 60
3.12. Top-5 out of 3498 Services Based on Request 1 ... 60
3.13. Top-5 out of 3498 Services Based on Request 2 ... 60
3.14. Top-5 out of 3498 Services Based on Request 3 ... 61
3.15. Top-5 out of 3498 Services Based on Request 4 ... 61
3.16. Edge Costs Using the l=k+1 Method ... 62
3.17. Edge Costs Using the l=(3k-2z+1)/2 Method ... 62
3.18. Edge Costs Using the Random Position Method ... 63
3.19. Edge Costs Using RAIL Algorithm ... 63
3.20. Super Lists ... 65
4.1. The List of Services and Their Non-Functional Attribute Values with Accounting Functionality... 69
4.2. List of Service Requests from 5 Different Users ... 70
4.3. User-Service Matrix Indicating Invoked Services and Their Satisfaction ... 70
4.4. List of Users, Their Invoked Services and Personalized Preferences ... 77
4.5. Non-functional Attributes, Their Descriptions, and Units ... 84
4.6. Comparison of PPSR to WSRec and PHCF on the Response Time Non-Functional Attribute ... 86
4.7. Comparison of PPSR to WSRec and PHCF on the Throughput Non-Functional Attribute ... 86
1. INTRODUCTION
Services technology is well recognized as an easy way to integrate applications without boundaries. Owing to this, most organizations tend to publish their services on the web for easy consumption by the public. This has exponentially increased the number of available services. Different service providers may offer services that are equivalent with respect to their functionality. Therefore, it becomes more challenging for users to select the services that best meet their requirements. Rather than selecting services based only on their functionality, users are increasingly paying more attention to non-functional attributes, such as reliability, availability, reputation, and price. This is because, non-functional attributes provide a distinction among the competing services with similar functionality; allowing prospective users to choose the services which best suit their requirements. Using non-functional attributes during service selection however, presents service providers with certain challenges. Firstly, users’ service requirements are becoming personalized. Personalization here, describes how different users have different preferences (values) for the same non-functional attribute. It therefore becomes challenging to incorporate their personalized preferences on non-functional attributes. While most non-functional attributes may be necessary not all users prefer the same number of attributes for a particular service. Secondly, users’ requests sometimes contain conflicting non-functional attributes which makes it challenging to completely meet their preferences for such requests. Conflicting non-functional attributes are those attributes where an increase in the satisfaction of one often decreases the satisfaction of the other. As a result of this conflicting relationship that may exist between non-functional attributes, users may want to explicitly trade-off some non-functional attributes for others.
Usually, a user’s personal preference for a service comprises of his/her preference for non-functional attribute(s) that describe the service. These non-functional attributes may be conflicting [1, 2], resulting in ranked list of services that partially meet the user’s preference. In an attempt to obtain services that completely meet his/her request, the user may submit similar multiple service requests. Here, similar requests are those requests with the same functionality and trade-offs on non-functional attributes, but with varying
preference on those non-functional attributes. These requests may also yield ranked lists that do not fully satisfy the user’s preference due to the same conflicting relationship that may exists among non-functional attributes. In such a situation, it becomes challenging for the user to compare the different ranked lists in order to choose the optimal service. This is because, each ranked list may contain huge number of services that makes it time consuming for users to compare them against services in other ranked lists. A naïve way for this comparison will be to merge the different sets of ranked lists into one list and rank the merged list with respect to the user’s search intent. However, this naïve way also has its own challenges: 1) the same service may rank differently in other ranked lists and therefore becomes hard to determine its overall rank; and 2) some of the ranked lists may contain services that do not appear in other ranked lists due to the varying requests, making it difficult to determine the overall rank of such services. In order for the user to obtain an optimal service, based on the ranked lists, there is the need for a method that will produce an aggregated ranked list that addresses the challenges mentioned above.
The increase in the number of services over the internet has inundated service users with many choices. For instance, Netflix.com has over 17,000 movies in its selection, and Amazon.com has over 410,000 titles in its Kindle store alone [3]. In order to reduce the number of choices users can decide on, recommendation systems are necessary. Recommendation systems are attracting lots of attention because they provide users with prior knowledge of candidate choices to deal with information overload on the Web. They have been used to recommend books and CDs at Amazon.com, movies at Netflix.com, and news at VERSIFI Technologies [4].
Collaborative filtering (CF) is one of the widely used service recommendation techniques that bases its recommendations on the ratings or behavior of other users in the system [3]. Intuitively, it assumes that, if users agree about the quality or relevance of some service items, then they will likely agree about other service items as well. Existing memory-based CF techniques accomplish this by computing the similarity between users or service items using non-functional attribute values obtained at service invocation. However using non-functional attribute values of invoked services alone gives inaccurate similarity measure. This is because, the invoked services are typically the final choice (including any trade-offs) of users and may not necessarily satisfy their personalized
preferences. They represent the “end” of users’ service selection process and therefore when the non-functional attribute values of the invoked services used for similarity computation, they do not reflect users’ personalized preferences on those non-functional attributes. Therefore, rather than focusing solely on the “end”, recommendation systems must include the “means to the end” (users personalized preference) during service recommendation.
The non-functional attribute values observed by users during service invocation may not necessarily represent their satisfaction for that service. For this reason, disregarding the personalized preferences of users in similarity computation creates a gap between users’ non-functional attribute value and their satisfaction. Users’ personalized preferences ensures that the non-functional attribute closely aligns with their satisfaction, bridging that gap and resulting in similarity values that accurately depicts the similar relationship between two users. Intuitively, if a non-functional attribute value used in similarity computation fails to satisfy a user’s personalized preference it in turn produces similarity results that are inaccurate. Thus, to accurately recommend services, which are personalized to users, it is necessary for recommendation systems to incorporate users’ personalized preferences on non-functional attributes when recommending services to an active user.
A great deal of work has been done to bring attention to service discovery and selection based on non-functional attributes. Much of this work has produced similar ideas [5, 6, 7, 8, 9]. For example, many researchers have proposed that a user always give precise, quantitative constraints and preferences on each non-functional attribute. Others rely on weighted summation functions to aggregate all non-functional attributes to rank services for selection. These studies have the following shortcomings: 1) They do not allow users to specify either personal preferences or associated weights, based on elastic non-functional attributes, using linguistic terms (i.e. English), which are more practical. 2) They do not take into consideration the relationships among non-functional attributes which may lead to inappropriate trade-offs among non-functional attributes.
In this dissertation, users’ personalized preferences on non-functional attributes and their trade-offs to select services that best satisfy their needs is considered. A method that takes users’ personalized trade-off preferences and linguistic weights on
non-functional attributes as inputs for service search is developed. Top ranked services in the search results are then selected. Two algorithms to compute an aggregated ranked list from each ranked list of services is also proposed. The first algorithm, Rank Aggregation for Complete Lists (RACoL), aggregates complete ranked lists (ranked lists given by total orders). There are however instances where the ranked lists to be aggregated come with incomplete ranked lists (incomplete orderings); i.e. some ranked list(s) contain services that do not appear in other ranked list(s). The second algorithm, Rank Aggregation for Incomplete Lists (RAIL), is proposed to aggregate incomplete ranked lists.
A method that considers users’ personalized preferences, in addition to the non-functional attribute values of invoked services, to accurately recommend service(s) to an active user is also proposed. The proposed method, accurately compute the similarity between users or service items by incorporating users’ personalized preferences on non-functional attributes in our similarity function. The enhanced similarity function firstly, identify whether the two service users or items share some past experiences. If they do, the widely used Pearson Correlation Coefficient [3, 4, 10, 11] is extended to include satisfaction of users’ personalized preferences on non-functional attributes. Otherwise, the similarity between the user’s preferences is computed. Based on the similarity values, the top-k algorithm is employed to find similar neighbors. Finally, to predict missing non-functional attribute values, the weighted average with mean offset is extended to incorporate users’ satisfaction on non-functional attributes based on their personalized preferences.
Examples using real-world services to evaluate the method are presented. It can be seen that rank aggregation results from the proposed method closely represent the sets of ranked lists than using alternative approaches. Experiments were also carried out to validate their performance.
2. PERSONALIZED PREFERENCE AND TRADE-OFF BASED SERVICE SELECTION (PPTSS)
2.1. BACKGROUND AND RELATED WORK
In this section, related work regarding service selection methods based on non-functional attributes as well as fuzzy logic [12] are discussed.
2.1.1. Service Selection Based on Non-Functional Attributes. Following Ran’s [13] work, the problem of both service discovery and service selection with respect to non-functional attributes has received lots of attention in the service computing community. Service selection is heavily based on ranking services according to their non-functional attributes. Combining multiple non-non-functional attributes make service selection a difficult task as users struggle to find the right service with an optimal combination of non-functional attributes.
Masri and Mahmoud [7] employed a variation of weighted summation of non-functional attributes to rank services for selection. They first normalize values of different non-functional attributes into a range. Then compute the overall satisfaction of the services by summing the normalized values. Services are ranked based on overall quality. Similarly, Comuzzi and Pernici [14] used a price model to combine multiple non-functional attributes. This price model converts each non-non-functional attribute of a service to a price and then adds all of the prices together. The services are then ranked according to their total prices. Benouaret et al. [15] proposed two concepts, σ- and α-dominant skylines, to improve the skyline, a concept for selecting web services based on non-functional attributes. They identified two skyline requirements, size and quality, for which σ- and α-dominant skylines were their respective solutions. Benouaret et al. [16], in another work, proposed a majority-rule-based web service selection. Although their approach does not explicitly consider users’ non-functional attributes, it considers their overall preference on a service. They formulated the majority-rule-based service selection based on the dominance relationship and skyline and also proposed an algorithm that is both efficient and returns a more manageable set of services. Yau and Yin [17] proposed a service ranking and selection method which can support a more flexible non-functional
attribute specification. They modeled the relationship among services’ non-functional attributes and satisfaction scores.
Sun et al. [18] proposed a personalized Web service recommendation method based on a novel collaborative filtering (CF) approach. The method takes advantage of the little non-functional attribute information available. They employ non-functional attribute information from similar users with similar experience on the same non-functional attribute to automatically predict non-non-functional attribute values. Chen et al. [19] also proposed a region-based hybrid CF algorithm to predict non-functional attribute values of services for service recommendation. In their work, they discovered that a user’s location greatly influences the accuracy of their prediction. Sun et al. [20] again presented a new similarity measure for Web service similarity computation and propose a novel collaborative filtering approach, called normal recovery collaborative filtering, for personalized Web service recommendation.
2.1.2. Fuzzy Logic Service Selection Methods. Traditional non-functional attribute-driven service selection methods require crisp and precise constraints and preferences on non-functional attributes from users. Examples are “the response time should be less than 1 second” and the preference degree for response time is 0.9”. Such specifications are not natural and practical to users in many cases. Instead, users may like to use fuzzy logic and linguistic terms [12, 21] to represent their non-functional attributes, such as “the response time should be Short”.
Wei-Lin et al. [22] proposed a fuzzy consensus on non-functional attributes in web services discovery approach based on fuzzy sets [12]. Their objective was to build consensus on non-functional attributes between service providers and consumers. Their focus was on aggregating similarities between non-functional attributes from the provider’s and consumer’s perspectives.
Wang [23] extends the Max-Min-Max composition of intuitionistic fuzzy sets (IFS) [21]. He categorized non-functional attributes properties of web services into functional and non-functional properties. His approach deals with the decision maker’s imprecise perceptions under incomplete information. It also objectively determines the weights of non-functional attributes. Determining of weights from users requirements may result in assigning weights on non-functional attributes inappropriately. This is
because user requirements are fuzzy and sometimes the users themselves do not know exactly what they want. Wang [24] also designed a service selection model that takes into account its non-functional attributes based on fuzzy linear programming (FLP) technologies. This was to identify service alternatives dissimilarities and assist service users in selecting most suitable services with consideration of their expectations and preferences. Xiuqin et al. [25] employed interval-valued intuitionistic fuzzy soft set theory for solving web service selection problems that take into account users’ non-functional attributes. Almulla et al. [26] explored the dependencies between quality factors to improve the weights given by a user. However, this method is also based on the classical weighted summation (or average) function to rank services. This ranking method does not allow representation of personalized trade-offs among non-functional attributes in many cases. Li et al. [27] proposed a model for web service selection based on fuzzy quality of service (QoS) attributes. In their model, they classified QoS information into several multi-dimensional classes. Then based on these classes, a synthetic service selection method is used to rank is used to rank the services.
A systematic approach for specifying non-functional requirements of contracts for quality management and evaluation has been proposed by Liu and Yen [28] and Liu et al. [29]. Their work considers both qualitative and quantitative specification techniques of functional requirements. Also, they introduce both the crisp and elastic non-functional requirements specification. This paper adopts those concepts and is the first to apply them to service selection based on both personalized preferences and trade-offs.
The works discussed in this section do not take either relationships or personalized trade-offs among non-functional attributes into consideration. Therefore, such works lack the ability to implicitly support personalized non-functional attribute tradeoffs. In addition, personalization is defined in terms of 1) linguistic terms, 2) membership functions, and 3) importance on non-functional attributes. This is to fully capture the personalized nature of a user’s request and subsequently select the right services to meet the user’s request.
2.2. THE SERVICE SELECTION METHOD
The proposed service selection method is described in this section. Some basic notation, used in this paper, is also provided. Finally, the formalization of the proposed service selection method is given in this section.
Figure 2.1 shows the framework of the proposed personalized preference and trade-off based service selection. The method assumes that all service users are rational. The service selection process begins by a user submitting a new service request. The service request includes both the functional requirements and the non-functional requirements. The input of the non-functional requirements is in two parts. First, the user selects his/her preferred non-functional attributes and then specifies their satisfaction for each attribute. Next, with these attributes, the user then specifies his/her trade-off strategy for selection. The trade-off strategy includes the user’s personalized elastic non-functional attributes, weights and required aggregation operators, which will be discussed in detail in Section 2.4. All of these are captured by the input handler.
Figure 2.1. Framework of the personalized preference and trade-off based service selection
The input handler processes the request, extracting both the functional and non-functional requirements. The functional matching engine uses the functional requirements and information from the functional description of services repository to produce a list of
Non-functional attribute Data of Services Functional Description of Services Input Handler New Service Request Non-functional attributes metadata Functional Matching Engine
Service Ranking Engine
Fuzzification of Non-functional attributes constraints Functional Requirements Personalized Trade-off Strategy Selected Services Service User Services Satisfying Functional Requirements 1 2 3 4a 4b 5
services satisfying user’s functional requirements. For this purpose, the algorithm by Sajjanhar et al. [30] was employed. The non-functional requirements, in the form of a trade-off strategy, are pushed over to the service ranking engine. The list of services matching user’s functionality is also sent to the service ranking engine for evaluation based on the trade-off strategy.
The evaluation by the service ranking engine uses as inputs: the list, user specified non-functional requirements, linguistic fuzzified non-functional attribute constraints and non-functional attribute data. With these inputs, the service ranking engine computes the satisfaction degree for each service, by defuzzifying the linguistic satisfactions provided by the user using fuzzy propositions.
The service ranking engine also defuzzifies the linguistic weights of each non-functional attribute using the Centroid Method (CM) [31]. The CM defuzzifies the weights supplied by the user in linguistic terms.
Finally, using fuzzy connectives like fuzzy conjunction, fuzzy disjunction and fuzzy compromise, the service ranking engine computes the overall satisfaction degree of aggregated non-functional requirements for all services. The services are then ranked according to the overall satisfaction degrees. Services with high overall satisfaction degrees (top-ranked) are presented to the user for selection. Figure 2.2 illustrates this detailed process by the service ranking engine to complete its task.
Figure 2.2. The service ranking engine process
Users’ personalized non-functional attribute requirements are defined first in terms of linguistic terms, and then by users’ membership function and finally users’ importance on non-functional attribute.
Compute Satisfaction Degree of Individual Non-functional Attribute
Defuzzify Linguistic Weight of each Non-Function Attribute
using the Centroid Method Rank Services
Compute the Overall Satisfaction Degree of
Each Service Personalized Trade-off
Strategy Weights of Individual
Non-functional Attributes Expressed in Linguistic Terms List of Services
Satisfying Functional Requirements
Assume a list of services satisfying a user’s functional requirements 𝑆 = {𝑠1, 𝑠2,
𝑠3, … , 𝑠𝑛}, and a list of user’s preferred non-functional attributes 𝑁 = {𝑛𝑓𝑎1, 𝑛𝑓𝑎2, … , 𝑛𝑓𝑎𝑚}. Let 𝜎𝑆𝑖
𝑁𝑗
denote the satisfaction of non-functional attribute, 𝑁𝑗 with respect to service 𝑆𝑖, where 𝜎 is the linguistic term that typifies the satisfaction of 𝑁𝑗. For instance, 𝐻𝑖𝑔ℎ𝑆
𝑖
𝑎𝑣𝑎𝑖𝑙𝑎𝑏𝑖𝑙𝑖𝑡𝑦
, may be used by a user to describe their satisfaction on availability non-functional attribute as being high.
Next the satisfaction degree of the linguistic term by a membership function is specified. Some users may have some difficulty to specify their membership functions. Due to this, membership functions were categorized into two (2) main categories depending on the maximum satisfaction of the associated non-functional attribute value. One of the main categories supports non-functional attributes whose higher values produces higher satisfaction (e.g. reliability and availability non-functional attributes). The second main category of membership function supports non-functional attributes whose lower values produces higher satisfaction (e.g. responsetime and reputation non-functional attributes). In this way, users need not to specify the entire membership function but the selection system will generate those functions for users based on the maximum and minimum values they provide. The categories are as follows:
1. Category 1: higher non-functional attribute values preferred (the higher, the better), e.g. reliability, and availability non-functional attributes; and
2. Category 2: lower non-functional attribute values preferred (the lower, the better), e.g. response time and price non-functional attributes.
Definition (Satisfaction Function). Given S and N, the satisfaction of a non-functional attribute, 𝑁𝑗,with respect to a service, 𝑆𝑖, is defined as
𝜎𝑆
𝑖 𝑁𝑗
= {𝛼, 𝐶𝑎𝑡𝑒𝑔𝑜𝑟𝑦 1
𝛽, 𝐶𝑎𝑡𝑒𝑔𝑜𝑟𝑦 2 (1)
where 𝛼 and 𝛽 are the membership functions for category 1 and category 2 respectively which are defined as
𝛼 = { 0 , 𝑖𝑓 𝑁𝑗 ≤ 𝑚𝑖𝑛𝑖𝑚𝑢𝑚 1 , 𝑖𝑓 𝑁𝑗 ≥ 𝑚𝑎𝑥𝑖𝑚𝑢𝑚 𝑁𝑗 − 𝑚𝑖𝑛𝑖𝑚𝑢𝑚 𝑚𝑎𝑥𝑖𝑚𝑢𝑚 − 𝑚𝑖𝑛𝑖𝑚𝑢𝑚, 𝑜𝑡ℎ𝑒𝑟𝑤𝑖𝑠𝑒 (2) 𝛽 = { 0 , 𝑖𝑓 𝑁𝑗 ≥ 𝑚𝑎𝑥𝑖𝑚𝑢𝑚 1 , 𝑖𝑓 𝑁𝑗 ≤ 𝑚𝑖𝑛𝑖𝑚𝑢𝑚 𝑚𝑎𝑥𝑖𝑚𝑢𝑚 − 𝑁𝑗 𝑚𝑎𝑥𝑖𝑚𝑢𝑚 − 𝑚𝑖𝑛𝑖𝑚𝑢𝑚, 𝑜𝑡ℎ𝑒𝑟𝑤𝑖𝑠𝑒 (3)
where minimum and maximum are the highest and lowest satisfaction degrees of the non-functional attribute, 𝑁𝑗, as specified by the user.
Definition (Personalized Non-Functional Attribute). Let 𝑈 = {𝑢1, 𝑢2, … , 𝑢𝑚} be a set of service users, and 𝑊𝑈𝑖,𝑁𝑗 be a weighting factor of user 𝑈𝑖′𝑠 linguistic importance
on a non-functional attribute 𝑁𝑗. Some possible linguistic weights are extremely important, very important, important and somewhat important. Details of all the linguistic weights used in this work are discussed in Section 2.5. The personalized non-functional attribute, 𝑃𝑈
𝑖 𝑁𝑗
, for a user 𝑈𝑖 on a non-functional attribute 𝑁𝑗 is a membership function MF with the weighting factor 𝑊𝑈𝑖,𝑁𝑗 given as
𝑃𝑈
𝑖 𝑁𝑗
= 𝑀𝐹(𝑈𝑖, 𝑁𝑗) × 𝑊𝑈𝑖,𝑁𝑗 (4)
Definition (Overall Trade-Off Strategy). The overall personalized trade-off strategy (requirement), 𝑅𝑈𝑖, for a user 𝑈𝑖, can be described using individual personalized non-functional attributes, 𝑃𝑈
𝑖 𝑁𝑗
, and an aggregation operator (discussed in detail in Section 2.4.2), ∐, as follows: 𝑅𝑈𝑖 = ∐ 𝑃𝑈𝑖 𝑁𝑗 𝑚 𝑗=1 (5) where
∐is either of the fuzzy connective operators ∧, ∨, or ⊗
For instance, let 𝑁 = {𝑟𝑒𝑙𝑖𝑎𝑏𝑖𝑙𝑖𝑡𝑦, 𝑝𝑟𝑖𝑐𝑒, 𝑟𝑒𝑝𝑢𝑡𝑎𝑡𝑖𝑜𝑛} and 𝑃𝑈
𝑖 𝑟𝑒𝑙𝑖𝑎𝑏𝑖𝑙𝑖𝑡𝑦 , 𝑃𝑈 𝑖 𝑝𝑟𝑖𝑐𝑒 , and 𝑃𝑈 𝑖 𝑟𝑒𝑝𝑢𝑡𝑎𝑡𝑖𝑜𝑛
be the preferences for reliability, price and reputation non-functional attributes respectively for user 𝑈𝑖, then R for the user can be
𝑅 = 𝑃𝑈 𝑖 𝑟𝑒𝑙𝑖𝑎𝑏𝑖𝑙𝑖𝑡𝑦 ∧ 𝑃𝑈 𝑖 𝑝𝑟𝑖𝑐𝑒 ⊗ 𝑃𝑈 𝑖 𝑟𝑒𝑝𝑢𝑡𝑎𝑡𝑖𝑜𝑛
Definition (Service Selection). Given S, N, W and R, the service selection process can be modelled as a ranking in terms of the satisfaction of requirement R so that for any two services Si and Sj the following is true.
𝑆𝑖 ≻ 𝑆𝑗 ⟺ 𝑆𝑎𝑡𝑅(𝑆𝑖) ≥ 𝑆𝑎𝑡𝑅(𝑆𝑗) (6)
where 𝑆𝑎𝑡𝑅(𝑆𝑖) represents the satisfaction of service Si with respect to some user requirement R.
2.3. PERSONALIZED INDIVIDUAL NON-FUNCTIONAL ATTRIBUTE
REQUIREMENT SPECIFICATION USING FUZZY PROPOSITIONS
This section discusses how to specify individual non-functional requirements in terms of non-functional attributes. The specification is done using fuzzy proposition, a statement in fuzzy logic which is satisfied to a degree, and linguistic terms. Some linguistic terms used are ‘high’, ‘affordable’, ‘good’, ‘short’ and ‘few’. The membership function of these linguistic terms in fuzzy logic typifies satisfaction of some non-functional attributes.
The non-functional attributes considered in the illustrative example include
reliability, availability, throughput, response time. A service user may specify their non-functional requirements on, for instance, service response time (the lower the value, the better the non-functional attribute) as follows: The response time for a prospective
service must be ‘high’. Figure 2.3 shows the membership function of ‘high’ that satisfies the response time non-functional attribute.
On the vertical axis in Figure 2.3, 0 and 1 represent the lowest and highest levels of service satisfaction, respectively, in terms of response time. If the service responds, on average, 3 secs or lower, the non-functional attribute is understood to be met. If the response time is increased from 3 secs to anything above 10 secs, the service satisfaction reduces accordingly. However, if the response time is greater than the threshold of 10 secs, the satisfaction degree is 0 and the service is completely unacceptable.
Figure 2.3. Membership function for Response Time non-functional attribute
The membership functions of the non-functional attributes that are considered in the airline application case study is presented in Section 2.7.2. They include price (airline price), reputation, duration, and number-of-stops.
The reputation of an airline in this work is based on the Airline Quality Rating (AQR) [32]. The AQR is an objective method for assessing airline quality on combined multiple performance criteria [32]. The formula for calculating the AQR score is:
AQR=(+8.63 × 𝑂𝑇) + (−8.03 × 𝐷𝐵) + (−7.29 × 𝑀𝐵) + (−7.17 × 𝐶𝐶)
(8.63 + 8.03 + 7.29 + 7.17) (7)
where OT (On-Time), DB (Denied Boarding), MB (Mishandled Baggage), and CC (Customer Complains) are variables considered. Data for all criteria is drawn from the
3 10
0 1
Response Time (secs)
S at isf ac ti o n D eg re e
U.S. Department of Transportation's monthly Air Travel Consumer Report1 [32]. The AQR values used in this work are based on the April 2012 reported values. Higher AQR values indicate excellent reputation. AirTran Airways (FL) for example, had the best rating in 2011 with an AQR value of -0.48. Since most normal users are not aware of AQR, the ranking of an airline which is based on its AQR value was used to denote its reputation. For instance, in the 2012 AQR reported values, out of 14 airlines, AirTran Airways (FL) ranked first (1st) and American Eagle (MQ) ranked fourteenth (14th). Figure 2.4 is the membership function of ‘medium’ that satisfies the reputation non-functional attribute.
The number-of-stops of a flight indicates the number of different flights (which have different flight numbers) that makes up any flight between two cities by an airline. For instance, consider a flight from St. Louis to New York which goes through Memphis and Atlanta. Assume that flights from St. Louis to Memphis, Memphis to Atlanta and Atlanta to New York all have different flight numbers. Then the number-of-stops for this flight is 2 because it stops at Memphis and Atlanta.
Figure 2.4. Membership function for Reputation non-functional attribute
1 http://dot.gov/airconsumer/ 5th 1st 0 1 Reputation (Ranking) S at isf ac ti o n D eg re e
2.4. PERSONALIZED SERVICE TRADE-OFFS
The relationships among a service’s non-functional attributes are extremely important when considering trade-offs. These relationships reveal the interaction among non-functional attributes. Additionally, selecting a suitable aggregation operator for the aggregation of non-functional attributes depends on these relationships. The relationships that exist among non-functional attributes are discussed and aggregation operators based on the relationships are presented.
2.4.1. Relationships Among Non-Functional Attributes. For any two non-functional attributes, there exist some relationship. The relationship between any two non-functional attributes are classified into three (3) different types: conflicting,
cooperative, and mutually exclusive [28]. These relationships are based on the outcome or impact on the satisfaction degree of one non-functional attribute when the satisfaction degree of another non-functional attribute changes. In addition, the relationship between two non-functional attributes is based on the published services and their non-functional attributes value.
Conflicting Non-Functional Attributes (⊖). Two non-functional attributes are said to be conflicting if an increase in the satisfaction degree of one often decreases the satisfaction degree of the other. If an increase in the satisfaction degree of one non-functional attribute always decreases the satisfaction degree of the other, they are said to be completely conflicting [28].
Cooperative Non-Functional Attributes (⊕). Contrary to conflicting non-functional attributes, two non-non-functional attributes are referred to as cooperative if an increase in the satisfaction degree of one often increases the satisfaction degree of the other. If an increase in the satisfaction degree of one non-functional attribute always leads to an increase in the satisfaction degree of the other, they are said to be completely cooperative [28].
Mutually Exclusive Non-Functional Attributes (⨀). It is typical that two non
-functional attributes cannot be satisfied at all at the same time. That is, if the satisfaction degree of one non-functional attribute is satisfied to a certain degree, the other cannot be satisfied at all, and vice versa. When this occurs, they are considered to be mutually exclusive non-functional attributes.
To show an example of mutually exclusive non-functional attributes, consider a scenario where a user wants an airline service that costs not more than $200, gets to their destination in not more than 3 hours and has a reputation less than the 5th ranking airline. Assume that Table 2.1 is the list of services satisfying the user’s functional requirement. Services 2 and 3 satisfy this user’s cost non-functional attribute. However, it can be seen that neither the duration nor reputation non-functional attribute of either service 2 or 3 can be satisfied at the same time. In such a situation, the non-functional attribute duration and reputation are mutually exclusive.
Table 2.1. List of Services Satisfying User’s Functionality Service Cost($) Duration (hrs) Reputation (ranking)
1 215 2.70 1st
2 195 2.80 7th
3 187 3.50 3rd
For a service request that includes multiple non-functional attributes, it may be challenging to satisfy all attributes to their highest degrees. This is due to the relationship that exists between any two non-functional attributes. Thus, trade-offs among them are desirable. Typically, it has been observed that each of the following pairs of non-functional attributes; (reliability and availability) and (throughput and response time) are cooperative [McCall 2002]. Also, (reliability and throughput), (reliability and response time), (availability and throughput), and (availability and response time) are conflicting non-functional attributes [33] (see Figure 2.5). It must be noted that the relationships are application domain dependent and also depend on the published services and their non-functional attributes value. Therefore a relationship that holds in an airline domain may not necessarily hold in healthcare domain.
2.4.2. Aggregating Non-Functional Attributes Using Fuzzy Connectives. Multiple non-functional attributes must be aggregated based on the relationships that exist among them to obtain an overall non-functional attribute satisfaction value. This is
achieved by employing aggregation operators. Three of such operators, fuzzy compromise [28], fuzzy conjunction [12], and fuzzy disjunction [12], are discussed in this section.
Figure 2.5. Typical relationships among non-functional attributes
Fuzzy Compromise Operator (⊗). Consider the following set of non-functional attributes: N1, N2, …,Nm. If the relationship among them is conflicting, then they should be combined with the fuzzy compromise operator. The resulting compromise is the minimal and maximal degree of the membership function. The operator AVERAGE, which is an example of a fuzzy compromise operator, is used in this work. Let S = {s1, s2, …,sn} be the set of services. If both N1 and N2 are two non-functional attributes of a service (Si), then the resulting trade-off value using the AVERAGE operator is
N1(Si)⊗N2(Si)=
N1(Si)+ N2(Si)
2 (8)
Fuzzy Conjunction Operator (∧). Cooperative non-functional attributes can be satisfied at the same time and hence, fuzzy conjunction operator becomes a suitable operator to combine them. Consider the following set of non-functional attributes: N1,
N2, …,Nm. If the relationship among them is cooperative, then they should be combined with the fuzzy conjunction operator. The operator MIN, which is an example of a fuzzy
Reliability Availability Throughput Response Time
Cooperative Non-functional Attributes Conflicting Non-Functional
conjunction operator, is used in this work. Let S = {s1, s2, …,sn} be the set of services. If both N1 and N2 are two non-functional attributes of a service (Si), then the resulting trade -off value using the MIN operator is
N1(Si) ∧ N2(Si)=MIN{N1(Si), N2(Si)} (9)
Fuzzy Disjunction Operator (∨). The fuzzy disjunction operator serves as an efficient way to combine mutually exclusive non-functional attributes as they cannot all be satisfied at the same time. Consider the following set of non-functional attributes: N1,
N2, …,Nm. If the relationship among them is mutually exclusive, then they should be combined with the fuzzy disjunctive operator. The operator MAX, which is an example of a fuzzy disjunction operator, is used in this work and is defined as follows. Let S = {s1, s2, …,sn} be the set of services. If both N1 and N2 are two non-functional attributes of a service (Si), then the resulting trade-off value using the MAX operator is
N1(Si) ∨ N2(Si)=MAX{N1(Si), N2(Si)} (10)
2.5. DEFUZZIFICATION OF LINGUISTIC WEIGHTS
The Centroid Method, also known as either the center of gravity (CoG) or center of area (CoA) method, is the most commonly used defuzzification technique. This technique which provides a crisp value based on the center of gravity of the fuzzy set [31]. It also determines the best point for dividing the fuzzy set into exactly two masses. Because weights of non-functional attributes, in this work, are specified using linguistic terms (which can be decomposed in a triangular shape), the centroid method becomes a very suitable approach for defuzzifying the linguistic weight terms. The centroid method is a weighted average method in which the membership function is used for weighting [31]. For a triangular fuzzy number F = (,,), the weighted value () can be calculated as:
()
In this work, seven linguistic terms are decomposed into triangular fuzzy numbers using the triangular fuzzy set shown in Figure 2.6. These linguistic terms are tabulated in Table 2.2 and are provided for assigning the weights to each non-functional attribute. The weight value of each of the linguistic term is calculated using Equation (11).
Figure 2.6. Triangular membership functions for the seven linguistic terms
Table 2.2. The Seven Linguistic Terms, Their Fuzzy Numbers, and Corresponding Importance Value
Linguistic Term Triangular Fuzzy Number Importance Value
Extremely Important (EI) (0.9, 1.0, 1.0) 0.97
Very Important (VI) (0.7, 0.9, 1.0) 0.87
Important (I) (0.5, 0.7, 0.9) 0.70
Somewhat Important (SI) (0.3, 0.5, 0.7) 0.50
Not Important (NI) (0.1, 0.3, 0.5) 0.30
Not Very Important (NVI) (0.0, 0.1, 0.3) 0.13
Not Important At All (EL) (0.0, 0.0, 0.1) 0.03
2.6. ILLUSTRATIVE EXAMPLE
An example to illustrate the service selection method is presented. In this example, five (5) users want to use an accounting software service to manage their business finances. This is show detail process of how the proposed service selection method works. Our choice of accounting application is the fact that unlike the airline
1 0 S at isf ac ti o n D eg re e 0.0 0.1 0.3 0.5 0.7 0.9 1.0 NIA NVI NI SI I VI EI
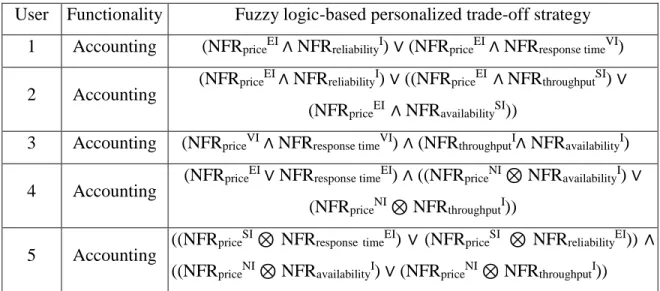
application presented later in Section 2.7.2 (which considers domain-depended non-functional attributes), the accounting application considers infrastructural non-non-functional attributes. This is to demonstrate that the proposed service selection method works for other domains with different non-functional attribute dimension. The accounting software should support automated banking, invoicing, and reporting. One area of concern is good pricing. Additional key quality factors should include reliability, availability, response time, and throughput. Each user submits their service request. The request includes both the functionality of the service and the personalized trade-off strategy, as tabulated in Table 2.3. Each non-functional attribute and its associated weight are specified using the following notation: NFANameWeight. For instance, NFAPriceEI indicates an extremely important weight, on a price non-functional attribute. The trade-off strategy is specified using logical AND (∧), logical OR (∨), or COMPROMISE (⊗) operators. After the functionality search in the data repository is completed, five (5) services satisfying the accounting functionality is obtained as shown in Table 2.4.
Table 2.3. List of Service Requests from 5 Different Users User Functionality Fuzzy logic-based personalized trade-off strategy
1 Accounting (NFRpriceEI ∧ NFRreliabilityI) ∨ (NFRpriceEI ∧ NFRresponse timeVI)
2 Accounting (NFRprice
EI ∧ NFRreliabilityI) ∨ ((NFRpriceEI ∧ NFRthroughputSI) ∨ (NFRpriceEI ∧ NFRavailabilitySI))
3 Accounting (NFRpriceVI ∧ NFRresponse timeVI) ∧ (NFRthroughputI∧ NFRavailabilityI)
4 Accounting (NFRprice
EI ∨ NFRresponse timeEI) ∧ ((NFRpriceNI ⊗ NFRavailabilityI) ∨ (NFRpriceNI ⊗ NFRthroughputI))
5 Accounting ((NFRprice
SI ⊗ NFRresponse timeEI) ∨ (NFRpriceSI ⊗ NFRreliabilityEI)) ∧ ((NFRpriceNI ⊗ NFRavailabilityI) ∨ (NFRpriceNI ⊗ NFRthroughputI))
The satisfaction degree of each non-functional attribute for all the users can be computed using both the membership function descriptions in Section 2.3 and the non-functional attribute values in Table 2.4. For instance, the satisfaction degree of
throughput non-functional attribute can be computed as 0.16. This is achieved using the
throughput value of service 4 (8.29 MBps) according to Table 2.4 and based on the membership function of the throughput non-functional attribute illustrated in Figure. 2.7.
Table 2.4. The List of Services and Their Non-Functional Attribute Values with Accounting Functionality Service Reliability (months) Availability (%) Throughput (mbps) Response time (seconds) Price (dollars) Service1 6 90 18.13 5 41 Service2 10 97 28.25 7 21 Service3 8 92 25.34 2 45 Service4 6 98 8.29 1 27 Service5 10 96 18.65 4 30
Figure 2.7. Fuzzified throughput value of service 4
Once the satisfaction degrees of individual non-functional attributes are obtained, an overall satisfaction of the non-functional attribute for a service can be computed. This computation is done based on how individual non-functional attributes are aggregated based on the discussion in Section 2.4. For user 1, the overall satisfaction value of service 1 can be computed as follows:
(NFRpriceEI (s1)∧NFRreliabilityI (s1)) ∨ (NFRpriceEI (s1)∧ NFRresponse timeVI (s1)) = MAX {MIN (0.36 × 0.97, 1 × 0.7), MIN (0.36 × 0.97, 0.72 × 0.87)}
5 25 0 1 Throughput (Megabytes/sec) S at isf ac ti o n D eg re e 8.29 0.16
= MAX {MIN (0.35, 0.7), MIN (0.35, 0.63)} = MAX {0.35, 0.35}
= 0.35
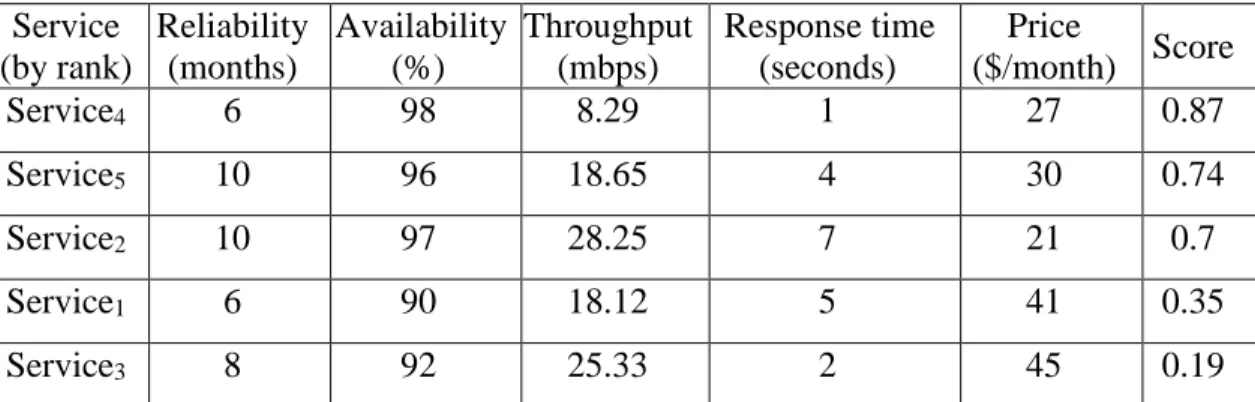
Similarly, the values for services 2 to 5 can be computed for user 1. The services are ranked according to these overall satisfaction values. Table 2.5 shows the ranked services based on user 1’s preferences.
For user 2, the overall satisfaction value of service 1 can be computed as follows: (NFRpriceEI (s1)∧ NFRreliabilityI (s1)) ∨ ((NFRpriceEI (s1)∧ NFRthroughputSI (s1)) ∨ (NFRpriceEI (s1)∧ NFRavailabilitySI (s1)))
= MAX {MIN (0.36 × 0.97, 1 × 0.7), MIN {MIN (0.36 × 0.97, 0.66 × 0.50), MIN (0.36 × 0.97, 0 × 0.5)}}
= MAX {MIN (0.35, 0.7), MIN {MIN (0.35, 0.33), MIN (0.35, 0)}} = MAX {MIN (0.35, 0.7), MIN (0.33, 0)}
= MAX {0.35, 0} = 0.35
Again, the overall satisfaction values of services 2 to 5 for user 2 can be computed and based on these values, the services ranked. Table 2.6 shows the ranked services based on user 2’s preferences.
User 3’s overall satisfaction value of service 1 can be computed as follows: (NFRpriceVI (s1)∧ NFRresponse timeVI (s1)) ∧ (NFRthroughputI (s1)∧ NFRavailabilityI (s1))
= MIN {MIN (0.36 × 0.87, 0.72 × 0.87), MIN (0.66 × 0.7, 0 × 0.7)} = MIN {MIN (0.31, 0.63), MIN (0.46, 0)}
= MIN {0.31, 0} = 0
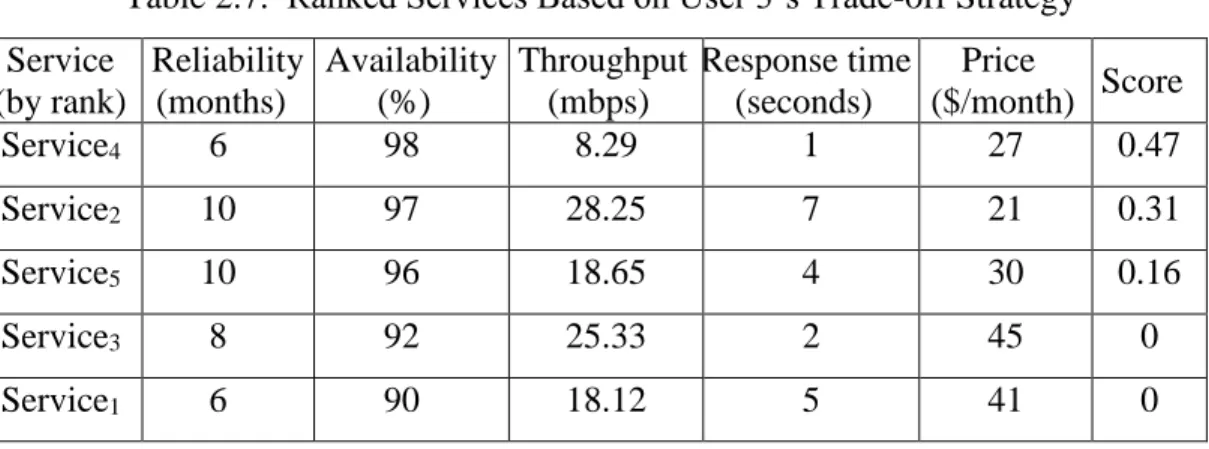
For services 2 to 5, the overall satisfaction value can be computed in a similar manner and the services are ranked based on these values. The ranked services based on user 3’s preferences are shown in Table 2.7.
For user 4, the overall satisfaction value of service 1 can be computed as follows: (NFRpriceEI (s1) ∨ NFRresponse timeEI (s1)) ∧ ((NFRpriceNI (s1) ⊗ NFRavailabilityI (s1)) ∨ (NFRpriceNI (s1) ⊗ NFRthroughputI (s1)))
AVERAGE (0.36 × 0.3, 0.66 × 0.7)}
= MIN {MAX (0.35, 0.7), MAX (AVERAGE (0.11, 0), AVERAGE (0.11, 0.46)} = MIN {MAX (0.35, 0.7), MAX (0.06, 0.29)}
= MIN {0.7, 0.29} = 0.29
Table 2.5. Ranked Services Based on User 1’s Trade-off Strategy Service (by rank) Reliability (months) Availability (%) Throughput (mbps) Response time (seconds) Price ($/month) Score Service4 6 98 8.29 1 27 0.87 Service5 10 96 18.65 4 30 0.74 Service2 10 97 28.25 7 21 0.7 Service1 6 90 18.12 5 41 0.35 Service3 8 92 25.33 2 45 0.19
Table 2.6. Ranked Services Based on User 2’s Trade-Off Strategy Service (by rank) Reliability (months) Availability (%) Throughput (mbps) Response time (seconds) Price ($/month) Score Service2 10 97 28.25 7 21 0.7 Service5 10 96 18.65 4 30 0.7 Service1 6 90 18.12 5 41 0.35 Service4 6 98 8.29 1 27 0.33 Service3 8 92 25.33 2 45 0.19
Similarly, the values of services 2 to 5 can be computed. Based on this overall satisfaction values, the services are ranked. Table 2.8 shows the ranked services based on user 4’s preferences.
User 5’s overall satisfaction value of service 1 can be computed as follows: ((NFRpriceSI (s1) ⊗ NFRresponse timeEI (s1)) ∨ (NFRpriceSI (s1) ⊗ NFRreliabilityEI (s1))) ∧
((NFRpriceNI (s1)⊗ NFRavailabilityI (s1)) ∨ (NFRpriceNI (s1) ⊗ NFRthroughputI` (s1)))
= MIN {MAX (AVERAGE (0.36 × 0.5, 0.72 × 0.97), AVERAGE (0.36 × 0.5, 1 × 0.97)), MAX (AVERAGE (0.36 × 0.30, 0 × 0.7), AVERAGE (0.36 × 0.3, 0.66 × 0.7))}
= MIN {MAX (AVERAGE (0.18, 0.7), AVERAGE (0.18, 0.97)), MAX (AVERAGE (0.11, 0), AVERAGE (0.11, 0.46))}
= MIN {MAX (0.44, 0.58), MAX (0.06, 0.29)} = MIN {0.58, 0.29}
= 0.29
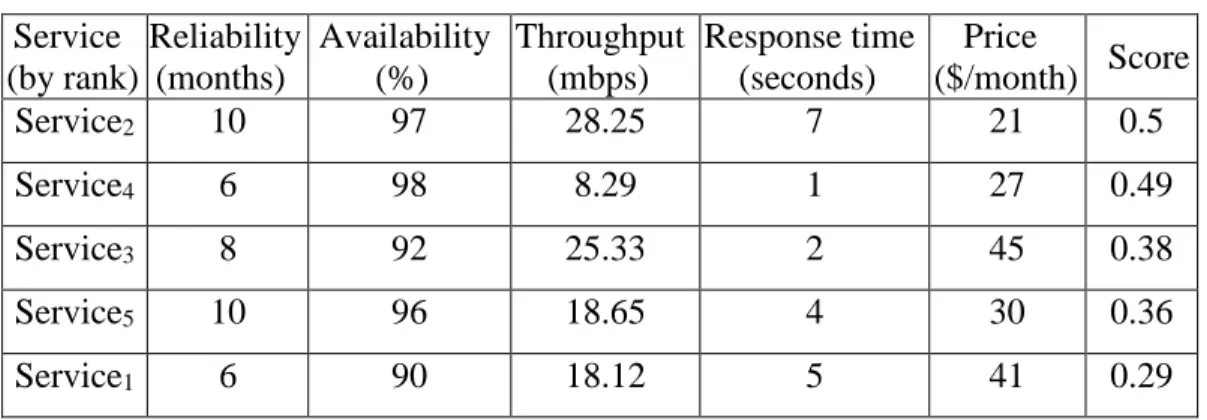
In a similar manner, the overall satisfaction function values of services 2 to 5 can be computed and the services are ranked based on these values. Table 2.9 shows the services ranked according to user 5’s preferences.
Table 2.7. Ranked Services Based on User 3’s Trade-off Strategy Service (by rank) Reliability (months) Availability (%) Throughput (mbps) Response time (seconds) Price ($/month) Score Service4 6 98 8.29 1 27 0.47 Service2 10 97 28.25 7 21 0.31 Service5 10 96 18.65 4 30 0.16 Service3 8 92 25.33 2 45 0 Service1 6 90 18.12 5 41 0
Table 2.8. Ranked Services Based on User 4’s Trade-off Strategy Service (by rank) Reliability (months) Availability (%) Throughput (mbps) Response time (seconds) Price ($/month) Score Service2 10 97 28.25 7 21 0.5 Service4 6 98 8.29 1 27 0.49 Service3 8 92 25.33 2 45 0.38 Service5 10 96 18.65 4 30 0.36 Service1 6 90 18.12 5 41 0.29
The results displayed in Tables 2.5 through 2.9 indicate that the recommended services for selection depend on a user’s personal trade-off preferences. For instance, the top-3 recommended services for user 1 are service 4, service 5, and service 2. Those for user 3 are service 4, service 2, and service 5. The difference in the results is due to the different personal trade-off preferences of the two users (user 1 and user 3).
Table 2.9. Ranked Services Based on User 5’s Trade-off Strategy Service (by rank) Reliability (months) Availability (%) Throughput (mbps) Response time (seconds) Price ($/month) Score Service2 10 97 28.25 7 21 0.5 Service4 6 98 8.29 1 27 0.49 Service3 8 92 25.33 2 45 0.38 Service5 10 96 18.65 4 30 0.36 Service1 6 90 18.12 5 41 0.29
2.7. PROTOTYPE IMPLEMENTATION AND ITS EVALUATION
2.7.1. Service Selection Prototype. This section describes the prototype for the framework. This prototype was implemented using both Microsoft Visual C# on .NET framework 3.5 and Microsoft Visual Studio 2008 Professional Edition under 64-bit Windows 7 Enterprise platform on AMD FX™-8350 8 core processor. The primary components of the prototype include: a services repository, a personalized trade-off strategy input parser, and the service ranking engine. With the exception of the services repository (which was implemented using SQL Server 2008), these components were implemented using both C# and regular expressions.
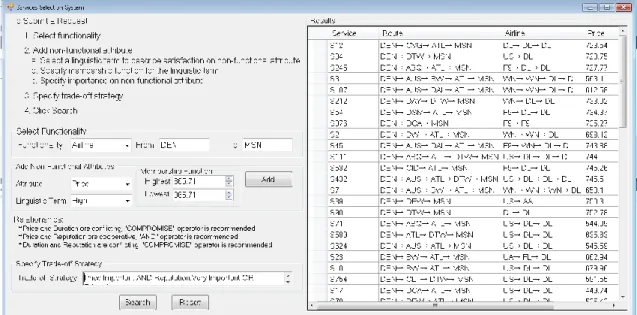
2.7.1.1 The input handler. The usability of the input handler was the main consideration during its design. The component was developed such that users will have convenience to specify their service request with ease. The trade-off strategy was captured in a sentence-like fashion (see Figure 2.8). The notation used is NFA1.weight
Operator NFA2.weight … An autocomplete feature to speed up the user-system interactions was also included with the trade-off strategy field. The data in the Attribute
combo box as well as the highest and lowest satisfactions are populated from a data source which makes this implementation very adaptable to different domains. As users select and add their preferred non-functional attributes, the system analyzes the relationship between pairs of non-functional attributes and recommends the appropriate operator for aggregation (see Figure 2.8). This is also provided in the Relationships box.
Figure 2.8. Screenshot of the personalized preference and trade-off based service selection prototype
It must be noted that the trade-off strategy does not impact the relationships that exist between any two functional attributes. The relationships between any two non-functional attributes reveal the interactions between those non-non-functional attributes. If the user’s choice of aggregation operators in the trade-off strategy is consistent with recommended aggregation operators, services with the best possible satisfaction of their non-functional attributes are returned back to the user. On the contrary, if the user’s choice of aggregation operators in the trade-off strategy is inconsistent with the recommended aggregation operators, services with a less satisfactory result as compared to the former results are returned.
To demonstrate this, a comparison of the results of two separate requests applied to the services in Table 2.4 was made. Request 1 has aggregation operators which are consistent with the recommended aggregation operators as follows:
Request 1: (NFRpriceEI ∧ NFRreliabilityI) ∨ (NFRpriceEI ∧ NFRresponse timeVI)
Request 2, which is similar to request 1 with respect to the number and types of non-functional attributes, has different aggregation operators than those recommended.
Request 2: (NFRpriceEI ⊗ NFRreliabilityI) ∨ (NFRpriceEI ⊗ NFRresponse timeVI)
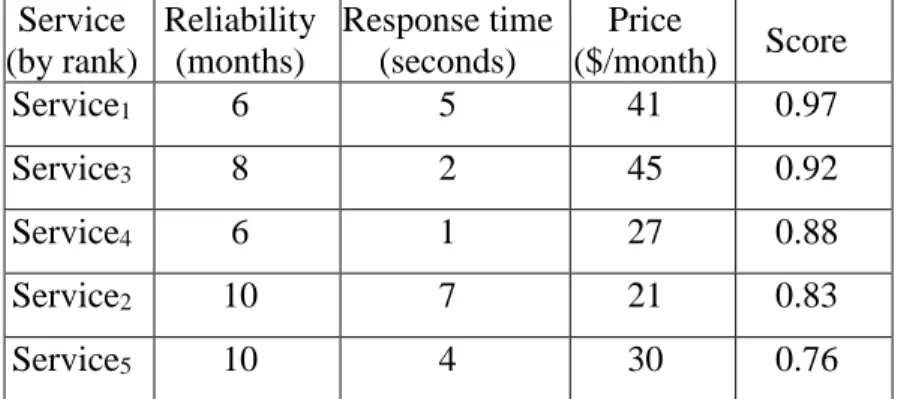
Tables 2.5 and 2.10 show the results for request 1 and request 2 respectively. The results show that, the top-ranked services produced by request 1 have a higher satisfaction of the non-functional attributes than the top-ranked services produced by request 2. Therefore, it is highly recommend that the recommended aggregation operators should be used by users when submitting their service request.
Table 2.10. Ranked Services Based on Request 2 Service (by rank) Reliability (months) Response time (seconds) Price ($/month) Score Service1 6 5 41 0.97 Service3 8 2 45 0.92 Service4 6 1 27 0.88 Service2 10 7 21 0.83 Service5 10 4 30 0.76
2.7.1.2 Functional matching engine. For this component, the algorithm proposed by Sajjanhar et al. [30] was adopted. The choice was mainly based on the fact that they employed the singular value decomposition in linear algebra which reveals relationship