Integration of Offshore Wind Farms
Through High Voltage Direct Current
Networks
Luke Livermore
School of Engineering
Cardiff University
A thesis submitted for the degree of
Doctor of Philosophy
ii
Contents
Abstract……….……..vi Declaration……….………..vii Dedication……….………..viii Acknowledgement……….………..ix Nomenclature……….………..x List of Figures……….……….………..xiii List of Tables………..……….…..xiv Chapter 1 – Introduction ………...1 1.1 BACKGROUND ... 11.2 OFFSHORE WIND FARMS ... 2
1.3 HVDC TRANSMISSION ... 4
1.4 THE GB TRANSMISSION SYSTEM IN 2020 ... 5
1.5 MORAY FIRTH MULTI-TERMINAL HVDC SYSTEM ... 6
1.6 RESEARCH OBJECTIVES ... 7
1.7 THESIS STRUCTURE ... 8
Chapter 2 - Literature Review………..………..10
2.1 HISTORY OF HVDC ... 10
2.2 CURRENT SOURCE CONVERTER ... 12
2.2.1 ARCHITECTURE AND OPERATION ... 12
2.2.2 CONTROL OF TWO-TERMINAL CSC’S ... 13
2.3 VOLTAGE SOURCE CONVERTER ... 14
2.3.1 ARCHITECTURE AND OPERATION ... 15
iii
2.3.4 CONTROL OF TWO TERMINAL VSC’S... 17
2.3.5 HIGH LEVEL/AUXILARY CONTROL FOR CSC’S AND VSC’S ... 20
2.4 MULTI-TERMINAL VOLTAGE SOURCE CONVERTER NETWORKS ... 21
2.4.1 LIMITATIONS OF CSC’S IN A MULTI-TERMINAL ENVIRONMENT ... 21
2.4.2 STEADY STATE CONTROL OF VSC-MTDC ... 23
2.4.3 PROTECTION REQUIREMENTS OF MTDC NETWORKS... 25
2.5 FAULT RIDE THROUGH FOR MTDC NETWORKS ... 25
2.5.1 FAST COMMUNICATIONS SYSTEMS TO DE-LOAD WIND TURBINES ... 27
2.5.2 POWER DISSIPATION USING A DC CHOPPER CIRCUIT IN THE DC NETWORK. 27 2.5.3 REDUCTION OF POWER FROM WIND GENERATORS WITHOUT COMMUNICATIONS ... 27
2.6 SUBSYNCHRONOUS RESONANCE ... 28
2.6.1 SOURCES OF SSR IN THE 2020 GB TRANSMISSION SYSTEM ... 30
2.6.2 EIGENVALUE ANALYSIS ... 31
2.6.3 IEEE FIRST BENCHMARK MODEL FOR SSR STUDIES ... 31
Chapter 3 - Damping of Subsynchronous Resonance using a VSC-HVDC Link………..35
3.1 INTRODUCTION ... 35
3.2 POTENTIAL FOR SSR IN THE 2020 GB NETWORK ... 35
3.2.1 THE THREE MACHINE NETWORK ... 36
3.2.2 IMPROVEMENTS IN THE THREE MACHINE NETWORKS ... 36
3.3 RESULTS FOR THE 2020 GB NETWORK ... 37
3.3.1 EIGENVALUE ANALYSIS ... 38
3.3.2 TIME DOMAIN SIMULATION IN PSCAD ... 40
iv
3.4.2 HYBRID CONTROL SYSTEM ... 48
3.5 SIMULATION RESULTS ... 50
Chapter 4 - An Experiment for Damping Subsynchronous Resonance using a VSC-HVDC Link………54
4.1 INTRODUCTION ... 54
4.2 DEVELOPMENT OF THE REAL TIME DIGITAL SIMULATOR FOR SSR STUDIES ... 54
4.3 CONFIGURATION OF THE VSC/HVDC RIG FOR SSR STUDIES ... 56
4.4 IMPLEMENTATION OF THE SSR DAMPER ... 58
4.4.1 DC VOLTAGE SOURCE ... 59
4.4.2 AMPLIFYING CONVERTER ... 59
4.4.3 DAMPING CONVERTER ... 59
4.5 EXPERIMENTAL RESULTS ... 61
4.6 COMPARSION OF SIMULATION AND EXPERIMENT ... 68
Chapter 5 - Fault Ride Through in Multi-Terminal DC Networks………69
5.1 INTRODUCTION ... 69
5.2 DESIGN OF THE FAULT RIDE THROUGH CONTROL SCHEMES ... 70
5.2.1 REDUCTION IN THE WIND FARM AC VOLTAGE ... 71
5.2.2 INCREASE IN THE WIND FARM AC FREQUENCY ... 72
5.2.3 POWER DISSIPATION THROUGH A DC CHOPPER... 74
5.2.4 REDUCTION IN WIND FARM AC VOLTAGE AND DC CHOPPER IN COMBINATION ... 74
5.3 THE SIMULATION PLATFORM ... 75
5.4 THE EXPERIMENTAL PLATFORM... 76
5.4.1 AC ONSHORE FAULT ... 77
v
5.5.2 INCREASE IN THE WIND FARM AC FREQUENCY ... 81
5.5.3 POWER DISSIPATION THROUGH A DC CHOPPER... 83
5.5.4 REDUCTION IN WIND FARM AC VOLTAGE AND DC CHOPPER IN COMBINATION ... 85
5.6 COMPARISON OF SIMULATION AND EXPERIMENT ... 87
5.7 DISCUSSION ... 87
Chapter 6 - Conclusions and Further Work ………..……….89
6.1 CONCLUSIONS ... 89
6.1.1 DAMPING SUBSYNCHRONOUS RESONANCE ... 89
6.1.2 FAULT RIDE THROUGH OF MTDC NETWORKS ... 90
6.1.3 CONTRIBUTIONS OF THE THESIS... 91
6.1.4 ACHIEVEMENTS OF RESEARCH ... 91
6.2 FURTHER WORK ... 93
6.2.1 AN ADAPTIVE SSR DAMPING CONTROLLER ... 93
6.2.2 FAULT RIDE THROUGH OF MTDC NETWORK WITH MULTIPLE ONSHORE GRID TERMINALS ... 93
APPENDIX A – THREE MACHINE SYSTEM PARAMETERS (IN P.U.) ... 94
APPENDIX B – CONTROL PARAMETERS ... 95
APPENDIX C – HARDWARE PARAMETERS ... 97
vi
Abstract
Name of University: Cardiff University Candidate’s Name: Luke Livermore Degree Title: Doctor of Philosophy
Thesis Title: Integration of Offshore Wind Farms through Multi Terminal High Voltage Direct Current Networks
Date: January 2013
The integration of offshore wind farms through Multi Terminal DC (MTDC) networks into the GB network was investigated. The ability of Voltage Source Converter (VSC) High Voltage Direct Current (HVDC) to damp Subsynchronous Resonance (SSR) and ride through onshore AC faults was studied.
Due to increased levels of wind generation in Scotland, substantial onshore and offshore reinforcements to the GB transmission network are proposed. Possible inland reinforcements include the use of series compensation through fixed capacitors. This potentially can lead to SSR. Offshore reinforcements are proposed by two HVDC links. In addition to its primary functions of bulk power transmission, a HVDC link can be used to provide damping against SSR, and this function has been modelled. Simulation studies have been carried out in PSCAD. In addition, a real-time hardware-in-the-loop HVDC test rig has been used to implement and validate the proposed damping scheme on an experimental platform.
When faults occur within AC onshore networks, offshore MTDC networks are vulnerable to DC overvoltages, potentially damaging the DC plant and cables. Power reduction and power dissipation control systems were investigated to ride through onshore AC faults. These methods do not require dedicated fast communication systems. Simulations and laboratory experiments are carried out to evaluate the control systems, with the results from the two platforms compared.
vii
Declaration
This work has not previously been accepted in substance for any degree and is not concurrently submitted in candidature for any degree.
Signed ... (candidate) Date ...
This thesis is being submitted in partial fulfilment of the requirements for the degree of PhD.
Signed ... (candidate) Date ...
This thesis is the result of my own independent work/investigation, except where otherwise stated. Other sources are acknowledged by explicit references.
Signed ... (candidate) Date ...
I hereby give consent for my thesis, if accepted, to be available for photocopying and for interlibrary loan, and for the title and summary to be made available to outside organisations.
Signed ... (candidate) Date ...
I hereby give consent for my thesis, if accepted, to be available for photocopying and for interlibrary loans after expiry of a bar on access previously approved by the Graduate Development Committee.
viii
Dedication
To my mother,
For inspiring my curious mind
ix
Acknowledgements
This thesis would not have been possible without the guidance and the help of several individuals, who in one way or another contributed and extended their valuable assistance.
My utmost gratitude to my supervisors, Dr. Jun Liang and Prof. Nick Jenkins for their unselfish and unfailing support throughout the PhD study. Special thanks also to Dr. Janaka Ekanayake and Dr. Carlos Ugalde-Loo for their steadfast patience, direction and encouragement on research projects.
I also would like to thank the members of the Power Electronics group at CIREGS, who provided me with a great deal of additional insight during many hours of weekly meetings and discussions. In particular, to Qing Mu, Tianjun Jing and Alasdair Burchill for their assistance in developing the experimental test rigs, so crucial to this research.
I am indebted to many colleagues and friends at the Institute of Energy for sharing their views on my work, whilst sharing coffee and cakes.
Last but not the least, I would like to thanks my loving family for all their support, patience and encouragement.
x
Nomenclature
Abbreviations and Acronyms
AC Alternating Current AI Analogue Input AO Analogue OutputCSC Current Source Converter DC Direct Current
ENSG Electricity Networks Strategy Group FACTS Flexible AC Transmission System FBM First Benchmark Model
FC Fixed Capacitor FRC Fully Rated Converter FRT Fault Ride Through GHG Greenhouse Gases GPC Giga Processor Card
GTWIF Giga Transceiver Workstation Interface Card HVDC High Voltage Direct Current
IEA International Energy Agency IGBT Insulated Gate Bipolar Transistor IGE Induction Generator Effect LRSP Load Reference Set Point MMC Multi Modular Converter
MTDC Multi-Terminal High Voltage Direct Current
OECD Organisation for Economic Co-operation and Development PSS Power Systems Simulator
PWM Pulse Width Modulation RTDS Real Time Digital Simulator
SSCI Sub Synchronous Control Interactions SSR Sub Synchronous Resonance
SUB Sub Synchronous Mode
TCSC Thyristor Controlled Series Capacitor TEC Transmission Entry Capacity
TI Torsional Interaction TM Torsional Mode
xi
Symbols
Control signal for AC voltage reduction
Control signal for wind farm frequency increase Control signal for wind turbine frequency increase Duty cycle of the DC chopper circuit
Voltage angle between V and V
V Voltage margin between DC voltages
f Wind farm frequency
f _ Rated wind farm frequency
i Three phase current
i _ Phase a damping current
i _ Phase b damping current
i _ Three phase damping current
Current at terminal A Current at terminal B Current at terminal C
i Current in the d-axis
i _ Reference current in the d-axis
i Current in the q-axis
i _ Reference current in the q-axis
k Co-efficient of frequency deviation
P Operating point of terminal A
P Operating point of terminal B
P Operating point of terminal C
P Active power
P Reference active power
P Wind farm power
P Wind farm power initial power
P Power dissipated in the DC chopper
Q Reactive power
Q Reference reactive power
R DC chopper resistance
V Voltage at the sending end of a transmission line
xii
V _ Phase a voltage from the amplifier converter
V _ Phase b voltage from the amplifier converter
V _ Phase c voltage from the amplifier converter
V _ Wind farm AC voltage
V _ _ Rated value of wind farm AC voltage
V Voltage in the d-axis
V _ Reference voltage in the d-axis
V _ SSR damping voltage in the d-axis
V DC voltage
V _ Reference DC voltage
V _ Threshold DC voltage for controller activation
V _ Maximum DC voltage
V Voltage in the q-axis
V _ Reference voltage in the q-axis
V _ SSR damping voltage in the q-axis
X Reactance
X Reactance of transformer at bus 2
X Reactance of transmission line to bus 2
X Reactance of transformer at bus 1
X Reactance of transmission line to bus 1
X Reactance of transmission line to bus 3
X Reactance of series capacitor
xiii
List of Figures
1.1 World energy consumption 1990-2035 ..……….2
1.2 Transmission Entry Capacity (TEC) for offshore generation projects………3
1.3 Offshore wind development map...……….…….4
1.4 Transfer capability across the England – Scotland border……….………..5
1.5 Caithness – Moray – Shetland potential reinforcements ……….7
2.1 History of HVDC systems ...………...11
2.2 Six-pulse converter bridge consisting of thyristor valves………12
2.3 Schematic of a point-to-point CSC in bipole configuration ..………..13
2.4 Two-level PWM waveform and topology……….….15
2.5 Three-level PWM waveform and topology……….….16
2.6 Multi-level MMC waveform and topology………16
2.7 Schematic of a point-to-point VSC in bipole configuration ..……….…….17
2.8 dq control scheme for a power regulation terminal……….……19
2.9 dq control scheme for a DC voltage regulation terminal ………..…….19
2.10 Typical power modulation controller………..20
2.11 Operating point for a two terminal system using the voltage margin method.23 2.12 Operating point for a three terminal system using droop control .……….….24
2.13 Operating point for a three terminal system using autonomous control ..……..24
2.14 Operating point for a converter using undead band droop control………..….25
xiv
2.17 Stability of the torsional modes in terms of series compensation level and relationship with the subsynchronous mode frequency ..……….……..34 3.1 Three machine network with onshore reinforcement through fixed capacitors
……….36 3.2 Shaft model of the Northern Scotland generator as a six mass system .………..37 3.3 Stability of the torsional modes in terms of series compensation level and
relationship with the subsynchronous mode frequency .……….39 3.4 Simulation results from the 2020 GB transmission network (a) frequency of
phase a current of the Northern Scotland generator (b) Northern Scotland electromagnetic torque……….……41 3.5 Simulation results from the 2020 GB transmission network. Torque interactions
in the multi-mass shaft of the Northern Scotland generator……….……….42 3.6 Three machine network with onshore and offshore reinforcements through
series capacitors and a VSC-HVDC link………44 3.7 Primary control system for terminal A………...45 3.8 Primary control system for terminal B……….………45 3.9 Terminal A of the VSC-HVDC link (a) step change in active power from 250MW to 150MW (b) step change in reactive power from 60MVar to 30MVar (absorbing)……….….46 3.10 Terminal B of the VSC-HVDC link (a) step change in DC voltage from 250kV to
150kV (b) step change in reactive power from 10MVar to 20MVar (generating)……….………..47 3.11 Hybrid control system, containing primary and auxiliary controllers, for the two
xv
Northern Scotland generator (b) Northern Scotland electromagnetic torque
...……….50
3.13 Hybrid controller in the VSC-HVDC link. Torque interactions in the multi-mass shaft of the Northern Scotland generator……….………51
3.14 Hybrid controller in the VSC-HVDC link (Terminal A). Active and reactive power modulation in the VSC-HVDC link………...…….………52
3.15 Hybrid controller in the VSC-HVDC link (Terminal A). Id and Iq modulation in the VSC-HVDC link ..………...…….………...53
4.1 Real time digital simulator………..………55
4.2 Fabricated AI/AO front plate for the RTDS………..56
4.3 VSC-HVDC test rig……….…….…56
4.4 Interface board fabricated to allow the exchange of analogue signals between the RTDS and VSC-HVDC test rig .………..57
4.5 Schematic of the experiment design……….…………..58
4.6 Signal exchange between the RTDS and the VSC-HVDC test rig for the amplifying converter………59
4.7 Signal exchange between the RTDS and the VSC-HVDC test rig for the damping converter………..…………59
4.8 Experimental results (RTDS signals) of the undamped case (a) frequency of phase a current of the Northern Scotland generator (b) Northern Scotland electromagnetic torque……….……61
4.9 Experimental results (RTDS signals) of the undamped case. Torque interactions in the multi-mass shaft of the Northern Scotland generator……….………….62
xvi
the subsynchronous component coming from the RTDS (b) Iq current of the subsynchronous component coming from the RTDS……….………..63 4.11 Experimental results (VSC-HVDC signals) of the undamped case. Three phase
damping current from the VSC-HVDC test rig (a & b phase) .……….………..63 4.12 Experimental results (VSC-HVDC signals) of the undamped case. Three phase
voltage from the amplifying converter……….………..64 4.13 Experimental results (RTDS signals) of the damped case (a) frequency of phase
a current of the Northern Scotland generator (b) Northern Scotland electromagnetic torque ..……….………64 4.14 Experimental results (RTDS signals) of the damped case. Torque interactions in the multi-mass shaft of the Northern Scotland generator ..………65 4.15 Experimental results (VSC-HVDC signals) of the damped case (a) Id current of
the subsynchronous component coming from the RTDS (b) Iq current of the subsynchronous component coming from the RTDS……….………..66 4.16 Experimental results (VSC-HVDC signals) of the damped case. Three phase
damping current from the VSC-HVDC test rig (a & b phase) .………..………….66 4.17 Experimental results (VSC-HVDC signals) of the damped case. Three phase
voltage from the amplifying converter………..………….67 4.18 Comparison of simulation and real-time results. Northern Scotland
electromagnetic torque with damping control (a) not active (b) active…………..68 5.1 Schematic for the wind farm side and control parameters………..…………..….71 5.2 Network schematic showing two wind farms connected to one AC grid
connection. An AC fault circuit is connected to the onshore terminal………….…76 5.3 Experimental platform, VSC-HVDC test rig and PSS………..…………76
xvii
connection. The wind turbine rigs are connected directly to the wind farm converters. The AC fault circuit is located on the PSS………..………77 5.5 AC voltage and current at the onshore terminal during the fault………..….78 5.6 FRT by reducing wind farm AC voltage. PSCAD simulation (left) and
experimental results (right) (a) DC voltage (b) control signal to set the AC voltage (c) power flows at the three terminals………....80 5.7 FRT by increasing wind farm frequency. PSCAD simulation (left) and
experimental results (right) (a) DC voltage (b) wind farm frequency (c) power flows at the three terminals ..………82 5.8 FRT by power dissipation in the DC chopper. PSCAD simulation (left) and
experimental results (right) (a) DC voltage (b) duty cycle for the DC chopper (c) power flows at the three terminals ..………..84 5.9 FRT by DC chopper and reduction in the wind farm AC voltage. PSCAD
simulation (left) and experimental results (right) (a) DC voltage (b) duty cycle for the DC chopper (c) power flows at the three terminals……….…86 5.10 Comparison of simulation and experimental results. The DC voltage from the
xviii
List of Tables
2.1 CSC and VSC comparison for MTDC networks……….……..22
2.2 Eigenvalues of the IEEE FBM ………..…….….34
3.1 Relevant eigenvalues of the three machine system………..40
3.2 Relevant control parameters for the hybrid control system………...49
1
Chapter 1 -
Introduction
1.1
BACKGROUND
Over the coming decades it is expected that the energy requirements of the global population will increase, this is shown in Figure 1.1. OECD (Organisation for Economic Co-operation and Development) countries such as the UK and USA, show a slight rise in energy consumption. Non-OECD countries undergoing major development and growth such as Brazil, Russia, India and China show a large rise in energy consumption [1]. This increased energy demand comes at a time when the world’s fossil fuel resources are becoming depleted and concern grows about the effect human beings are having on the Earth. The International Energy Agency (IEA) predicts that the share of global energy derived from fossil fuels will fall from 81% in 2010 to 75% in 2035 [2].
The nations of the European Union have committed themselves to reduce their emissions of Greenhouse Gases (GHG), by the year 2020 and onwards [3]. The Committee for Climate Change suggests energy targets of 15% renewable generation
2
by 2020 to meet the GHG reduction targets [4]. The Electricity Market Reform (EMR) white paper sets out the UK’s strategy for achieving a low-carbon economy [5–7].
Figure 1.1: World Energy consumption 1990-2035 [Quadrillion British Thermal Units (1 Quadrillion BTU = 1.05x10¹⁸ joules)] [1]
In the UK, renewable generation is increasing quickly. At the end of 2011, UK electricity capacity from renewable generation sources totalled 12.2GW, an increase of 2.9GW from the end of 2010 [8].
1.2
OFFSHORE WIND FARMS
To meet demanding energy targets, national governments are turning to mature renewable technologies such as wind to fulfil a large part of the generation targets [9– 12].
The UK’s most plentiful resource of renewable energy is wind power and is therefore expected to form a major part of future generation [13]. During 2011, onshore wind capacity increased by 596MW and offshore wind capacity increased by 497MW. Several large offshore wind farms are being developed such as Ormonde, Greater Gabbard, Walney and Sheringham Shoal [8].
3
Offshore wind farms planned for UK’s territorial waters are administered by The Crown Estate and a cumulative capacity of 16GW is planned for 2020 [14]. This is illustrated in Figure 1.2 which shows the Transmission Entry Capacity (TEC) of offshore wind farms up to the year 2020.
The distribution of planned offshore wind farms is shown in Figure 1.3 [13]. The wind farms of higher capacity are further from the shoreline and will therefore require long distance submarine transmission.
4
Figure 1.3: Offshore wind development map [13]
1.3
HVDC TRANSMISSION
All submarine transmission will need to use cables. However, AC cables suffer from a loss of active power capacity due to cable charging currents. This reactive current is the result of cable capacitance, increasing with cable length [15]. Therefore, it will not be possible to use AC cables to transport power from distant offshore wind farms These wind farms will therefore need to be connected through HVDC links, which does not suffer from such reactive power limitations. It is possible for power to be transmitted great distances by DC cable. However, transmission at DC requires AC/DC conversion at either end of the cable, which incurs power losses and expense. The ‘break even distance’, that is the distance where DC becomes more economically
5
attractive than AC, for cables is typically 40-70km [16]. An example of a wind farm where HVDC would be essential is Dogger Bank which is located 125-290km offshore [17].
1.4
THE GB TRANSMISSION SYSTEM IN 2020
The shift from centralised onshore generation to offshore generation requires the UK transmission system to be reinforced and expanded. As renewable generation needs to be sited where the fuel source is most plentiful, the efficient transmission of electricity becomes more important.
The Electricity Networks Strategy Group (ENSG) has produced a report into the reinforcements required to facilitate the connection of planned generation to the GB transmission network by 2020 [18]. As the majority of the load is in the south of England and many generation sites are planned in Scotland, particular pressure on the England-Scotland boundary is expected. The existing transmission network at this boundary consists of two 400kV double circuits, on the east and west coast of the country. Due to planning restrictions, it is unlikely permission would be given for an additional overhead line.
Figure 1.4 shows the proposed improvement in transfer capacity of the Scotland-England transmission boundary in the years up to 2020.
6
To ease congestion at this boundary a number of solutions are proposed in the ENSG report:
2.1GW Eastern HVDC Link from Peterhead in Scotland to Hawthorne Pit in England.
2.1GW Western HVDC Link from Hunterston in Scotland to Deeside in England Series and shunt compensation within the AC systems
Re-conductoring existing AC overhead lines.
The presence of series compensation in the GB system will not only alter line characteristics and their transient behaviour, but could also cause Subsynchronous Resonance (SSR) [19].
1.5
MORAY FIRTH MULTI-TERMINAL HVDC SYSTEM
A project in the north of Scotland represents the first opportunity for a multi-terminal HVDC network. The Caithness-Moray-Shetland (CMS) project [18], [20], [21] is considered as an ‘offshore HVDC hub’ connecting the island of Shetland with two onshore terminals either side of the Moray Firth.
The solution in Figure 1.5 shows the most economic and flexible way of connecting the wind farms from the generation rich island of Shetland with mainland Scotland. The proposed solution is a Multi-Terminal HVDC (MTDC) network consisting of three onshore terminals and an offshore hub terminal.
However, at this time MTDC networks present many technical challenges. In particular, the control and protection of such networks is immature. MTDC is the subject of research and development in academia and industry alike.
7
Figure 1.5: Caithness - Moray - Shetland potential reinforcements [18]
1.6
RESEARCH OBJECTIVES
The objective of this thesis was an investigation into the feasibility and capability of Voltage Source Converter (VSC) HVDC for the integration of offshore wind farms. Particular contributions in this area are:
To design a control system for the damping of subsynchronous resonance in the 2020 GB transmission system. This was achieved through the addition of an auxiliary control loop within the control system of a VSC.
To design and build a laboratory based experiment to demonstrate the
auxiliary subsynchronous resonance damper. The AC system was simulated on
8
To design several fault ride through control systems for multi terminal HVDC
networks, using power reduction and power dissipation techniques.
To design and build a laboratory experiment to demonstrate the fault ride
through control systems. A multi terminal VSC test rig was interfaced to a
power systems simulator to model an onshore AC fault.
1.7
THESIS STRUCTURE
The thesis consists of 6 chapters.
Chapter 1 outlines the relevant policy drivers for offshore wind farms and HVDC in the UK.
Chapter 2 contains a literature review of previous research into the use of HVDC in power systems. The chapter begins with the history of HVDC and the architecture and operation of HVDC converter technology. The relative advantages and disadvantages of the different types of converter for multi-terminal HVDC networks are discussed. Previous work related to fault ride through of wind turbines and point-to-point HVDC links is described. The phenomenon of SSR is described and the negative implications of subsynchronous resonance are discussed. Relating SSR to the GB network reinforcements, the potential sources of SSR are described. Previous work on an IEEE benchmark model for SSR studies is referenced.
Chapter 3 describes a controller for damping SSR using a VSC. An existing AC network model for the GB transmission system is described, with modifications to suit the 2020 transmission system. The AC network model is simulated with a series compensated transmission line, the results show that SSR occurs. A planned offshore HVDC link between Scotland and England was considered for damping SSR. Using a VSC-HVDC link an auxiliary controller is designed to damp external SSR power oscillations in the onshore transmission system. The controllers are designed to provide the primary functionality of a HVDC link such as active and reactive power regulation. The controller design was tested with PSCAD simulation software.
9
Chapter 4 describes an experiment designed to demonstrate the operation of the SSR damper devised in Chapter 3. The experiment uses a Real Time Digital Simulator (RTDS) to model the AC system, whilst a real time VSC-HVDC test rig models the DC system. The results from the experiment are compared with the simulation results from Chapter 3.
Chapter 5 describes several control systems for the Fault Ride Through (FRT) capability of MTDC networks during AC onshore grid faults. Power reduction and power dissipation methods are compared with a combined power reduction and dissipation method as an optimum commercial and technical solution. The controller designs are tested with PSCAD simulation software and on a laboratory based experiment. The experiment uses a VSC-HVDC test rig to model the multi-terminal DC network, the onshore fault is provided by a Power Systems Simulator (PSS). A comparison is drawn between the simulation and experimental results.
Chapter 6 outlines the conclusions from the work described in the thesis. Future work for the development of an adaptive SSR damper is discussed.
10
Chapter 2 -
Literature Review
2.1
HISTORY OF HVDC
The history of HVDC stems from the War of Currents in the late 19th century. With the electrification of towns and cities in its infancy, the decision over whether to use AC or DC was an important one [22], [23]. Ultimately AC won the war, primarily due to the invention of the transformer, making AC transmission the standard since this time. However, DC transmission always maintained a role within niche projects, such as the 20MW interconnection between the island of Gotland and mainland Sweden in the early 1950’s [24], [25]. The submarine transmission distance of 96km would have been too far for conventional AC cable transmission due to reactive power limitations. HVDC evolved through many types of converters between the 1950’s and the present day [26] as shown in Figure 2.1. Early HVDC projects used mercury arc valves, an evacuated chamber containing a cathode formed of mercury and an anode of carbon [27]. Upon heating an arc is formed, conducting electrons from the cathode to the anode, forming a rectifier. In the 1970’s semi-conductor thyristors were developed. These devices conduct when a gate pulse received, continuing until the voltage is
11
reversed [28]. For HVDC applications, thyristors are often placed in series and parallel to achieve the current and voltage ratings that are required. In the modern day, project designers have a choice between thyristor based converters and Insulated-Gate Bipolar Transistors (IGBT’s). The IGBT is semiconductor device, with full control over switching the device on and off [29]. This brings advantages in the form of advanced control of the HVDC valve, allowing the converter station to become more flexible.
Figure 2.1: History of HVDC Systems [25]
HVDC schemes are often classified by the converter devices and their operation [30]. In Current Source Converters (CSC), the DC current is kept constant with a small ripple using a large inductor, thus forming a current source on the DC side. Typically a CSC uses thyristor valves and requires a strong synchronous voltage source in order to commutate from one valve to another. In Voltage Source Converters (VSC), the DC voltage is kept constant and the converter typically uses IGBT’s this means that they are able to self commutate between valves.
HVDC schemes can be used to fulfil many power system needs such as: back-to-back converters connecting asynchronous or weak AC systems, long distance overhead
12
transmission, underground and submarine cable transmission and the increasing connection of renewable generation [16].
2.2
CURRENT SOURCE CONVERTER
Conventional HVDC transmission uses line commutated, current source converters based on thyristor valves. HVDC conversion is achieved through the use of a 6-pulse Graetz bridge, where the 3-phase supply commutates six times within a period [16]. Although the bidirectional transfer of active power is possible, the converter can only absorb reactive power. The commutation is performed by the voltage source and the leakage reactance of the converter transformer generally dominates the commutation circuit, in addition the firing angle of the thyristor dictates the level of reactive power consumption. Therefore, the fundamental component of the current lags the voltage. LCC based systems are highly reliable and are used extensively, either for long distance connections or back-to-back converters connecting asynchronous AC systems.
2.2.1 ARCHITECTURE AND OPERATION
The basic architecture of a CSC is a six-pulse converter bridge consisting of thyristor valves shown in Figure 2.2.
13
For current to flow through the valve the voltage across the valve should be positive and a firing pulse must be given to the thyristor. The current flow will end once the voltage across the valve becomes negative. The instant when the valve starts to conduct current or ‘turn-on’ can be controlled by delaying the firing pulse. This method permits the average value of the outgoing voltage of the converter to be changed. The instant when current conduction ends or ‘turn-off’ cannot be controlled as the reversal of current is external to the converter [31].
2.2.2 CONTROL OF TWO-TERMINAL CSC’S
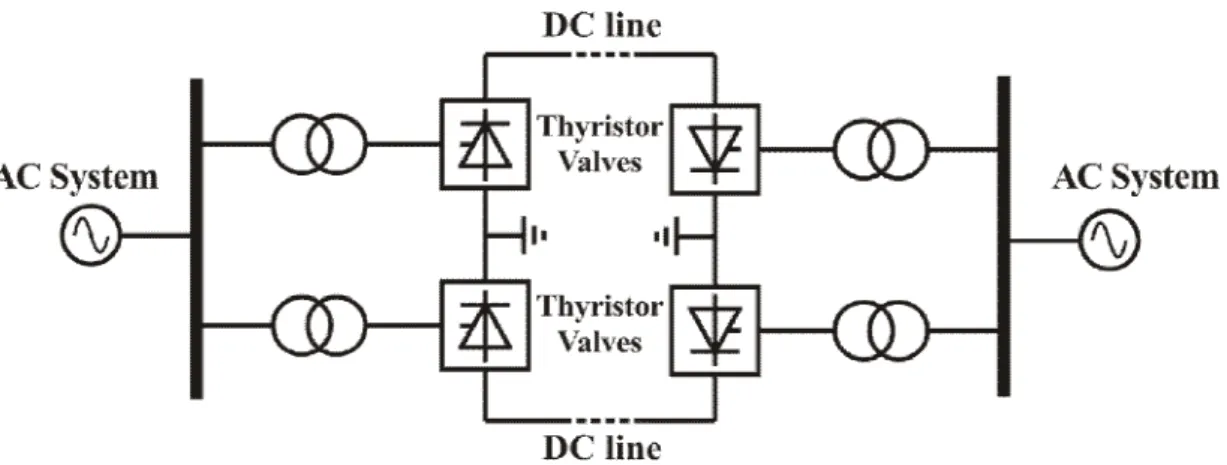
A schematic for an HVDC point-to-point bipole link comprising of CSC converters is shown in Figure 2.3.
Figure 2.3: Schematic of a point-to-point CSC in bipole configuration
In a point-to-point scheme, the DC current is controlled by generating a larger voltage at the rectifier with respect to the inverter, thus creating a voltage drop across the transmission line resistance.
Hence DC voltage and DC current are fully controllable. Usually the inverter controls DC voltage, leaving the rectifier free to control DC current by varying its voltage. This is because in a fault condition, the fault current is limited at the rectifier, protecting the DC plant and cables.
The main parameters used to control DC voltage are the AC voltage, usually through a transformer on-load tap changer, and the firing angle of the thyristors. The response of changing firing angle is much faster, as this can be achieved on a cycle by cycle basis. A
14
tap change is a mechanical process and therefore is slower. In reality, it is often beneficial to use a combination of firing angle control and AC voltage control to meet the control objectives [15].
To ensure smooth operation, the control system operates a hierarchy of layers designated as station control, pole and valve control [29]:
1. Station Control: This high level control gives power orders and also manages
auxiliary functions such as harmonic filter switching and shunt capacitors, which may need to be switched in or out due to changing conditions.
2. Pole Control: This layer derives the firing order of the pole converters following
signal to change a power or DC voltage order.
3. Valve Control: This valve controller specifies the firing instants of the valves
within a bridge and is also responsible for defining the firing angle limits.
Two-terminal CSC projects continue to increase in capacity, in 2010 a ±800kV DC system in Guangzhou, China was commissioned [32]. This link connects the large generation areas in western China with the large load areas of eastern China.
2.3
VOLTAGE SOURCE CONVERTER
Using VSC’s allows a more flexible HVDC transmission solution based on using self commutating, fully controllable valves such as the IGBT. The technology is a development of low power motor control converters, which are now applicable to HVDC due to the increase in their valve ratings.
Advantages of VSC-HVDC over CSC-HVDC include the absence of commutation failure, they are fully functional with weak or passive AC grids, full control over active and reactive power, the terminal footprint is smaller and terminals can operate as STATCOM’s when not connected to the DC line [33].
15
2.3.1 ARCHITECTURE AND OPERATION
The architecture of VSC converters have been constantly developing in recent times. Topologies fall generally into two categories; Two/Three Level Pulse Width Modulation (PWM) Converters and Multi-Level converters [34].
2.3.2 TWO/THREE LEVEL PWM CONVERTERS
Early VSC projects used two-level voltage converters, which use PWM to switch between voltage levels as shown in Figure 2.4. The sinus shaped waveform is formed through smoothing reactors.
Figure 2.4: Two-level PWM waveform (left) and topology (right)
Uniform voltage distribution is ensured through switching all series connected devices simultaneously. The large voltage steps cause high component stresses, harmonics and high frequency noise.
A commercial topology is ABB’s HVDC Light© solution [35]. This topology has been used in projects such as Troll A project in Norway, a HVDC point-to-point link connects the offshore natural gas platform with Norway’s onshore grid [36].
The waveforms can be improved through a third level shown in Figure 2.5, although AC filters are still required. These are the product of topologies such as the diode-clamped neutral point converter and the flying capacitor converter described in [37].
16
Figure 2.5: Three-level PWM waveform (left) and topology (right)
2.3.3 MULTILEVEL CONVERTERS
Recently commercial and academic research has been focussed on multi-level topologies, which use smaller voltage steps to build a sinus waveform.
A typical example of a commercial multilevel topology is Siemens Modular Multilevel Converter (MMC), HVDC Plus© [38]. In this topology the MMC consists of six converter arms, with each arm containing power modules in series. Each power module can be controlled individually to either charge the capacitor within the module or leave the capacitor unchanged. This builds the voltage in small voltage steps as power modules are switched in and out. The development of a sinus waveform can be seen in Figure 2.6. The MMC topology has been used successfully in the Trans Bay Cable project in San Francisco, USA [39].
Figure 2.6: Multi-level MMC waveform (left) and topology (right)
Alstom Grid’s HVDC MaxSine© topology [40] works in a similar way. The voltage waveform is created through the use of multi-level converter cells, however the
17
current is directed to the appropriate DC or AC network through series IGBT director switches [41].
The benefits of such approaches compared to PWM topologies are: lower component stresses, lower generation of harmonics, lower switching losses and omission of snubber circuits [42], [43].
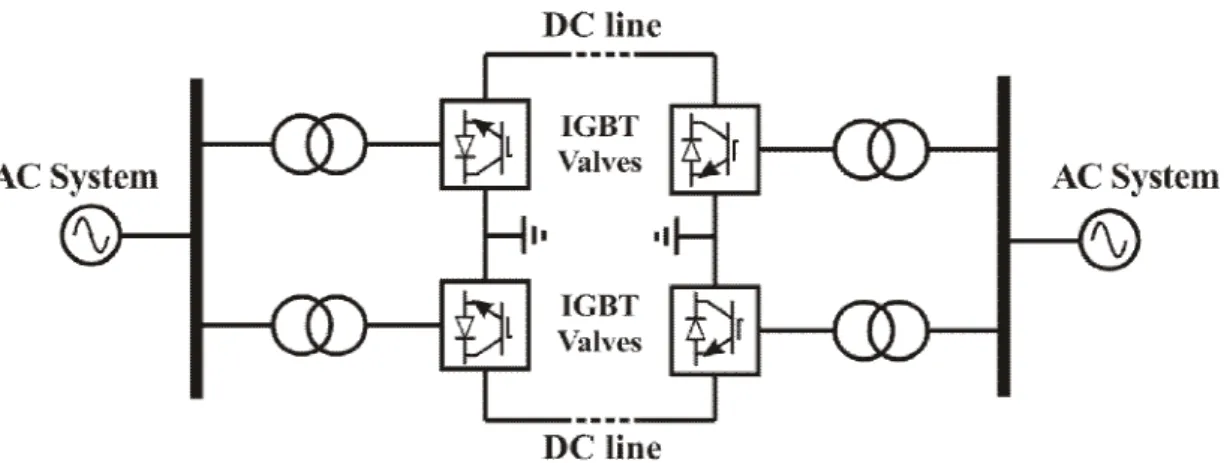
2.3.4 CONTROL OF TWO TERMINAL VSC’S
A schematic for a HVDC point-to-point link comprising of VSC converters can be seen in Figure 2.7.
Figure 2.7: Schematic of a point-to-point VSC in bipole configuration
VSC imposes no restriction of current direction, so the direction of power flow can be changed without the need to reverse voltage polarity. However, there is a requirement for the voltage polarity remain the same [44].
In two terminal schemes, it is common for one converter to operate in DC voltage regulation mode (slack bus) and one converter to operate in power regulation mode. Unlike CSC there is no restrictions on which terminal provides voltage or power control. The system can, therefore, be designed to suit the AC systems (the power controlling converter at the weaker AC system side).
VSC converters can control power injected into DC lines through voltage magnitude and voltage angle control with AC systems. The voltage magnitude and angle of the AC system are set by the configuration of the onshore AC system, whereas the voltage
18
magnitude and phase of the converter can be fully controlled [45]. Controlling the converter relative to the AC system allows a controlled voltage drop across the total reactance (valve reactance plus the leakage reactance of the converter transformer) to determine the reactive current through the converter [29].
Real power is controlled by a change in phase angle:
=
(1)
Whereas, reactive power is controlled by a change in voltage magnitude:
=
(2)
Alternatively the system can operate in dq control mode, where three phase voltages and currents are transformed to a direct-quadrature reference frame [46]. In this control scheme, secondary controls are used to set whether the converter is operated as a DC voltage regulation bus and the other in real power regulation bus. This provides current reference orders; the measured currents are controlled to match these orders by the primary current controllers.
For a point-to-point scheme where one terminal is a wind farm, a typical control scheme would be to operate the wind farm side as the power regulation terminal (to establish the wind farm AC voltage) and the onshore grid connection as the DC voltage regulation bus [47]. Figures 2.8 and 2.9 show typical control systems for power regulation and DC voltage regulation assuming multilevel VSC converter are used.
For point-to-point schemes between two onshore AC grid terminals, a typical control system would be to operate one terminal as constant power regulation and with the other operating in DC voltage regulation mode [48].
19 P o rd e r Q o rd e r
Figure 2.8: dq control scheme for a power regulation terminal
20
2.3.5 HIGH LEVEL/AUXILARY CONTROL FOR CSC’S AND VSC’S
In addition to controlling the HVDC link in ‘steady-state’ conditions, coordinated system control functions are often included for such capabilities as frequency control, power modulation control and power demand override.
Taking the example of power modulation control, the power being transferred through a HVDC link can be automatically modulated typically in the range 0.1 to 2Hz. This is to provide damping to low frequency power oscillations within either, or both, interconnected AC systems as determined by studies during the design phase of the HVDC scheme as shown in Figure 2.10 [15].
21
2.4
MULTI-TERMINAL NETWORKS
Two terminal HVDC projects are well established and provide transmission links between areas of generation and demand. However, for the technology to evolve, multi-terminal HVDC (MTDC) grids are needed to improve redundancy, flexibility and cost effectiveness. With prototype DC breakers described [49] and power ratings of VSC converters improving, technical barriers to MTDC grids are being removed.
The prime candidate for an MTDC grid could be the North Sea [50–52]. European governments have supported this through the North Sea Countries Offshore Grid Initiative (NSCOGI) [53], [54]. The large number of wind farms in this area, combined with the benefits of interconnection between nations makes this an attractive proposition.
2.4.1 LIMITATIONS OF CSC’S IN A MULTI-TERMINAL
ENVIRONMENT
Following the success of two-terminal CSC-HVDC schemes, the next logical step was to extended towards Multi-Terminal HVDC (MTDC) networks. Multi-terminal projects such as the SACOI (Sardinia-Corsica-Italy) and the Quebec-New England (Q-NE) project were developed in the early 1990’s. The Q-NE project was originally intended to consist of five terminals, however due to reliability issues, only three terminals remain connected [55].
Table 2.1 below details the behaviour of MTDC networks consisting of CSC and VSC technology from the CIGRE report on the feasibility of MTDC grids [56].
22 Table 2.1: CSC and VSC comparison for MTDC networks [56]
CSC VSC
Power Reversal Mechanical switches for
voltage reversal as the current cannot change sign.
Change of current direction within the converter. There is no need for mechanical switches.
AC Disturbance Commutation failure: short
circuit of the HVDC grid for some time.
No more influence than some loss of active power.
AC Connection Limited to medium and
high short circuit capacity networks.
Connection to electrically weak AC-network or even black AC-network. Fault ride through capability.
AC Voltage Support Always consumes ~50%
reactive power.
Support of reactive power.
DC Side Short Circuit DC grid breaker needed in
overlay HVDC grid.
DC grid breaker needed in overlay HVDC grid.
With the likelihood being that MTDC network will require the flexibility to include wind farms and other weak AC networks, along with the difficulties of power reversal, VSC technology offers a better option for MTDC networks.
The main technical challenges associated with achieving MTDC grids regard the control and protection of such networks. Although some VSC-MTDC projects are in the planning stage, no project has yet to be completed.
23
2.4.2 STEADY STATE CONTROL OF VSC-MTDC
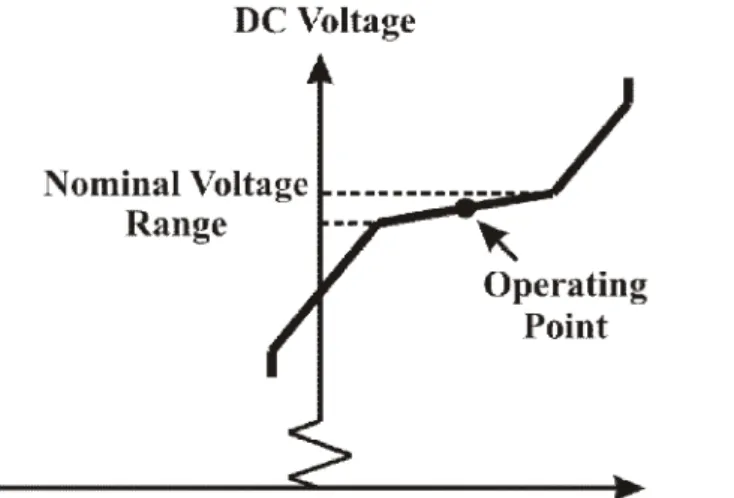
A simple form of MTDC network control is the voltage margin method described in [57] and shown in Figure 2.11. This control system assigns one converter the role of slack bus. As this converter reaches its voltage limit, it switches to constant power control. Instead another converter becomes the slack bus. The control scheme could work well for small MTDC networks with converters of similar ratings. However for large MTDC networks with converters of different capacities, constant changes to the converters operating conditions would make the system volatile.
Figure 2.11: Operating point for a two terminal system using the voltage margin method [57] Alternatively, a single slack bus converter could be replaced by sharing the voltage regulation across several converters, described as voltage droop control [58], [59]. This is an adaption of the operation of AC networks and therefore well understood by the power systems community, the operating points of a three terminal system are shown in Figure 2.12. Here the two wind farm terminals have an overlapping DC voltage droop characteristic, which allows the DC voltage to increase or decrease in a smoother fashion in the DC network.
24
Figure 2.12: Operating point for a three terminal system using droop control [59]
Autonomous converter control of a MTDC grid is presented in [60] by Alstom Grid. Here AC network control practices are applied to a MTDC networks. Each converter is given a target DC voltage called a Load Reference Set Point (LRSP) and aims to match the reference as shown in Figure 2.13. The three coloured lines represent three separate terminals. This is similar to the target AC frequency reference sent to power plants for primary frequency response.
Figure 2.13: Operating points for a three terminal system using autonomous control [60] The merits of combining voltage margin and droop are explored in [61] with undead-band voltage droop control. Here the MTDC network operates at a reduced droop close to the operating point and with a steeper droop close to voltage limits. This helps
25
to keep active power balance within large MTDC networks. The operating point for a single converter using undead-band control is shown in Figure 2.14.
Figure 2.14: Operating point for a converter using undead-band droop control
2.4.3 PROTECTION REQUIREMENTS OF MTDC NETWORKS
AC circuit breakers have been understood and used in AC networks since transmission systems have been operational. Upon opening of the circuit breaker, arcs between the circuit breaker contacts are extinguished at current zeros. However in DC systems, DC current has no zeros so arcs remain, damaging the contacts. However with high power DC circuit breakers in the prototype stage [49], this problem should be overcome. The protection of a MTDC network is described in [62], which uses DC circuit breakers and fast DC switches. In [63] the topologies of MTDC networks are investigated to find the optimum arrangement, minimising DC circuit breakers.
2.5
FAULT RIDE THROUGH FOR MTDC NETWORKS
Fault ride through capability is a key consideration for the operation of offshore MTDC networks, particularly when satisfying the grid codes specified by onshore transmission operators [64]. Most European Grid Codes specify that during short-term reductions in terminal voltage, generators should remain connected to the grid. This is often illustrated through voltage-time limit curves [65], National Grid Ltd defines FRT connection limits for the Supergrid through the curve in Figure 2.15.
26
Figure 2.15: National grid FRT requirement for the Supergrid [65]
If there is a drop in AC voltage near an onshore converter, power cannot be completely transferred to the AC grid through this converter. This will cause an imbalance in the power imported and exported from the DC network which will in turn cause an under/over-voltage of the DC grid. A multi-terminal HVDC network has an advantage over a point-to-point HVDC link because some power can still be transferred between the DC and AC grids through other AC grid-connected converters.
Fast fault ride through approaches are required to reduce DC overvoltages, where DC currents are limited by constraints within the converters. DC overvoltages can be responsible for damage to cables and equipment. A number of methods to prevent DC overvoltages have been proposed in the literature [47] [48], which can be broadly grouped as:
Fast communication systems to de-load wind turbines Local control using DC chopper circuits in the DC network
27
2.5.1 FAST COMMUNICATIONS SYSTEMS TO DE-LOAD WIND
TURBINES
Fast communication systems can be used to reduce the power from the wind turbines when faults occur within AC onshore networks. In [68] a DC voltage droop controller for de-loading Fully Rated Converters (FRC’s) was implemented.
The disadvantage of this approach is the reliability and inherent delays in communications, which means that the power reduction may not be quick enough to protect equipment from DC overvoltage damage.
2.5.2 POWER DISSIPATION USING A DC CHOPPER CIRCUIT IN
THE DC NETWORK
A robust solution for power dissipation is the introduction of a DC chopper circuit into the DC network. In the event of an onshore AC fault the excess energy within the DC network can be dissipated as heat through this DC chopper circuit. Any wind farms connected to the DC network are unaffected by this approach.
In [69] a DC resistor with a simple controller was implemented for fault ride through. The use of a DC resistor with chopper circuit means additional cost and space is required. A severe AC fault may cause the DC chopper resistor to overheat and plant to be damaged on the DC network.
2.5.3 REDUCTION OF POWER FROM WIND GENERATORS
WITHOUT COMMUNICATIONS
As a DC rise is detected, the wind farm converters of the VSC-MTDC takes appropriate action to reduce the voltage amplitude of the wind farm AC network so as to reduce the active power imported into the DC network. This in turn reduces the DC voltage to its nominal value as energy balance is restored. Any AC voltage drop in the offshore network would need to be suitable for any machine type that could be connected to the wind farm. The stable operation of the wind turbine relies on a low voltage ride through capability by the turbine [70], [71].
28
An alternative to reducing the voltage in an offshore AC wind farm network is to increase the frequency of the offshore AC wind farm network. When a variation of the wind farm frequency is sensed by the wind turbine converter through a Phase Locked Loop (PLL), a reduction in active power from the wind turbine occurs. As the frequency change is usually relatively slow, frequency response loops would need to be enhanced to detect frequency change within a few milliseconds.
Voltage reduction and frequency increase power reduction methods both operate without the requirement for fast communication systems. The control signals for wind turbine generators to reduce power output are contained within the wind farm AC voltage (or frequency).
Other work in this area has included a combined method, which uses both frequency increase and voltage reduction controllers. In [58] a decrease in wind farm AC voltage was performed in a multiterminal network as part of the DC voltage droop control scheme. In [72] a two stage controller was implemented, where a small increase in DC voltage is detected, the AC frequency controller is activated to reduce power from the wind turbines through pitch regulation. Under more extreme conditions, where a larger DC overvoltage is detected, a voltage reduction controller is activated.
2.6
SUBSYNCHRONOUS RESONANCE
Given the reinforcements and developments in power systems in the UK, there is a re-emergence of interest in Subsynchronous Resonance (SSR). The IEEE defines SSR as [73]
“…Subsynchronous resonance encompasses the oscillatory attributes of electrical and mechanical variables associated with turbine-generators when coupled to a series capacitor compensated transmission system where the oscillatory energy interchange is lightly damped, undamped, or even negatively damped and growing.” From this general description, SSR can be further divided into distinct interactions which generate subsynchronous effects [74]:
29
Induction Generator Effect (IGE) is a self excitation phenomenon which can occur in
steady state conditions. The slip of the machine is negative as the rotor speed is higher than the magnetic field speed. It therefore behaves as an induction generator for induced subsynchronous currents on the machine rotor and exhibits a negative resistance. If the net resistance in the entire armature circuit is negative, self excitation occurs.
Torsional Interaction (TI) occurs when one of the natural torsional modes of the
turbine-generator shaft is close to the induced subsynchronous torque in the generator and is more serious than IGE. The result of this interaction is increasing torque shaft oscillations, TI was traced to shaft failures at the Mohave generating station in the USA [75].
Transient Torques results from system disturbances in the network which excites
oscillatory torques on the turbine-generator shaft. Following transient conditions, large torques can occur due to SSR interactions. Although these interactions may be damped and the torque decays eventually, repeated occurrences lead to shaft fatigue.
Subsynchronous Control Interactions (SSCI) results from control interaction between
voltage sourced converters of Type 3 wind turbines with series compensated transmission lines. This has occurred where system faults have left wind turbines radially connected to series compensated transmission lines [76].
30
2.6.1 SOURCES OF SSR IN THE 2020 GB TRANSMISSION SYSTEM
The ENSG [18] has detailed the reinforcements planned in the GB transmission system by 2020. These plans include the use of series compensation in the onshore AC network and HVDC links, a potential source of SSR.
Series Compensation
Series compensation is the addition of capacitors in series to a transmission line to reduce the overall reactance of the transmission line. Power transfer across a line can be expressed [77]:
=
( )
(3)
where:
P = Active power transfer
V1,V2 = Voltages at either end of the transmission line
XLINE = Line reactance
XC = Reactance of the capacitor
In addition to increasing active power transmission over the circuit, series compensation also increases the angular and voltage stability of the line [78], [79]. This is due to the reduction in the overall reactance of the line which effectively reduces the angular difference ( ) between the line ends. These features have lead to the application of series compensation on long transmission corridors [80].
The GB network is unlike previous series compensated networks as it is tightly meshed. Additional load in England and generation capacity in Scotland have demanded the substantial reinforcement to the Anglo-Scottish AC transmission line. The current constraint on the circuit is 3.3GW due to stability limitations, this is below its thermal limit of 4.5GW [19]. The latest ENSG report [18] proposes multiple potential sites for series compensation across the England-Scotland boundary.
31
The nature of this series compensation could be either a Fixed Capacitor (FC) or Thyristor Controlled Series Capacitor (TCSC) [81][82]. The most common, simplest and cost-effective method of series compensation is through FC’s, although SSR should be considered in this case. TCSC’s are a more expensive and complex technical solution, however SSR would be avoided or even damped [83]. By controlling the firing angle of thyristors the effective reactance of the TCSC can be modified, together with the electrical resonant frequency of the compensated line [84].
HVDC Converters
Another source of SSR can be CSC’s themselves. Rectifier current controllers can inject large currents into the AC network between 20Hz and 25Hz. Alstom Grid [15] design HVDC control schemes which ensure positive damping for all interactions that their converter controllers generate. EPRI provide a guide for measuring and damping SSR in HVDC systems in [85].
A common method for damping power oscillations (such as SSR) is through active and reactive power modulation [86], [87].
In [88] it is shown that the current controllers in VSC rectifiers do not interact with AC systems in the same way and therefore do not contribute to SSR themselves.
2.6.2 EIGENVALUE ANALYSIS
A common approach for examining the vulnerability of a system to SSR is to perform an eigenvalue analysis. Eigenvalue analysis uses linear, state space equations to evaluate system conditions and find resonant modes. Mathematical models of elements in a power systems network for eigenvalue analysis can be found in literature [74], [89], [90].
2.6.3 IEEE FIRST BENCHMARK MODEL FOR SSR STUDIES
Following concerns regarding the negative impact that SSR could have in power systems, the IEEE Working Group on SSR introduced the IEEE First Benchmark Model (FBM) for SSR Studies [91]. The FBM is a simple power network consisting of an infinite
32
bus connected to a synchronous generator through a series compensated transmission line as shown in Figure 2.16.
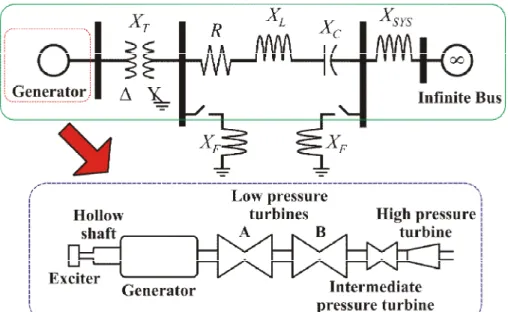
Figure 2.16: The IEEE First Benchmark Model
The FBM is based on a section of the USA’s transmission system, the Navajo generation and transmission project [92]. The model consists of an 892.4MVA generator connected via a 500kV transmission line to an infinite bus, operating at 60Hz. To examine the interaction with the turbine-generator shaft, a multi-mass mechanical system consisting of four turbine sections, the generator and an exciter is modelled. Later a Second Benchmark Model, consisting of an additional generator and parallel transmission lines was presented [93].
A complete eigenvalue analysis and state space model of the IEEE FBM is carried out in [94] and the results are expressed in Table 2.2 and Figure 2.17. The IEEE FBM is characterised by four unstable torsional modes (TM1-4), associated with the shaft of the generator, which may become excited at different compensation values. Figure 2.17 plots the ranges of series compensation levels at which interaction and instability may occur. Where the real part of the eigenvalue is negative, the system is stable. Areas where the real parts of the eigenvalue are positive are considered unstable and the system is susceptible to SSR. The unstable areas occur at series compensation levels where the subsynchronous mode (SUB) frequency is in the vicinity of a torsional
33
mode frequency and is therefore considered a torsional interaction. A torsional interaction is likely to occur between the subsynchronous mode (SUB) and the relevant torsional mode (TM1-4) in this vicinity.
Table 2.2 shows the results of the eigenvalue analysis for a series compensation level of 60%. This example shows that at 60% compensation, the subsynchronous mode (SUB) crosses torsional mode 3 (TM3), here the real part of the eigenvalue is positive. An eigenvalue analysis has also been carried out on the IEEE 14-bus five machine system in [95]. In this meshed AC system, SSR is also present for certain series compensation levels on certain AC transmission lines. The risk of SSR to generating stations should be assessed on a case by case basis when series compensation is considered.
34
Table 2.2: Eigenvalues of the IEEE FBM (60% Compensation)
Eigenvalue Real part
[s-1]
Imag. part [rad/s] Frequency
[Hz] Mode of oscillation 1,2 –1.173 ±298.174 47.4559 TM5 3,4 –0.2249 ±202.7425 32.2675 TM4 5,6 +0.2984 ±159.7359 25.4228 TM3 7,8 –0.0463 ±127.0871 20.2265 TM2 9,10 –0.0895 ±99.4971 15.8355 TM1 11,12 –0.4338 ±9.7113 1.5456 TM0 13 –40.3219 14 –24.7941 15 –2.9386 16 –0.2135 17,18 –4.9354 ±598.5525 95.2626 SUPER 19,20 –4.4069 ±155.9041 24.8129 SUB
Figure 2.17: Stability of the torsional modes in terms of series compensation level and relationship with the subsynchronous mode frequency [94]
35
Chapter 3 -
Damping of Subsynchronous Resonance using a
VSC-HVDC Link
The results in this chapter were the product of collaborations with Dr. Carlos Ugalde-Loo, Cardiff University.
3.1
INTRODUCTION
Series compensation and HVDC links are proposed to reinforce the GB transmission network. The inland reinforcements include the use of series compensation through fixed capacitors. This potentially can lead to Subsynchronous Resonance (SSR). The offshore reinforcements are proposed in the form of two HVDC links and it is possible that one of these links will use VSC technology.
In this chapter, control systems for a point-to-point VSC-HVDC link were implemented. In addition to its primary function of bulk power transmission, a HVDC link can be used to provide damping of SSR, and this auxiliary function has been designed and simulated. Simulations have been carried out in PSCAD/EMTDC with the results plotted in MATLAB.
3.2
POTENTIAL FOR SSR IN THE 2020 GB NETWORK
The potential for the generation of SSR within thermal generators is recognised by National Grid Ltd as a threat. It is widely known that series compensated AC
36
transmission lines can cause SSR interactions with thermal generators. VSC-HVDC links have been shown not to contribute to SSR, and the flexibility of this converter type means that SSR in the onshore network could be damped. LCC-HVDC links can be a source of SSR, although the control systems are usually designed to avoid this [74], [85].
3.2.1 THE THREE MACHINE NETWORK
A three-machine model, presented in [96–99], was used to represent the mainland GB system. The weighting of the size and type of generation in the GB network is modelled in this simple representation.
The three machine network was originally designed to resemble the operating conditions of the mainland GB system. The model acted as a base for testing wind generator machine types and FACTS devices.
3.2.2 IMPROVEMENTS IN THE THREE MACHINE NETWORK
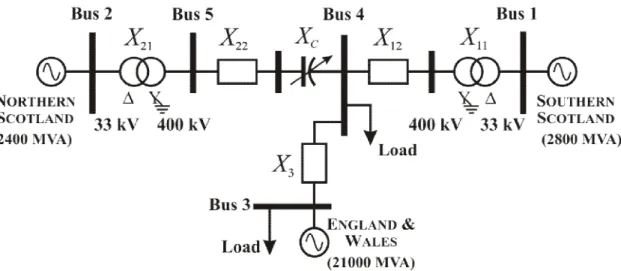
Thesystem shown in Figure 3.1consists ofthreesynchronousgenerators splitting the GB mainland system into three major generation areas: Englandand Wales,Southern Scotland and Northern Scotland. The rating of the England and Wales generator is 21,000 MVA. The Southern Scotland generator is rated at 2,800MVA and the Northern Scotland generator is rated at 2,400 MVA.
37
To assess SSR in this model, a number of adjustments have been made to simulate the planned series compensation within the AC transmission lines. A series capacitor was included between buses 4 and 5 to represent the planned fixed capacitors between England and Scotland, required to increase transient stability. This will bring the transient stability limit up to the thermal capacity of the AC transmission line. The implementation of this series compensation changes the parameters of the electrical system and therefore its natural frequency.
Figure 3.2: Shaft model of the Northern Scotland generator as a six mass system
The Northern Scotland generator shaft is an aggregation of all the thermal turbine generators in the Northern Scotland generation area. This aggregated generation was modelled as a multi-mass system consisting of four turbine sections, plus the generator and exciter, as shown by Figure 3.2. The parameters of the shaft are the same as the ones used in the IEEE First Benchmark Model and can be found in [91] and Appendix A. The system frequency for the three machine network is 50Hz.
The generic network model used reactances and resistances for the transmission lines and transformers, which can be found in [100] and Appendix A. Several approaches can be used to assess the risk of SSR in an AC system. An eigenvalue analysis can be performed, a time domain simulation can be carried out or a unit interaction factor
38
study can be carried out. In this study, an eigenvalue analysis and a time domain study are conducted.
3.3
RESULTS FOR THE 2020 GB NETWORK
To assess the vulnerability of the 2020 GB network to SSR, a time domain simulation of the model in PSCAD/EMTDC in Figure 3.1 was tested. The eigenvalue analysis in [100] was conducted on the same model, so a comparison was drawn between the PSCAD simulation and the eigenvalue analysis.
3.3.1 EIGENVALUE ANALYSIS
The 2020 GB network is characterised by five torsional modes (TM1-TM5), associated with the shaft of the Northern Scotland generator, which may become excited at different compensation values. Figure 3.3 plots the ranges of series compensation levels at which interaction and instability may occur. Where the real part of the eigenvalue is negative, the system is stable. Areas where the real parts of the eigenvalue are positive are considered unstable as the system is susceptible to SSR. The unstable areas occur at series compensation levels where the subsynchronous mode (SUB) is close to a torsional mode. A torsional interaction is likely to occur between the subsynchronous mode (SUB) and the relevant torsional mode (TM1-5) in these areas.
39
Figure 3.3: Stability of the torsional modes in terms of series compensation level and relationship with the subsynchronous mode frequency [100]
For example, Figure 3.3 shows that at 45% compensation, the subsynchronous mode (SUB) is close to torsional mode 4 (TM4), here the real part of the eigenvalue is positive.
Table 3.1 provides a direct comparison between two series compensation levels. At a series compensation level of 30%, all the real part of the eigenvalues are negative. At 40% compensation the real part of the eigenvalue is positive for torsional mode 4 (TM4). This indicates that a torsional interaction is likely to develop at the 40% series compensation level between the subsynchronous mode (SUB) and torsional mode 4
40
(TM4). As the level of series compensation is increased the chance of an interaction increases, it is likely that one of the torsional modes will become unstable.
Table 3.1: Relevant eigenvalues of the three-machine system [100]
30% compensation 40% compensation
Mode of oscillation
Real part [s-1]
Imag. part [rad/s] Real part
[s-1]
Imag. part [rad/s]
TM5 –1.173 ±272.1935 –1.173 ±272.1935 TM4 –0.2078 ±185.4883 +0.0976 ±185.7151 TM3 –0.3839 ±146.6666 –0.3792 ±146.6967 TM2 –0.0587 ±115.9705 –0.0584 ±115.9755 TM1 –0.1492 ±90.5749 –0.1475 ±90.6216 SUPER –8.5183 ±418.5203 –8.6653 ±434.764 SUB –7.4436 ±209.2895 –7.6743 ±192.7548
3.3.2 TIME DOMAIN SIMULATION IN PSCAD
A time domain simulation of the network in Figure 3.1 was implemented on PSCAD/EMTDC. In the simulation, a change in series compensation, from 30% to 40%, occurs at 2 seconds. From the results of the eigenvalue analysis, it would be expected that SSR would develop following the change in series compensation.
Figure 3.4(a) shows the frequency at Bus 5 of the AC transmission network, whereas Figure 3.4(b) illustrates the electromagnetic torque at the Northern Scotland generator. The increasing frequency and torque amplitude after the step change shows that this system becomes unstable due to SSR.
![Figure 1.3: Offshore wind development map [13]](https://thumb-us.123doks.com/thumbv2/123dok_us/10179895.2920386/22.892.280.701.128.703/figure-offshore-wind-development-map.webp)

![Figure 2.11: Operating point for a two terminal system using the voltage margin method [57]](https://thumb-us.123doks.com/thumbv2/123dok_us/10179895.2920386/41.892.237.718.414.678/figure-operating-point-terminal-using-voltage-margin-method.webp)
![Figure 2.12: Operating point for a three terminal system using droop control [59]](https://thumb-us.123doks.com/thumbv2/123dok_us/10179895.2920386/42.892.172.797.131.307/figure-operating-point-terminal-using-droop-control.webp)
![Figure 2.15: National grid FRT requirement for the Supergrid [65]](https://thumb-us.123doks.com/thumbv2/123dok_us/10179895.2920386/44.892.244.735.142.435/figure-national-grid-frt-requirement-supergrid.webp)