This is the author manuscript accepted for publication and has undergone full peer review but has not been through the copyediting, typesetting, pagination and proofreading process, which may lead to differences between this version and the Version of Record. Please cite this article as doi:
10.1111/jiec.12664.
This article is protected by copyright. All rights reserved.
Note on the Rate and Energy Efficiency Limits for Additive Manufacturing.
Timothy Gutowski1, Sheng Jiang1, Daniel Cooper2, Gero Corman3, Michael Hausman4, Jan-Anders Manson4, Timo Schudeleit5, Konrad Wegener5, Matias Sabelle6, Jorge
Ramos-Grez6, Dusan P. Sekulic7,8
1Massachusetts Institute of Technology, Cambridge Massachusetts, USA.
2University of Michigan,Ann Arbor, Michigan, USA.
3Rheinisch Westfalische Technische Hochschule Aachen, Aachen,
Nordrhein-Westfalen, Germany.
4Ecole Polytechnique Federale de Lausanne, Lausanne, Switzerland.
5Eidgenossische Technische Hochschule Zurich, Zurich, Switzerland.
6Pontifica Universidad Católica de Chile, Santiago, Chile. 7University of Kentucky, Lexington, Kentucky, USA.
8Harbin Institute of Technology, Heilongjiang Sheng, China.
Address Correspondence to:
Timothy Gutowski,
Massachusetts Institute of Technology, Department of Mechanical Engineering, Room 35-234 77 Massachusetts Avenue, Cambridge, Massachusetts 02139 USA
[running head: RESEARCH AND ANALYSIS]
[running foot: Gutowski et. al., Rate and Energy Efficiency Limits for AM]
This article is protected by copyright. All rights reserved.
2
Email: [email protected]
Abstract
We review the process rates and energy intensities of various additive processing technologies and focus on recent progress in improving these metrics for laser powder bed fusion (PBF) processing of metals, and filament and pellet extrusion processing of polymers and composites. Over the last decade, observed progress in raw build rates has been quite substantial, with laser metal processes improving by about one order of magnitude, and polymer extrusion processes by more than two orders of magnitude.
We develop simple heat transfer models that explain these improvements, point to other possible strategies for improvement, and highlight rate limits. We observe a pattern in laser metal technologies that mimics the development of machine tools; an efficiency plateau, where faster rates require more power with no change in energy nor rate efficiency.
Keywords: 3D printing, additive manufacturing, energy efficiency, industrial ecology, manufacturing, production rate
Conflict of interest statement: The authors have no conflict to declare.
Introduction
A wide range of new additive technologies, sometimes called 3-D printing, or more recently additive manufacturing (AM), is having a profound effect on how we make things. The technology can make solid objects directly from a computer description of the part. This eliminates many manual steps in conventional part making, and can produce complex geometries that are often very difficult, if not impossible to make
[running head: RESEARCH AND ANALYSIS]
[running foot: Gutowski et. al., Rate and Energy Efficiency Limits for AM]
This article is protected by copyright. All rights reserved.
3
by conventional techniques. These attributes have led to considerable success in the areas of rapid prototyping and tool making.
The main competitive advantages of this technology are: 1) an enormous range of shape complexity, 2) rapid delivery of one-off parts, 3) and deskilling of some of the manufacturing steps. These advantages have led to considerable enthusiasm for this technology, accompanied by significant investments and rapid technology
development. But along with these encouraging signs has come speculation about future benefits that are less certain. Many of these technologies still have well known challenges. These include; 1) slow process rate, 2) poor surface finish and material and dimensional tolerances, and 3) expensive equipment. Other issues that are often mentioned, but are likely to improve over time, are high material costs, and limited material choices as well as process stability and automation. The issues of post-processing, and powder management and reuse have received only limited attention and need more discussion. These topics are particularly important for BAAM (a pellet extrusion type technology for polymers that will be discussed later) that needs
significant post-processing and for reactive powders such as titanium and aluminum, and for non-processed but temperature exposed polymer powders.
In this article, we focus on process rates for two popular melt processing technologies; laser melting (PBF) for metals, and filament and pellet extrusion of polymers and composites, and the companion issue of energy usage. This paper builds upon the work of others who have carefully measured, analyzed and documented the energy use and time requirements for a variety of AM technologies. These include in
particular, Baumers et al. 2010, 2011a, 2011b, 2012, 2016, Faludi et al. 2017, Kellens et al. 2011, 2014, 2017, Kruth 2005, 2010, Scheifenbaum et al. 2011, and Buchbinder et al. 2011, and their co-workers, as well as many others listed in our references.
We differentiate between different time and rate measures as follows: 1) the build time is the total time to produce a raw part without post processing. This would include such steps as heating up and cooling down the machine, and printing the part and is discussed in more detail later. 2) the process time (or print time) represents the core process step of adding material to a solid object. If the process is run
[running head: RESEARCH AND ANALYSIS]
[running foot: Gutowski et. al., Rate and Energy Efficiency Limits for AM]
This article is protected by copyright. All rights reserved.
4
efficiently the process time would constitute 90% or more of the build time [Faludi 2917, Kellens 2011]. 3) and finally, the manufacturing time would be the total time to produce a part including the build time and the post-processing time.
Additive technologies can make one, or a few parts in a very short elapsed time by avoiding tool making which can take weeks or months. But if the part can be made by conventional methods, and if large production volumes are needed, then the additive methods cannot compete because they are too slow. The slowness of these processes is related to a fundamental tension between two basic goals: 1) fine features and 2) fast print rate. So far, solutions have favored making small (but not fine) features, at tolerable, but decidedly slow print rates. A consequence of this selection is long print times.
We argue that the current most commonly employed solution: (small features with slow print rates) is fundamentally limited by the details of the heat transfer phenomena that control the melt delivery rate. It appears to us that currently the laser melting technologies, particularly for aluminum alloys, are stalled in the sense that recent rate improvements have not improved energy efficiency, while the polymer extrusion processes recently had a big breakthrough by abandoning small features and living with significant post processing, but increasing the build rate by more than two orders of magnitude, while decreasing the energy intensity (not counting post-processing) by almost two orders of magnitude.
The currently slow rates of material processing may be the single most important barrier for the future development of this technology and a dominant feature in the energy usage of this technology.
Overview of Process Rates and Energy Requirements for Manufacturing Equipment
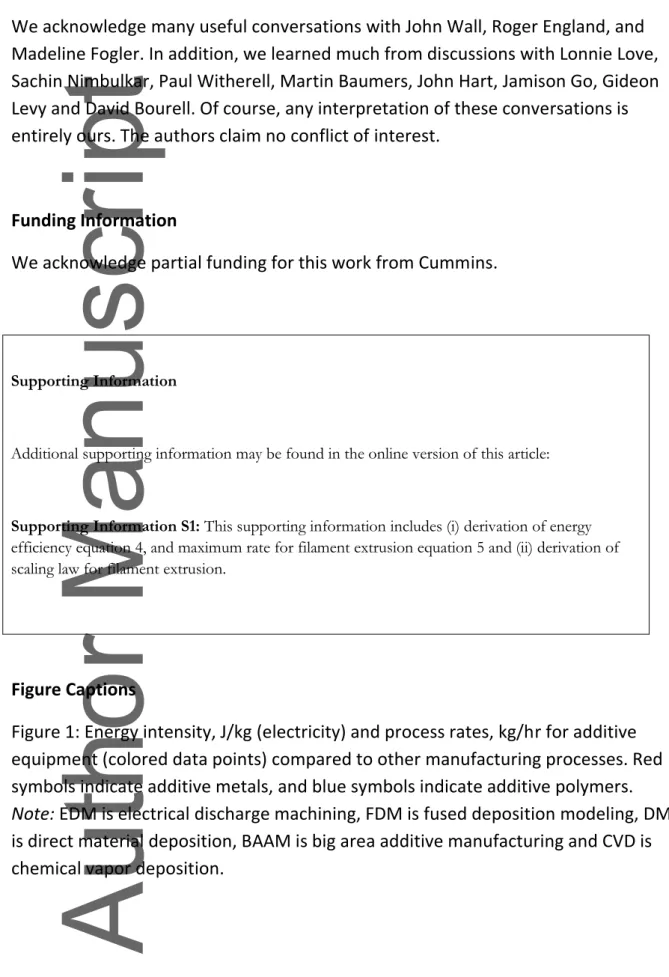
In earlier work [Gutowski 2009, 2011], we have identified a pattern in energy use and process rate that almost all manufacturing process equipment follows. The pattern is seen in Figure 1 that plots the average electrical energy used per kg of material processed (J/kg) Vs the process rate (kg/hr). The concept behind this plot is relatively simple; most manufacturing process equipment operates within a rather narrow power band, typically between 5 kW and 50 kW, even though their process rates and energy intensities can vary by eight or more orders of magnitude. Furthermore,
[running head: RESEARCH AND ANALYSIS]
[running foot: Gutowski et. al., Rate and Energy Efficiency Limits for AM]
This article is protected by copyright. All rights reserved.
5
these power requirements can be broken down between constant and variable power components. Processes dominated by constant power requirements tend to fall along the diagonal lines in figure 1. While processes dominated by variable power, i.e. with energy requirements that scale with the quantity of material being processed, rather than with the processing time, tend to fall between the two horizontal lines. The lower horizontal line at 1 MJ/kg corresponds roughly with the minimum energy needed to melt 1 kg of iron or aluminum. While the upper
horizontal line corresponds to 10 MJ/kg or roughly the minimum energy required to vaporize 1 kg of aluminum. We've added a third diagonal line at 500 W to this diagram because AM processes as a whole, tend to have lower power requirements compared to most conventional manufacturing processes. We use the plot here to position additive technologies relative to conventional processes. Metal additive processes are shown in red, and polymers in blue. Conventional manufacturing processes such as machining, injection molding and the melting step for casting processes lie to the bottom-right of the additive technologies.
The first thing to note, is that there is quite a range of process types and values for additive processes on the plot. Nevertheless, certain generalizations can be observed. For example, as a group, the additive processes have both smaller process rates (kg/hr) and higher specific energy use, considered as energy intensities (J/kg), than most of the conventional processes. Note that the energy values given in Figure 1 are in terms of electricity requirements, [J/kg]. At the same time however, there are many other processes that are widely used that have still smaller process rates and larger energy intensities compared to the additive processes. These would include processes used in the semiconductor industry and advanced machining techniques where relatively small quantities of materials are processed.
There are many small additive machines (mostly filament extrusion polymer based) that operate at relatively low power compared to most of the other processes in the figure. These enter the category of so called “desktop” machines, some as low as 50W, and would probably not be involved in actual manufacturing.
[running head: RESEARCH AND ANALYSIS]
[running foot: Gutowski et. al., Rate and Energy Efficiency Limits for AM]
This article is protected by copyright. All rights reserved.
6
Note that, the main cluster of points for the additive processes is about three orders of magnitude smaller in process rate, than conventional processes (10-1 kg/hr Vs 102 kg/hr) and about one order of magnitude lower in power requirements, resulting in an electrical energy intensity that is about one to two orders of magnitude higher than conventional manufacturing processes (100s MJ/kg Vs 1-10 MJ/kg)1. When doing a lifecycle assessment of these processes, this puts the energy intensity of the additive processes in the same league as the energy embodied in the materials used, something that is not true for conventional processes. This is not to say that there aren't cases where additive processes would require less energy. This could occur for small part volumes that avoid tooling, particularly when compared to conventional applications with very high “buy to fly” material ratios [Huang 2015, Walachowicz 2017 this issue]. These cases are the “sweet spot” for additive technologies, but this sweet spot may remain relatively small compared to the vast array of manufactured parts as long as these low processing rates continue to exist. The consequences of small process rates show up in still other ways that can affect the competitiveness of these
technologies. Small process rates mean that attended processes can run up significant labor costs, and that equipment amortization will be over many fewer parts. This can make equipment costs and equipment embodied energy a significant part of the per-part calculation [see Faludi 2017 this issue].
Perhaps the most notable feature for AM technologies in figure 1 however, is a process labeled BAAM at 4x10⁶ J/kg and 10 kg/hr. BAAM stands for Big Area Additive Manufacturing, a new pellet extrusion process. This process which is noticeably much faster and less energy intense than the other additive processes, was developed as a collaboration between Oak Ridge National Laboratories and Cincinnati Incorporated and will be discussed later.
Rate Improvements and Limitations
The time steps to make an additive part (after some additional CAD processing) involve the following: 1) machine set up, 2) machine heat up, 3) printing (which
1
Kellens et al [2017] report a range of measured electrical energy values for various commercial additive technologies ranging from 51 to 1247 MJ/kg with many of the same references that we use here.
[running head: RESEARCH AND ANALYSIS]
[running foot: Gutowski et. al., Rate and Energy Efficiency Limits for AM]
This article is protected by copyright. All rights reserved.
7
involves laser scanning/melting for laser PBF processes, or filament or pellet melting and deposition for extrusion processes, 4) powder recoating for powder processes, 5) cool down, 6) part removal and 7) post-processing (typically involving machining and finishing processes). The individual time contribution from each step depends very strongly on how the machine is scheduled. If only a small section of the machine bed is used, the “once per run” steps 1, 2, 5, 6, and 7, and the “once per layer” step 4 can account for a significant proportion of the total run time. But as the machine bed is filled for large runs these steps diminish in importance and actual printing (step 3) dominates, accounting for more than 90% of the run time. Hence, the difference in time per part between occasionally making one part, to constantly printing a full bed of parts can be almost a factor of 10 [Baumers 2010, Faludi 2017]. So, as we consider the potential transition of 3-D printing from prototyping, to additive manufacturing, we assume that many parts will need to be made. In this case, the most dominant time step will be the printing step involving laser heating for metal powder bed processes or filament or pellet heating for extrusion processes, as confirmed by several papers in this special issue [Faludi 2017, Kellens 2017].
Laser Melting
A fundamental limitation to high production rates in these processes is related to management of the heat transfer mechanisms needed to deliver the melt stream to build a part. For a large group of AM technologies, melting is driven by a laser beam scanned across the powder bed surface. The objective is to raise the temperature of the powder bed layer in order to melt and solidify an eventual solid ribbon of
material.
The heat must be applied in a way that does not vaporize sizably the surface (leading to significant material loss, especially for metals), nor damage the surface (polymers) while at the same time bringing sufficient thermal energy for melting and heat
transfer for propagating to the bottom of the layer so it bonds firmly to the sub-layer. The processing parameters are designed such that these conditions can be obtained on a repetitive basis. In practice, the thermal gradient across the layer is managed in metals by initial surface melting followed by rapid capillary advance into
[running head: RESEARCH AND ANALYSIS]
[running foot: Gutowski et. al., Rate and Energy Efficiency Limits for AM]
This article is protected by copyright. All rights reserved.
8
the material and in polymers (which are very poor thermal conductors) by raising the powder bed to a very high temperature, in fact not far below the melt temperature, so that only a small additional increment of heat is required for the subsequent aggregate state (phase) change. Hence, the process is designed such that a new layer is heated rapidly with a constrained temperature gradient across the thickness.
With this process approach in mind, one can estimate the fastest possible delivery rate based upon the ideal assumption that the delivered energy is fully utilized to raise the temperature and melt the ribbon of material. We call this the adiabatic print rate, it comes directly from the conservation of energy principle established by the application of the first law of thermodynamics and conservation of mass. The result, given below, for laser melting suggests methods to increase the print rate, and provides a standard of comparison for observing energy efficiency
improvements. In practice, other mechanisms could interfere with this ideal rate, such as poor heat transfer, degradation, instabilities and heat loss to the
surroundings, but in practice process parameters are adjusted to avoid or at least minimize these interfering phenomena. And at the same time, the adiabatic rate will provide a useful standard to analyze the progress of energy delivery systems for AM.
̇
(1)
Note that Eq. (1) assumes that the solid state material is heated up to the melting point, and subsequently melted only by the absorbed laser delivered heat input, with no heat transfer losses to the surroundings.
[running head: RESEARCH AND ANALYSIS]
[running foot: Gutowski et. al., Rate and Energy Efficiency Limits for AM]
This article is protected by copyright. All rights reserved.
9
Where ̇ = the adiabatic mass process rate (kg/s)
= laser/material absorption coefficient ( P = laser power (W)
c = average specific heat (J/(kg K))
T = Tmelt - Tstart (K)
= enthalpy of melting (J/kg)
We define the adiabatic efficiency as the mass rate ratio (or sometimes as the volume rate ratio, assuming constant density, to conform with commonly reported results in the literature), for example,
̇ ̇
(2)
Observed Laser-Metal Process Rates
Four strategies have been used in recent years to increase the production rate of laser PBF technologies: higher powered lasers, multiple lasers, heated chamber, and optimized process settings. The success of these strategies will be revealed in the data presented in this section, but in summary, over the last decade, steel powder laser PBF print rates have increased by more than an order of magnitude, (20x), while over a shorter time, aluminum print rates have increased eight-fold. Both improvements are due largely to the use of higher powered lasers, but the other strategies, as listed above, were also employed.
[running head: RESEARCH AND ANALYSIS]
[running foot: Gutowski et. al., Rate and Energy Efficiency Limits for AM]
This article is protected by copyright. All rights reserved.
10
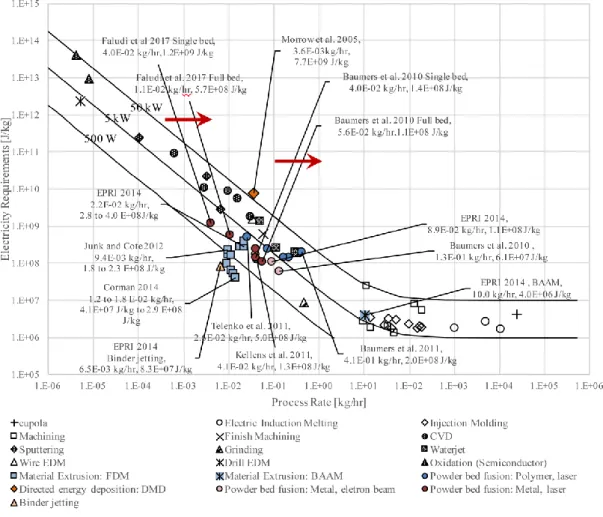
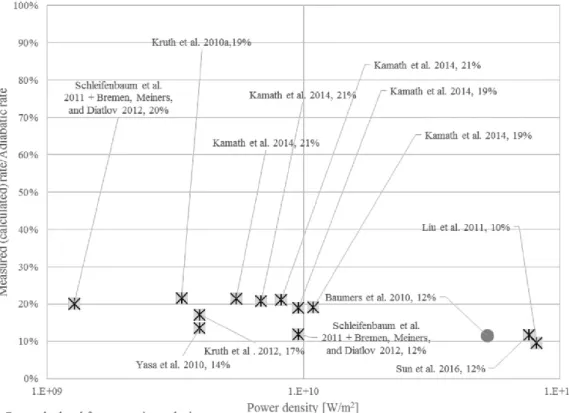
At the same time, using estimates for the physical parameters in equation 1 we noticed that the adiabatic efficiencies of these newer processes have stayed remarkably consistent. The adiabatic efficiency is plotted against laser power
intensity (W/m2) for steel powders in figure 2 and against the laser power (W) for the aluminum alloy AlSi10Mg in figure 3. The results show a striking consistency, with steel powder data showing adiabatic rate efficiencies on the order of 20% for power intensities below about 1010W/m2, and about 13% for higher power intensities up to 1011 W/m2. The aluminum powder data is even more consistent, with an adiabatic rate efficiency around 5% for the entire range from 200 W to 1600 W. The nominal values used to calculate the adiabatic rates for steel and aluminum are given in table 1, while the data for the actual scan rates are given in tables 2, and 3. The rather low adiabatic efficiencies indicated in figures 1 and 2 are due largely to heat loss to the surroundings, with the much more conductive aluminum powder giving the lowest values.
Keep in mind, that the delivered laser power in watts is only a small fraction of the primary power requirements to do the melting. For a larger boundaries perspective, the overall power requirements just to melt the powder would need to include: losses in the laser resonator: due to quantum efficiency being less than 100%, active medium small signal gain saturation, losses due to mirror absorptivity at the
wavelength being emitted, output coupling mirror intermediate reflectivity and resonator cavity materials absorptivity (Anderson 1976, Steen 2010, Kannatey-Asibu 2009, and the requirement for a chiller, and losses in the electric grid.
In fact, the overall inefficiency of the laser melting process can be demonstrated by comparing the energy required to laser melt material versus the energy needed to sand or die cast an equivalent amount of material. The example aluminum part presented by Faludi 2017 [this issue] made on a Renishaw AM 250 with a 200W fiber laser required 352 MJelect/kg for full bed printing, or 1.06 GJ/kg primary energy
[running head: RESEARCH AND ANALYSIS]
[running foot: Gutowski et. al., Rate and Energy Efficiency Limits for AM]
This article is protected by copyright. All rights reserved.
11
generally in the range of 10 to 20 MJ/kg [Dalquist 2004a, 2004b]. The minimum energy required to melt aluminum from room temperature to the melt temperature is about 1.4 MJ/kg and will vary slightly from this value depending upon alloy
content.
At the same time, what should be noted, is that even with significant rate
improvements, the adiabatic rate efficiency has hardly changed. And that this implies that the energy efficiency for these processes has plateaued. An energy efficiency,
energy, can be estimated by taking the ratio of the minimum energy input required to
melt the part, to an approximation for both the laser energy requirements and the part/chamber preheating using approximate estimates for efficiencies of the sub
processes including, which is optimized by matching the laser wavelength with the absorptivity spectrum for the material, assumed to be in the vicinity of 0.6 in our calculations, adiabatic, as
previously defined and observed to be in the range of 1/20 to 1/5 depending upon the powder; grid, for the efficiency of the electric grid, we assume 1/3; laser, as the
efficiency of the laser, we assume between 1/5 to ½; and heating, as the efficiency of
the heated chamber we assume between ½ and 3/4. The derivation, given in the supporting information available on the Journal’s website, yields the following approximation for laser melting of metal powders,
(3)
This result shows the important connection between the adiabatic rate efficiency and the energy efficiency of the thermal energy delivery system, and only applies when laser heating dominates over chamber heating as it usually does for the laser melting of metal powders. Hence, a constant absorptivity and adiabatic efficiency with no change in the laser or grid efficiency will result in a constant energy efficiency. In other words, one might be able to increase the print speed with increased laser power, or increased chamber heating for that matter, but these strategies will have to pay the price for increased speed, with additional power requirements. This is very similar to the historical development of cutting machine tools. They increased dramatically in
[running head: RESEARCH AND ANALYSIS]
[running foot: Gutowski et. al., Rate and Energy Efficiency Limits for AM]
This article is protected by copyright. All rights reserved.
12
cutting speed, by about two orders of magnitude over 100 years, due in large part to the development of new harder and tougher cutting tools [Kalpakjian & Schmid 2014]. However, to take advantage of these new tools, the spindle power was also increased. The end result in this case, was that the spindle specific energy
requirement converged to a value proportional to the hardness (or ~ 3 X material yield value) of the material being cut, due to the plastic work required. Inefficiency in cutting (due to friction at the tool work piece interface) further doubled this value [Cook 1955, Gutowski & Sekulic 2011]. In the case for laser additive processing, the factor is not 2 but 5 to 20, and it appears to have plateaued.
We have further studied the adiabatic rate experimentally, by scanning various metal powders at different rates and with different patterns and have found that in certain circumstances one can obtain an adiabatic rate efficiency as high as 40%, but with diminished material quality. We note that these results are very similar to the results of others who have explored the parameter space of scan rate Vs laser power to
identify rate limits for laser AM technologies [Kruth et al. 2014, Laohaprapanon 2012, Yadroitsev et al. 2010]. It is important to keep in mind that any claim on still higher scan rates would need to ensure that the settings are robust to quality variation. It is reasonable to assume that equipment manufacturers are working at this problem every day.
In spite of these apparent efficiency limits, additive processes can compete with other conventional processes on an energy basis due to other areas of potential efficiency improvements (for example due to observed low “buy to fly” material values, or fast turnaround times that avoid tooling for small numbers of parts). But so far, these apparent “sweet spots” represent only a small fraction of the totality of manufacturing applications.
Table 1 Parameter values for steel and aluminum powders used to calculate adiabatic print rates.
[running head: RESEARCH AND ANALYSIS]
[running foot: Gutowski et. al., Rate and Energy Efficiency Limits for AM]
This article is protected by copyright. All rights reserved.
13
Table 2 Measured print rates for steel powders with references
Machine Laser Materia l P (W) Laser spot diamete r (mm) Power density (W/m2) Measure d rate (cm3/ hr) Rate efficienc y ratio Density Ratio (vs bulk material ) Reference Functional Parts (calculatio n includes recoating time) AM 250 Yb fiber laser SAE 316L 200 0.07 5.2E+1 0 7.0 12% N\A Baumers et al. 2010 Trumph (not specified) not
specified SS 316 200 N/A N/A 5.0 9% 98.7%
Kruth et al. 2005 MCP-HEK (not specified) not
specified SS 316 100 N/A N/A 2.6 9% 99.1%
Kruth et al. 2005 Pillars, cubes, specimen (data chosen to Modifed Trumafor m LF250 Yb and fiber Steel 1.2343, 1.2709, 1.4404 100 0 1.00 1.3E+0 9 60.5 21% > 99% Schleifenbau m et al. 2011 and Bremen, Meiners, and Diatlov 2012
Material Steel 316L AlSi10Mg
Parameter Value Reference Value Reference
Density [kg/m3] 7970 IAEA 2009 2670 EOS material sheet Heat capacity [J/(kg-C] 510 IAEA 2009 963 Touloukian et al. 1970 Melting temperature [C] 1430 IAEA 2009 613 Touloukian et al. 1970 Plate temperature [C] 100 - 300Baumers et al. 2010 100 - 300Baumers et al. 2010 Latent heat [J/kg] 273,000 AZO materials data sheet389,000 Touloukian et al. 1970 Laser/ material absorptivity 0.64 Tolonko et al. 2000 0.62 Gestel 2015
[running head: RESEARCH AND ANALYSIS]
[running foot: Gutowski et. al., Rate and Energy Efficiency Limits for AM]
This article is protected by copyright. All rights reserved.
14 ensure >99% printed density, calculation includes hatching distance, powder depth and scanning velocity) Concept Laser M2 Yb fiber laser SS 316L 250 - 400 0.22 6.8E+0 9 - 1.1 E+10 12.9 - 23.0 19 - 23% 99.13 - 99.41% Kamath et al. 2014 SLM 250 HL Yb fiber laser SS 316L 380 0.08 7.6E+1 0 13.5 12% 99.1 - 99.2% Sun et al. 2016 Modifed Trumafor m LF250 Yb and fiber Steel 1.2343, 1.2709, 1.4404 300 0.20 9.5E+0 9 10.8 13% > 99% Schleifenbau m et al. 2011 and Bremen, Meiners, and Diatlov 2012 Concept Laser M3 Not mentioned , fiber laser from specs SS 316L 105 0.20 3.3E+0 9 6.8 23% 98% Kruth et al. 2010a Concept Laser M3 Nd-YAG, fiber laser SS 316L 100 0.18 3.9E+0 9 5.2 18% 98.80% Kruth et al . 2012 Customed SLM machine Nd YAG SS 316L 100 0.18 3.9E+0 9 4.1 14% > 99% Yasa et al. 2010 SLM-Realizer 100 Yb fiber laser SS 316L 50 0.0 8.1E+1 0 1.4 - 2.9 10 - 19% 99.45 - 99.93% Liu et al. 2011
Table 3 Measured print rates for aluminum powders with references
Machine Laser Material P
(W) Measured rate (ccm/ hr) Rate efficiency ratio Density Ratio (vs bulk material) Reference
SLM 500 HL YLR fiber laser AlSi10Mg 1600 60.0 3.6% N/A Wiesner et al. 2014
Modified SLM machine
Customized
fiber laser AlSi10Mg
300 14.4 4.6% 95.3% - 99.8%
Buchbinder et al. 2011 500 32.4 6.2% 95.3% - 99.8%
[running head: RESEARCH AND ANALYSIS]
[running foot: Gutowski et. al., Rate and Energy Efficiency Limits for AM]
This article is protected by copyright. All rights reserved.
15 1000 57.6 5.5% ~99.5%
Concept
Laser M1 Fiber laser AlSi10Mg 200 14.8 7.0% 98.5% - 99.8%
Kempen et al. 2012
Observations on Filament and Pellet Extrusion Processes
Earlier in this paper, the significant improvement in print rate and reduction in energy intensity of the BAAM technology, a pellet extrusion technology, was pointed out. Prior to this breakthrough however, the print rate of the filament extrusion process had not changed much in spite of many different varieties of machines available. This is shown in figure 1. For example, (Corman 2014) shows
measurements of four different filament extrusion systems of significantly different power (70W to 1.4kW) and size which indicate almost no change in process rate. All of them used similar filament systems and made parts at the rate of about 10-20 grams/hr. Furthermore, since the bigger machines used more power (due to the bigger heated print chambers) they actually had higher energy intensity values compared to the smaller machines i.e. 100’s of MJ/kg Vs 10’s MJ/kg. These results essentially agree with the other data points provided by (EPRI 2014, and Junk and Cote 2012). The lower range of energy use by this technology is quite competitive with injection molding, but the print rates are not. The print rates of 10 to 20 grams/hr are roughly 3 to 4 orders of magnitude smaller than injection molding. Unless this rate is improved, it will not be competitive for the vast majority of injection molded parts. Again, a limiting print rate for these machines can be
demonstrated by a relatively simple heat transfer model to give insight into how to improve the deposition rate for this process.
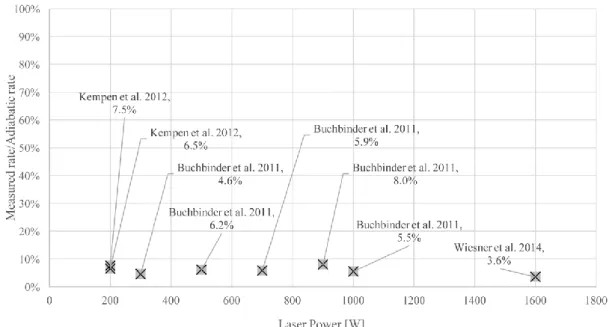
Filament extrusion technology works like a glue gun. A solid polymer filament of diameter D (typically 1 – 2 mm), enters a heated die of length L (~ 20mm), is heated by conduction from the heated wall, and then exits the die at a smaller diameter d when it is printed. Roughly, d D/10. This is shown schematically in Figure 4. Using a
[running head: RESEARCH AND ANALYSIS]
[running foot: Gutowski et. al., Rate and Energy Efficiency Limits for AM]
This article is protected by copyright. All rights reserved.
16
simple approximation as shown in the supporting information on the Web, one can estimate the maximum print rate to be,
̇ (4)
In equation 4, k is the thermal conductivity of the polymer filament, and c is the average specific heat. The basic assumption behind equation 4 is that the polymer filament of length L must obtain a sufficiently high temperature by conduction from the heated walls, before it can be advanced and fused to the adjacent layers. A more detailed model for this process is given in (Sheng 2017). This result suggests that the print rate for filament extrusion can be limited by heat transfer2. The thermal
conductivity of polymers is well known to be small, and so it can dominate many rate phenomena during processing. For example, the cooling rate, and hence the cycle time, for injection molding is generally controlled by heat conduction through the polymer.
Interestingly, to a first approximation, the filament diameter drops out of the mass process rate estimate in equation 4. Hence, printing thicker filaments will not increase the mass printing rate because you are proportionally slowed by thermal diffusion. However, a longer heating zone L (and therefore more cumbersome print head), and more conductive polymer (perhaps filled with a conductive filler like
2
Note that a major difference between laser processes and extrusion processes is that fast and complex pattern scanning with lasers is possible due to the use of galvanometers, while fast scanning of extruders is impeded by the inertia of the mechanical positioning mechanism. The result is that part complexity has almost no effect on the process rate for laser processes, but can noticeably slow down extrusion processes for complex shapes. See (Baumers 2016, and Go 2017).
[running head: RESEARCH AND ANALYSIS]
[running foot: Gutowski et. al., Rate and Energy Efficiency Limits for AM]
This article is protected by copyright. All rights reserved.
17
carbon fibers) would help. Also, important would be to decouple the thermal diffusion scale length from the print ribbon length scale. This is something that the single barrel melt extruder does for the new pellet extrusion technology called, BAAM. In fact, BAAM does all three of these when compared to FDM; it employs a longer heating zone, a more conductive material, and viscous heating - a bulk heating mechanism.
The BAAM technology abandoned the filament approach, and replaced the print head with a conventional single barrel melt extruder. Such a machine is feed using (less expensive) pellets, is more than an order of magnitude longer than the
conventional filament extrusion print head (L in equation 4) and employs a much more favorable melting geometry compared to the filament approach [Tadmore and Gogos 1980]. Sheng (2017) has performed a detailed analysis of this process which indicates the use of viscous heating, as well as heat transfer from the barrel wall, greatly enhances the melting process. All of these factors contributed to the very significant increase in process rate and reduction in energy intensity in spite of using higher power compared to conventional filament extrusion technologies. At the same time, while the longer extruder helps to increase the rate, it also makes the print head much bulkier, limiting feature detail, and of course the output is much coarser (with surface features on the order of 1 cm), leading to a much poorer surface finish and very significant post processing. That is, while the details have not yet been shared, it seems apparent that these large parts after being printed, are likely loaded into a large machine tool, probably five axis, and machined to get the fine surface finish often displayed on the final parts. Other possible required steps could be heat treatment, and hand surface finishing, but as far as we know, the details for the required post processing have not yet been revealed.
Nevertheless, the new pellet extrusion technology both increases the process rate, by more than 2 orders of magnitude, and decreases the electricity requirement per kg by about two orders of magnitude when compared to the filament extrusion technology. Hence, in terms of the two parameters this paper is focused on: process rate and energy intensity, the BAAM technology is a clear breakthrough,
[running head: RESEARCH AND ANALYSIS]
[running foot: Gutowski et. al., Rate and Energy Efficiency Limits for AM]
This article is protected by copyright. All rights reserved.
18
demonstrating new thinking and creative use of existing technology. At the same time there is more to learn about this technology, and we look forward to more detailed reports concerning the stability and strength of the printed structures, and the extent of post processing required.
Conclusions
Additive technologies have revolutionized how we can make physical objects. They have shown steady progress as they have transitioned from physical object
prototyping, to functional prototyping, to one-off parts and to tooling inserts. Currently they are being considered for parts that channel gases and liquids through complex flow paths in high temperature environments. Applications include
aerospace and engine parts like fuel mixing heads and diffusion burners, and tooling applications such as injection molding dies. In these applications, additive
technologies can replace complex operations, machining hard materials often with high “buy to fly” ratios. These applications seem very attractive for additive
processes and have a very real chance to make better performing parts, in less time and using less material and energy. We expect this trend to continue with still more new application.
Nevertheless, in spite of these successes, additive technologies have very real limits to their performance and without additional innovation and development will not come close to many of the premature announcements concerning their future possibilities. In this paper, we focus on one of the major barriers in the way of the transition from prototyping to manufacturing; the very slow print rate. This obstacle alone could eliminate AM from serious consideration for most parts that are
manufactured today. At the same time, this challenge is known in the industry and many capable engineers and scientists are looking hard to cross this barrier. We hope that this paper will bring attention to these challenges.
[running head: RESEARCH AND ANALYSIS]
[running foot: Gutowski et. al., Rate and Energy Efficiency Limits for AM]
This article is protected by copyright. All rights reserved.
19
We acknowledge many useful conversations with John Wall, Roger England, and Madeline Fogler. In addition, we learned much from discussions with Lonnie Love, Sachin Nimbulkar, Paul Witherell, Martin Baumers, John Hart, Jamison Go, Gideon Levy and David Bourell. Of course, any interpretation of these conversations is entirely ours. The authors claim no conflict of interest.
Funding Information
We acknowledge partial funding for this work from Cummins.
Supporting Information
Additional supporting information may be found in the online version of this article:
Supporting Information S1: This supporting information includes (i) derivation of energy efficiency equation 4, and maximum rate for filament extrusion equation 5 and (ii) derivation of scaling law for filament extrusion.
Figure Captions
Figure 1: Energy intensity, J/kg (electricity) and process rates, kg/hr for additive equipment (colored data points) compared to other manufacturing processes. Red symbols indicate additive metals, and blue symbols indicate additive polymers.
Note: EDM is electrical discharge machining, FDM is fused deposition modeling, DMD
is direct material deposition, BAAM is big area additive manufacturing and CVD is chemical vapor deposition.
[running head: RESEARCH AND ANALYSIS]
[running foot: Gutowski et. al., Rate and Energy Efficiency Limits for AM]
This article is protected by copyright. All rights reserved.
20
Figure 2: Measured rate/adiabatic rate (adiabatic efficiency) Vs laser power intensity (W/m2) for steel powders for different additive equipment using larger lasers and defocusing.
[running head: RESEARCH AND ANALYSIS]
[running foot: Gutowski et. al., Rate and Energy Efficiency Limits for AM]
This article is protected by copyright. All rights reserved.
21
Figure 3: Measured rate/adiabatic rate (adiabatic efficiency) Vs laser power (W) for aluminum powders for different additive equipment using higher powered lasers. See Table 2.
[running head: RESEARCH AND ANALYSIS]
[running foot: Gutowski et. al., Rate and Energy Efficiency Limits for AM]
This article is protected by copyright. All rights reserved.
22
Figure 4: Heating zone for the plastics extrusion process (sometimes called fused deposition modeling – FDM). The cylindrical filament enters as a solid with diameter D on the left, is heated by conduction from the wall in a zone of length L and exits as a molten polymer of diameter d and velocity v on the right.
References
Anderson Jr., J.D. 1976, Gasdynamic lasers: An introduction. Quantum Electronics Series, Principles and Applications, Academics Press.
[running head: RESEARCH AND ANALYSIS]
[running foot: Gutowski et. al., Rate and Energy Efficiency Limits for AM]
This article is protected by copyright. All rights reserved.
23 Apinya, L., P. Jeamwattanachai, M. Wongcumchang, N. Chantarapanich, S. Chantaweroad, K. Sitthiseripratip, and S. Wisutmethangoon. 2012. Optimal Scanning Condition of Selective Laser Melting Processing with Stainless Steel 316L Powder. Advanced Materials Research, Vols. 341-342: 816-820.
Baumers, M., C. Tuck, R. Hague, I. Ashcroft, and R. Wildman, “A comparative study of metallic additive manufacturing power consumption,” in Solid freeform fabrication symposium, 2010, pp. 278–288.
Baumers, M., C. Tuck, D.L. Bourell, R. Sreenivasan, and R. Hague. 2011a. Sustainability of additive manufacturing measuring the energy consumption of the laser sintering process. In Proceedings of the Institution of Mechanical Engineers, Part B: Journal of Engineering Manufacture. Vol. 225(12): 2228-2239.
Baumers, M., C. Tuck, R. Wildman, I Ashcroft and R. Hague. 2011b. Energy inputs to additive manufacturing. Does capacity utilization matter? In Proceedings of the Solid Freeform Fabrication (SFF) Symposium, University of Texas at Austin.
Baumers, M., C. Tuck, R. Wildman, I. Ashcroft, E. Rosamond, and R. Hague. 2012. Combined build-time, energy consumption and cost estimation for direct metal laser sintering. In Solid Freeform Fabrication Symposium, pp. 932-944.
Baumers, M., C. Tuck, R. Wildman, I. Ashcroft, and R. Hague. 2016. Shape complexity and process energy consumption in electron-beam melting, Journal of Industrial Ecology, DOI:10.1111/jiec.12397
Breman, S., W. Meiners and A. Diatlov, 2012. Selective Laser Melting – A manufacturing technology for the future? Rapid Manufacuring. www.laser-journal.de
Buchbinder D., H. Schleifenbaum, S. Heidrich, W. Meiners, and J. Bultmann, 2011. High Power Selective Laser Melting (HP SLM) of Aluminum Parts. Phys. Procedia, Vol. 12, Part A, : 271-278.
[running head: RESEARCH AND ANALYSIS]
[running foot: Gutowski et. al., Rate and Energy Efficiency Limits for AM]
This article is protected by copyright. All rights reserved.
24 Corman, J.C. 2014. Energy and Resource Efficiency of Additive Manufacturing Technologies. Master Thesis. WZL RWTH Aachen and MIT.
Dalquist, S. and T. Gutowski. 2004. Life Cycle Analysis of Conventional Manufacturing Techniques: Die Casting, December. LMP Working Paper LMP-MIT-TGG-03-12-19-2004
Dalquist, S. and T. Gutowski. 2004. Life Cycle Analysis of Conventional Manufacturing Techniques: Sand Casting, Proceedings of the ASME International Mechanical Engineering Congress and RD&D Exposition, Anaheim, California, USA, November 13-19.
EPRI (Electric Power Research Institute) 2014 available on-line;
https://smartmanufacturingcoalition.org/sites/default/files/beyond_3d_printing_-_new_demand_on_electric_fnl.pdf
Faludi, J., M. Baumers, R. Hague, and I. Maskery. 2017. Environmental Impacts of Selective Laser Melting: Do Printer, Powder, or Power Dominate? Journal of Industrial Ecology. This issue
Gestel, C. V., 2015 “Study of physical phenomena of selective laser melting towards increased productivity,” Thesis, EPFL.
Go, J., S. N. Schiffres, A. G. Stevens, and A. J. Hart, 2017. “Rate limits of additive manufacturing by fused filament fabrication and guidelines for high-throughput system design,” Additive
Manufacturing.
Gusarov, A.V., and I. Smurov. 2010. Modeling the interaction of laser radiation with powder bed at selective laser melting. Physics Procedia, LANE 2010. : 381-394. Available online at
www.sciencedirect.com
Gutowski, T.G., M.S. Branham, J.D. Dahmus, A.J. Jones, A.Thiriez, and D.P. Sekulic, 2009.
Thermodynamic Analysis of Resources Used in Manufacturing Processes, Environmental Science and Technology, 43 : 1584-1590.
[running head: RESEARCH AND ANALYSIS]
[running foot: Gutowski et. al., Rate and Energy Efficiency Limits for AM]
This article is protected by copyright. All rights reserved.
25 Gutowski, T. G., and D. P. Sekulic, 2011. Thermodynamic Analysis of Resources Used in
Manufacturing Processes, Ch 6 in Thermodynamics and the Destruction of Resources, B. R. Bakshi, T. G. Gutowski and D. P. Sekulic, Cambridge University Press.
Huang R., M. Riddle, D. Graziano, J. Warren, S. Das, S. Nimbalkar, J. Cresko and E. Masanet. 2015. Energy and emissions saving potential of additive manufacturing: the case of lightweight aircraft components. Journal of Cleaner Production.
Kamath, C., B. El-dasher, G.F. Gallegos, W.E. King, and A. Sisto. 2014. Density of additively-manufactured, 316L SS parts using laser power-bed fusion at powers up to 400 W. Int. J. Adv. Manuf. Techno. 74: 65-78.
Kannatey-Asibu Jr.,E., 2009, Principles of Laser Materials Processing, Wiley
Kalpakjian S. and S. Schmid, 2014, Manufacturing Engineering and Technology, 7th ed Pearson
Kellens, K., E. Yasa, R. Renaldi, W. Dewulf, J.-P. Kruth, and J. Duflou. 2011. Energy and Resource Efficiency of SLS/SLM Processes. [Online]. Available:
https://lirias.kuleuven.be/handle/123456789/314470. [Accessed: 28-Oct. 2014].
Kellens, K., M. Baumers, T. Gutowski, W. Flanagan, R. Lifset and J. Duflou. 2017. Environmental Dimensions of Additive Manufacturing Mapping application domains and their environmental implications. Journal of Industrial Ecology. This issue
Kempen, K., L. Thijs, E. Yasa, M. Badrossamay, W. Verheecke and J.-P. Kruth. 2011. Process Optimization and Microstructural Analysis for Selective Laser Melting of AlSi 10Mg. Available at http://sffsymposium.engr.utexas.edu/Manufscripts /2011/2011-37-Kempen.pdf
[running head: RESEARCH AND ANALYSIS]
[running foot: Gutowski et. al., Rate and Energy Efficiency Limits for AM]
This article is protected by copyright. All rights reserved.
26 Kruth, J.P., B. Vandenbroucke, J. van Vaerenbergh, and P. Mercelis. 2005. Benchmaking of different SLS/SLM processes as Rapid Manufacturing techniques. Presented at the Proceedings of the PMI, paper 525, Gent, Belgium.
Kruth, J.-P, M. Badrossamay, E. Yasa, J. Deckers, L. Thijs and J.V. Humbeeck. 2010. Part and material properties in selective laser melting of metals. Proc. 16th Int. Symp. Electromatchining ISEM XVI, Shanghai.
Kruth, Jean-Pierre, Jan Deckers, Evren Yasa, and Ruben Wauthle. 2012. “Assessing and Comparing Influencing Factors of Residual Stresses in Selective Laser Melting Using a Novel Analysis Method.” Proceedings of the Institution of Mechanical Engineers Part B-Journal of Engineering Manufacture 226 (B6): 980–91.
Laohaprapanon,A, Jeamwatthanachai,P, Wongcumchang, M., Chantarapanich,K., Chantaweroad, S., Sitthiseripratip,K., Wisutmethangoon, S., 2012, Optimal scanning condition of selective laser melting processing with stainless steel 316L powder, in Advanced Materials Research:816- 820.
Liu, B. , R. Wildman, C. Tuck, I. Ashcroft, and R. Hague, “Investigation the effect of particle size distribution on processing parameters optimization in selective laser melting process,” in
International solid freeform fabrication symposium: an additive manufacturing conference. University of Texas at Austin, Austin, 2011, pp. 227–238.
Luo, Y., Z. Ji, M.C. Leu, and R. Caudill. 1999. Environmental Performance Analysis of Solid Freeform Fabrication Processes. In Proceedings of the 1999 IEEE International Symposium on Electronics and the Environment. pp. 1-6.
Schleifenbaum, H., A. Diatlov, C. Hinke, J. Bultmann, and H. Voswinckel. 2011. Direct photonic production: towards high speed additive manufacturing of individualized goods. Prod. Eng. Vol. 5(4) : 359-371.
[running head: RESEARCH AND ANALYSIS]
[running foot: Gutowski et. al., Rate and Energy Efficiency Limits for AM]
This article is protected by copyright. All rights reserved.
27 Sheng, J. 2017 , “Processing Rate and Energy Consumption Analysis for Additive Manufacturing Processes: Material Extrusion and Powder Bed Fusion” MS Thesis, Department of Mechanical Engineering, Massachusetts Institute of Technology
Sreenivasan, R. and D.L. Bourell, 2009. Sustainability study in selective laser sintering – an energy perspective, The 20th Solid Freeform Fabrication Symposium , UT Austin, pp. 3-5.
Steen, W. and J. Manzumder, 2010, Laser Material Processing, 4th Ed. Springer
Tadmor, Z., and C. Gogos, 2006, Principles of Polymer Processing, 2nd edition, Wiley
Telenko, C., and C.C. Seepersad. 2012. A comparison of the energy efficiency of selective laser sintering and injection molding of nylon parts. Rapid Protytpe. J. 18(6) : 472-481.
Tolochko N.K., Y. V. Khlopkov, S. E. Mozzharov, M. B. Ignatiev, T. Laoui, and V.I. Titov. 2000. Absorptance of powder materials suitable for laser sintering. Rapid Prototyping Journal, Vol. 6(3): 155-161.
Walachowicz, F., I. Bernsdorf, U. Papenfuss, C. Zeller, A. Graichen, V. Navrotsky, N. Rajvanshi, and C. Kiener, (2017) “Comparative energy, resource and recycling lifecycle analysis of the industrial repair process of gas turbine burners using conventional machining and additive manufacturing,” Journal of Industrial Ecology
Wiesner A., and D. Schwarze. 2014. Multi-Laser Selective Laser Melting. Industrial paper, 8th International Conference on Photonic Technologies, LANE 2014.
Yadroitsev, I., A. Gusarov, I. Yadroitsava, and I. Smurov. 2010. “Single Track Formation in Selective Laser Melting of Metal Powders.” Journal of Materials Processing Technology 210 (12): 1624–31. doi:10.1016/j.jmatprotec.2010.05.0