Attack Detection System Using Unsupervised
Learning and Multivariate Correlation Analysis
Ms. Nisha Bhalke1, Mr. Rahul Paikrao2
1,2 Computer Engineering Department, Pune University
Abstract: Availability of network services are being vulnerable by the growing range of Denial-of-Service (DoS) attacks.
Effective mechanisms for DoS attack detection are demanded. Different systems were projected for detection Dos attacks using machine learning, statistical analysis, data processing or mining, etc. This system is an improvement over earlier system in which k- means clustering is used over a training samples so that it can categorize the samples into different clusters and then it applies statistical methods to find the correlation between features to gain deep information standard deviation, mean and covariance matrix. Applying multivariate correlation analysis on each cluster will help us to get profile parameters according to their cluster and thus allowing us to know sharp boundary of characterizing a sample packet. This will help us to reduce false positive rate and to improve efficiency and detection accuracy.
Keywords: Denial of Service Attacks, Attack Detection, K-Means Clustering, Triangle Area Map, Multivariate Correlation
Analysis.
I. INTRODUCTION
Today networks have wonderful growth that has speed up a shift in computing environments from computer systems to network information systems. A large volume of valuable information such as personal profiles and credit card information is shared and transferred through networks. Hence, network security [1] has become a lot of vital than ever. However, given open and complex interconnected network systems, it is tough to check a secure networking environment Intruders endanger system security by crashing services, changing critical information, and stealing important data. Intrusion detection systems (IDSs) [2] are designed to discover malicious activities that attempt to compromise the confidentiality, integrity and assurance of computer systems.
Unlike a firewall that filters bad traffic, an IDS [2] analyzes packets to observe malicious attack attempts. Based on the report of the CSI/FBI laptop crimes and security survey in 2006, the IDS has become the fifth most generally used security technology. Certainly, intrusion detection systems have become critical components in network security. Therefore, two factors [2] need to be considered to confirm IDS effectively. First, the IDS should deliver reliable detection results.
Intrusion detection systems are divided in two main categories which are 1. Misused base detection system 2. Anomaly base detection system [2]. Misused base detection systems are used to detect attacks by observing the network activity and looking for matching signatures. Day by day variety of new attacks are used which can’t be detected by misused based detection system as it only works for existing system.
To overcome the problem of misused base detection technique, anomaly base detection techniques were developed to achieve novelty-tolerant detection system. These are based on signature modelling of normal traffic. Anomaly based detection system have the advantage of detecting new attacks but their false positive rates are high. [2], [9] Intrusion detection systems have undergone numerous developments in each power and scope. Machine learning [8], [19] is the ability of a machine that mechanically improves its performance through learning from expertise. Machine learning [8], [19] techniques are used to study normal computer activities and determine abnormal behaviors that deviate from commonplace as intrusions.
II. RIVIEWOFLITERATURE
It illustrates the survey of methodologies and techniques used [20] for Unsupervised Machine Learning which are used for learn advanced, non-linear models with millions parameters to use large amount of unlabeled data. Primarily structure in information is finding in clustering and it has long history in scientific field. K-means is that the most preferred and simple clustering algorithm. It specifies the role of Intrusion Detection System [2] (IDS) that has been unavoidable within the area of data and Network Security. Anomaly based intrusion detection technique is one among the building blocks of such a foundation. The try has been created to use hybrid learning approach by combining k-Medoids primarily based clustering technique followed by Naı̈ve Bayes classification technique. As a result of the fact that k-Medoids clustering techniques represent the real world situation of knowledge distribution, the proposed increased approach will cluster the whole data into corresponding clusters more accurately than k-Means such that it results in a higher classification. An experiment is administrated in order to evaluate performance, accuracy, detection rate and false positive rate of the classification theme.
A. Rule Based Intrusion Detection System
In the rules based approach, acceptable behavior of a subject is captured by a set of rules which is used to identify anomalous observed behavior.
This technique search attack by noticing events within the system and applying collection of rules that results in a choice concerning whether a given pattern of activity is suspicious Rule-based anomaly detection. Similar to statistical anomaly detection [9], it does not need knowledge of security vulnerabilities inside the system but instead of that, large database of rules are required. In Rule-based penetration identification, rules are used for distinctive better-known penetrations that will exploit known weaknesses. Rules can also be defined that establish suspicious behaviors.
B. Signature Based Intrusion Detection System
In signature detection, the intrusion detection decision is made on the basis of knowledge of a model of the intrusive process. We can define in any and all instances which is legal or illegal behavior and compare the observed behavior accordingly. It ought to be noted that these sightors strive to detect proof of intrusive activity regardless of any plan of what the background traffic, i.e. normal behavior [21] of the system appearance like. These detectors have to be compelled to be able to operate no matter which is the normal behavior of the system, checking instead for patterns that are thought by the designers to stand out against the possible background traffic.
This places extremely strict demands on the model of the character of the intrusion. No untidiness is afforded if the ensuing detector is to possess AN allowable detection and false alarm rate.
C. Intrusion Detection using k-means Clustering
Data Mining is analysis of empiric information set to seek out unknown relationship and to summarize large amounts of knowledge in novel ways in which are each intelligible and helpful to data owner in proactive decision making process. Data mining [2] is currently attainable attributable to advance technologies in engineering science and machine learning.
Using normal reports, Data mining can make decisions and create alerts when action is required. Data Mining is being used in various fields, such as in business for Customer Relationship Management (CRM), Marketing, etc. In medicine for laboratory research, pharmaceutical research, etc., in forecasting of weather and its traffic, etc. In aviation for pilot assistance and in research in the areas of medicine, business, security, etc.
In order to apply the techniques to information security we required datasets. We used unremarkably applied dataset in data security analysis. The network intrusion dataset from the KDD archive brought up because the KDD 99 Cup dataset. The KDD 99 [2] Cup has forty one attributes that's ten percent of original dataset suggests that 500,000 rows.
D. Existing System
The proposed approach evolved from this system which comprises of three major steps. Sample by sample detection mechanism is involved in every phase.
Step 2, Multivariate Correlation Analysis (MCA) in which the method of Triangle Area Map (TAM) generation is used to find correlations between the features that are coming from step 1.The presence of network intrusions build the correlation distinct from each other which have to be used as indicators to identify any attacks this extracted correlations are stored in Triangle Area Map (TAMs) which are used to replace original base features. This process generates the normal profile which is used as reference to detect any intrusion attacks. [5]
E. Normal Profile Generation Based on Triangular-Area-Based MCA Algorithm:
Require: X [normal TAMlower] with g elements
[normal,lower]←
Generate covariance matrix Cov for X[normalTAMlower] for i = 1 to g do
MDnormal, i← MD (TAM[normal,ilower], )
{Mahalanobis distance between TAM [normal, ilower] and computed}
end for
μ ←
σ ←
Pro ← (N (μ, σ2), TAMnormallower, Cov) return pro
In step 3, anomaly based detection system is used for decision making. Any intrusion attack is detected without requiring any relevant knowledge. The existing system enhances robustness makes it harder to be evaded as the attacks need to be developed new attacks which cannot be simply detected but have to be very distinct from the existing area.
F. Attack Detection Algorithm
Require: Observed traffic record xobserved, normal profile Pro: (N (μ, σ2), , Cov) and parameter α
Generate TAMobservedlower for the observed traffic record xobserved
MDobserved ← MD (TAMobservedlower, )
if (μ − σ ∗ α) ≤ MDobserved ≤ (μ + σ ∗ α) then return Normal
else
return Attack end if
III. SYSTEMARCHITECTURE/SYSTEMOVERVIEW
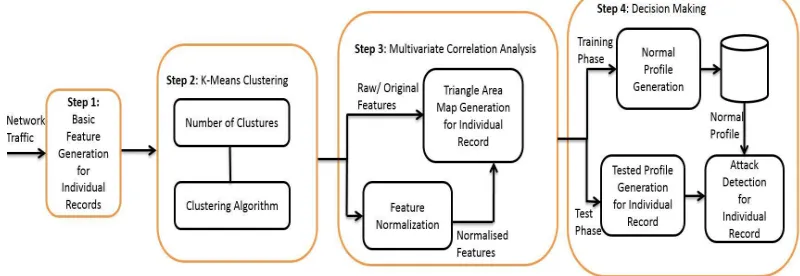
To improve the performance of proposed system we have introduced unsupervised learning algorithm [8], [19] in addition to the existing system. The proposed system is divided into four steps as described in the below figure (System Architecture).
A. Features Generalization
B. K-Means Clustering
C. MCA (Multivariate Correlation Analysis)
Fig. 1 Block Diagram of Proposed System (System Architecture)
A. Step 1: Features Generalization
Every individual record is used to generate features and then passed on to the next step is the system. These individual records are stored in internal network helping detector to provide a best solution for targeted network as legitimate profiles used by detectors are developed for smaller networks. [22]
B. Step 2: K-Means Clustering
It is additional step which is implemented in this system. The unsupervised learning algorithm used which is K-means clustering algorithm used to store the individual traffic records. [2], [11], [17] They are clustered according to the contents in the records, i.e. features and labels used to differentiate the clusters. Clusters are formed on the basis of classifications done by the attack types and features of the same. This has been reduced the calculation time in the detection process and the system has provided an optimal solution to get precise results.
C. K-means Clustering Algorithm
x is dataset contains (x1, x2, x3, x4 …Xn)
µi=4 i=1…..k //initialize the center of cluster ci= {j: d(x ;µ) ≤d) (x; µ1), l≠i, j=1… n}
// attribute the closest cluster to each data point
µi=
/ set the position of each cluster to mean of all data point belongs to cluster Repeat 2 & 3 until convergence.
Notation |c|= number of element in cluster
This cluster is then passed as input to normal profile generation.
D. Step 3: MCA (Multivariate Correlation Analysis)
A normal profile is to be generated which is done by finding correlation of each feature of a record.[6],[15] This is done individually for every cluster formed in step 2. When every cluster is executed individually, we are supposed to get very precise correlations of every feature to the other in that cluster. This process is called as the training phase, where all correlations are calculated and stored. Three types of data is generated in normal profiles which are TAM (bar), Mean (µ) and Standard Deviation (σ).
E. Normal Profile Generation Based on Triangular-Area-Based MCA Algorithm using Clustered Dataset:
1) Require: X [normal TAMlower] with g clustered elements
[normal,lower]←
Generate covariance matrix Cov for X[normalTAMlower]
{Mahalanobis distance between TAM [normal, ilower] and computed} end for
μ ←
σ ←
Pro ← (N (μ, σ2), TAMnormallower, Cov) return pro
All the extracted correlations, namely triangle areas stored in Triangle Area Maps (TAMs) then which are used to replace the original basic features or the normalized features to represent the traffic records. This provides higher capable information to differentiate between legitimate and illegitimate traffic records.
Threshold formula hreshold = µ + σ ∗α
All generated values are stored in a database which are used as reference in the detection process.
F. Step 4: Decision Making or Detection Mechanism
The anomaly-based detection mechanism [5] is used in Decision Making. In this mechanism, every incoming packet to the system is analyzed through the proposed system to catch any possible anomaly or malicious content in that packet. Every incoming packet goes through the clustering process first. Further process is done after the packet is classified into any of the preformed clusters in the training process. Only the matrix generated for that particular cluster is used to find correlation between each feature of the packet and the trained data. If the contents in the new packet relate to any of the malicious content correlation in the trained data, then that packet is classified as abnormal and is side-lined and also the administrator is informed. If no malicious content is found then the packet is passed without any actions.
G. Attack Detection Algorithm for Normalized and Cluster Dataset:
1) Require: Observed traffic record xobserved, normal profile Pro: (N (μ, σ2), , Cov) and parameter α
Generate TAMobservedlower for the observed traffic record xobserved
MDobserved ← MD (TAMobservedlower, )
if (μ − σ ∗ α) ≤ MDobserved ≤ (μ + σ ∗ α) then return Normal
else
return Attack end if
IV. SYSTEMANALYSIS
For evaluation of attack detection system, we have used KDD 99 dataset. KDD 99 is only publically available which is labelled based dataset. We have used only 10 percent labelled dataset from KDD 99 dataset. It consists of 3 different types of legal traffic i.e. TCP, UDP and ICMP traffic. [4], [16]
The performance analysis of this proposed system is done by finding False Positive Rate (FPR), Accuracy, Detection Rate (DR) of this system, as this is done in two phases for comparisons basis.
A. Performance Analysis Against Original Dataset
which contains all attacks like Teardrop, Smurf, Pod, Neptune, Land, etc. as well as normal packets taken from KDD 99 dataset.
TABLEI
TABLENAME(AVERAGEDETECTIONPERFORMANCEOFTHEPROPOSEDSYSTEMONORIGINALDATAAGAINST
DIFFERENTTHRESHOLDS)
Type of Records
Threshold
1σ 1.5σ 2σ 2.5σ 3σ
Normal 98.74% 99.03% 99.23% 99.35% 99.47%
Teardrop 71.50% 63.92% 57.93% 52.81% 48.45%
Smurf 100.00% 100.00% 100.00% 100.00% 100.00%
Pod 100.00% 100.00% 100.00% 100.00% 100.00%
Neptune 82.44% 61.79% 57.00% 54.84% 52.96%
Land 0.00% 0.00% 0.00% 0.00% 0.00%
Back 99.96% 98.82% 99.58% 99.44% 99.31%
TABLEII
TABLENAME(DETECTIONRATEANDFALSEPOSITIVERATESACHIEVINGBYTHEPROPOSEDSYSTEMON
ORIGINALDATA)
Metrics Threshold
1σ 1.5σ 2σ 2.5σ 3σ
FPR 1.26% 0.97% 0.77% 0.65% 0.53%
DR 95.11% 89.44% 88.11% 87.51% 86.98%
Accuracy 95.20% 89.67% 88.38% 87.79% 87.28%
B. Performance Analysis Against Normalized Dataset and Clustering
To verify the performance of this system against clustered and normalized data, 10 fold cross validation is done. Dataset is clustered and normalized using k-means clustering and the statistical normalization techniques. The results are shown in Table III and IV.
The Detection rate of normalized data is shown in Table III. The overall performance of using normalized dataset is increased in proposed system. The attacks which are misclassified like Teardrop, Land, and Neptune are correctly classified in MCA and k-means clustering based proposed system. [5][3] Proposed systems Detection Rate (DR) of Normal record increases (97.36% to 98.75%) along with increase in Threshold from 1σ to 3σ. Also DR of all attacks increases like Neptune, Teardrop, Land is showing 100% DR along with increase in Threshold.
TABLEIII
TABLENAME(AVERAGEDETECTIONPERFORMANCEOFTHEPROPOSEDSYSTEMONNORMALIZEDDATA
AGAINSTDIFFERENTTHRESHOLDS)
Type of Records
Threshold
1σ 1.5σ 2σ 2.5σ 3σ
Normal 97.36% 97.97% 98.56% 98.56% 98.75%
Teardrop 100.00% 100.00% 100.00% 100.00% 100.00%
Smurf 100.00% 100.00% 100.00% 100.00% 100.00%
Pod 100.00% 100.00% 100.00% 100.00% 100.00%
Neptune 100.00% 100.00% 100.00% 100.00% 100.00%
Land 100.00% 100.00% 100.00% 100.00% 100.00%
Back 99.32% 98.96% 94.09% 93.79% 93.56%
reaches to 1.25%.
TABLE IV
TABLE NAME (DET ECT ION RATE AND F ALSE P OSIT IVE RAT E ACHIEVING BY THE PROPOSED SYST EM ON NO R M ALIZ ED DATA)
Metrics Threshold
1σ 1.5σ 2σ 2.5σ 3σ
FPR 2.64% 2.03% 1.68% 1.44% 1.25%
DR 100.00% 99.99% 99.97% 99.97% 99.96%
Accuracy 99.93% 99.95% 99.93% 99.93% 99.93%
The detection rate varies from 100% to 99.96%. Hence it is cleared that k-means algorithm and MCA based system achieves the better performance than original dataset.
V. PERFORMANCERESULT
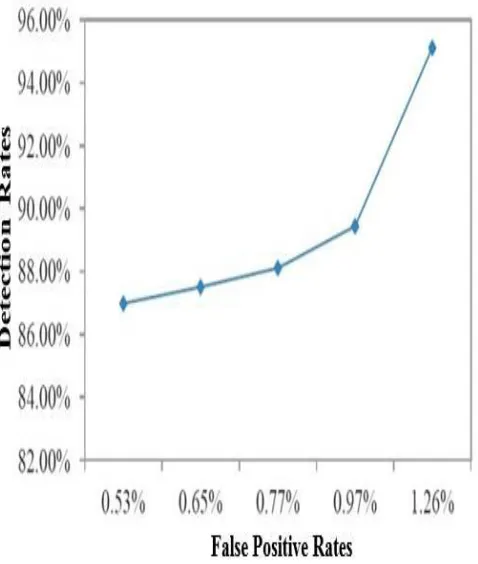
To compare two evaluations i.e. analysis on the basis of original dataset and analysis on the basis of normalized dataset, ROC curve is used.
The ROC curve shows the relationship between detection rate and false positive rate. When the large number of false positive rate is allowed then the detection rate of attack detection is increased. In Fig. 2(a), the ROC curve that analyzing the original data using MCA based proposed detection system shows rising trend.
Fig. 2(a) ROC Curve for Analyzing Original Data
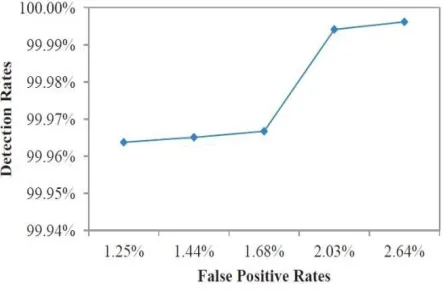
[image:8.612.180.419.365.647.2]Fig. 2(b) ROC Curve for Analyzing Normalized Data
Fig. 2(b) shows that our proposed k-means and MCA based detection system always provides better and high detection rate while working with normalized data than with original data.
VI. CONCLUSION
In this paper, we have proposed attack detection system, that detects attack using Anomaly and MCA based detection techniques, additionally we have used unsupervised learning algorithm i.e. k-means clustering to cluster the packets according to their protocols. We have used KDD 99 Dataset that is used as input to our system. It is Standard Dataset which provides effectiveness and performance of proposed attack detection system. KDD 99 Dataset consists of large number of datasets that are clustered into different clusters using k-means clustering technique according to their protocols. Then they are normalized to increase the detection rate by using MCA technique. In MCA, we generate Normal Profile for every packet of clusters. TAM (Triangular Area Map) is used to generate Normal Profile that reduces the time complexity of our system. By Normalizing data we have achieved maximum detection rate, correct classification of attacks and better detection accuracy.
For future work, we are going to test our attack detection system using real world data and we are going to use more refined classification techniques to further lighten the false positive rate.
VII. ACKNOWLEDGMENT
I would wish to give thanks all the authors of various analysis papers referred throughout putting this on paper. It had been information gaining and useful for the additional analysis to be done in future.
REFERENCES
[1] Youssef Senhaji, Hicham Medromi, “Network Security:Hybrid IDPS”, International Journal of Applied Information Systems (IJAIS) ISSN : 2249-0868 Foundation of Computer Science FCS, New York, USA.
[2] Roshan Chitrakar, Huang Chuanhe, “Anomaly based Intrusion Detection using Hybrid Learning Approach of combining k-Medoids Clustering and Nave Bayes Classification”.
[3] Shi Na, Liu Xumin, Guan yong, “Research on k-means Clustering Algorithm”, Third International Symposium on Intelligent Information Technology and Security Informatics.
[4] Mahbod Tavallaee, Ebrahim Bagheri, Wei Lu, and Ali A. Ghorbani, “A Detailed Analysis of the KDD CUP 99 Data Set”, Proceedings of the 2009 IEEE Symposium on Computational Intelligence in Security and Defense Applications (CISDA 2009).
[5] Zhiyuan Tan, Aruna Jamdagni, Xiangjian, Priyadarsi Nanda, Ren Ping Liu, “A System for Denial-of-Service Attack Detection Based on Multivariate Correlation Analysis”, IEEE TRANSACTIONS ON PARALLEL AND DISTRIBUTED SYSTEMS VOL:25 NO:2 YEAR 2014.
[6] Zhiyuan Tan, Aruna Jamdagni, Xiangjian He, Priyadarsi Nanda and Ren Ping Liu, “Triangle-Area-Based Multivariate Correlation Analysis for Effective Denial-of-Service Attack Detection”, 2012 IEEE 11th Inter- national Conference on Trust, Security and Privacy in Computing and Communications. [7] V. Paxson, “Bro: A System for Detecting Network Intruders in Real- time”, Computer Networks, vol. 31, pp. 2435-2463, 1999.
[8] Alireza Osareh, Bita Shadgar, “Intrusion Detection in Computer Networks based on Machine Learning Algorithms”, IJCSNS International Journal of Computer Science and Network Security, VOL.8 No.11, November 2008.
[9] P. Garca-Teodoro, J. Daz-Verdejo, G. Maci-Fernndez, and E.Vzquez, “Anomaly-based Network Intrusion Detection: Techniques, Systems and Challenges”, Computers Security, vol. 28, pp. 18-28, 2009.
[10] D. E. Denning, “An Intrusion-detection Model”, IEEE Transactions on Software Engineering, pp. 222-232, 1987.
[image:9.612.203.425.92.237.2][12] S. Jin, D. S. Yeung, and X. Wang, “Network Intrusion Detection in Covariance Feature Space”, Pattern Recognition, vol. 40, pp. 2185-2197, 2007. [13] C. F. Tsai and C. Y. Lin, “A Triangle Area Based Nearest Neighbors Approach to Intrusion Detection”, Pattern Recognition, vol. 43, pp.222- 229, 2010. [14] Z. Tan, A. Jamdagni, X. He, P. Nanda, and R. P. Liu, “Denial of-Service Attack Detection Based on Multivariate Correlation Analysis”, Neural Information
Processing, 2011, pp. 756-765.
[15] Z. Tan, A. Jamdagni, X. He, P. Nanda, and R. P. Liu, “Triangle- Area-Based Multivariate Correlation Analysis for Effective Denial of- Service Attack Detection”, The 2012 IEEE 11th International Conference on Trust, Security and Privacy in Computing and Communications, Liverpool, United Kingdom, 2012, pp. 33-40.
[16] M. Tavallaee, E. Bagheri, L. Wei, and A. A. Ghorbani, “A Detailed Analysis of the KDD Cup 99 Data Set”, The The Second IEEE Interna- tional Conference on Computational Intelligence for Security and Defense Applications, 2009, pp. 1-6.
[17] K. Krishna and M. Narasimha Murty, “Genetic K-means algorithm”, IEEE Trans. Syst., Man, Cybern. B, Cybern., vol. 29, no. 3, pp. 433439, Jun. 1999. [18] L. Ertoz, M. Steinbach, and V. Kumar, “A new shared nearest neighbor clustering algorithm and its applications”, in Proc. Workshop Clustering High
Dimensional Data Appl., 2002, pp. 105115.
[19] Alireza Osareh, Bita Shadgar, “Intrusion Detection in Computer Net- works based on Machine Learning Algorithms”, Computer Science De- partment, Faculty of Engineering, Shahid Chamran University, Ahvaz, Iran.
[20] Memoona Khanum, Tahira Mahboob, Warda Imtiaz, Humaraia Abdul Ghafoor, Rabeea Sehar, “A Survey on Unsupervised Machine Learning Algorithms for Automation, Classification and Maintenance”, International Journal of Computer Applications 119(13):34-39, June 2015.
[21] P. Garca-Teodoroa, J. Daz-Verdejoa, G. Macia-Fernandeza, E. Vazquez, “Anomaly-based network intrusion detection: Techniques, systems and challenges”. [22] Yuteng Guo,Beizhan Wang, Xinxing Zhao,Xiaobiao Xie, Lida Lin, Qingda Zhou, “Feature Selection Based on Rough Set and Modified Genetic Algorithm for