ORIGINAL RESEARCH ARTICLE
FACIAL EXPRESSION RECOGNITION BY USING MODIFIED
CONVOLUTIONAL NEURAL NETWORK (MCNN) AND
MODIFIED GABOR FILTER
1
Lafta Raheem Ali,
2Dr. Haider Kadhim Homood and
3Dr. Amer Saleem Elameer
1
Postgraduate Candidate, Informatics Institute for Postgraduate Studies, ICCI, Baghdad, Iraq
2Department of Computer Science, Al- Al-Mustansiriya University, Baghdad, Iraq
3
Informatic Institute for Postgraduate Studies (IIPS), ICCI, Baghdad, Iraq
ARTICLE INFO ABSTRACT
Facial expression recognition is an important topic in an image processing and pattern recognition. The expressions work as a mirror for what happened in the human mind, enable individuals to understand what their peers feel. This paper suggest develop a system for recognizing facial expressions, modified Gabor filter has been use for feature extraction, then classifying the facial expressions based on these extracted features by using a modified Convolutional Neural Network (MCNN). the results of using MCNN with Modified Gabor was (93%-99%) accuracy rate with very less time for both multi and single face respectively We have gotten a very good result comparing to the other methods in the same fields (PCA and Gabor filter. This results with Extended Cohn Kanade (CK+) and JAFFE Databases.
*Corresponding author
Copyright ©2017, Lafta Raheem Ali et al. This is an open access article distributed under the Creative Commons Attribution License, which permits unrestricted use, distribution, and reproduction in any medium, provided the original work is properly cited.
INTRODUCTION
Expression shows the internal changes that are happens inside the human mind at any time [Ekman, 1997]. Facial expressions play a critical role in human communication, where the emotional states for human are convey and perceived through it, besides that, facial expression is consider the stronger way for representing the demeanor of human [Lucey et al., 2010]. The basic emotions are divided into seven emotions ( six emotions which are: angry, sadness, happiness, surprise, fear, and disgust, besides the natural expression) [Ekman, 1997]. As indicated by Mehrabian (1968), the contribution of the verbal section of a message is only for 7% from the whole message effect, while the vocal section for 38% and finally facial expressions for 55% to the speaker's message effect [Arumugam, 2011; Rashi Goyal and Tanushri Mittal, 2014]. In this paper, a proposed system for recognizing facial expressions based on micro-expressions has been developed by using a convolutional neural network and modifying it to get high accurate and less average rate time classification
method. The input of the system is a facial image while the output is the emotion type.
Related works
This part reviews some previous works which are linked to this research and related to these three components:
Shan et al (2017) proposed a system for recognizing facial expressions, where Haar-like features which represent the first part of the Viola-Jones approach is used to detect the face region, while CNN algorithm is used for extracting the features and classifying the facial expressions. Both the Japanese Female Facial Expression Database (JAFFE) and the Extended Cohn-Kanade Dataset (CK+) are used. The accuracy performance of the proposed system reaches 76.7442% and 80.303% in the JAFFE and CK+, respectively [Shan et al., 2017].
ISSN: 2230-9926
International Journal of Development Research
Vol. 07, Issue, 11, pp.16960-16967, November,2017
Article History:
Received 14th August 2017
Received in revised form 29th September, 2017
Accepted 03rd October, 2017
Published online 29th November, 2017 Key Words:
Facial expression,
Convolutional Neural Network, Gabor Filter.
Citation: Lafta Raheem Ali, Dr. Haider Kadhim Homood and Dr. Amer Saleem Elameer. 2017. “Facial Expression Recognition by Using Modified
Convolutional Neural Network (MCNN) and Modified Gabor Filter.”, International Journal of Development Research, 7, (11), 16960-16967.
Lopes et al. (2017) proposed a method for achieving facial expression recognition system by using Convolutional neural network (CNN) for feature extracting and classifying facial expressions, the result was 96.76% of accuracy in the CK+ database beside it was fast to train [Lopes
Sumaidaee et al. (2015) proposed a novel method for facial expression recognition based on the combination of using Gabor filters and Local Gradient Code-Horizontal Diagonal (LGC-HD) features, the results on the JAFFE and CK databases showed high recognition rate of 93.33% and 90 respectively [Al-Sumaidaee et al., 2015].
Gabor filter
The images contain particular angles have features that aligned with it, and for extracting these features Gabor filters can be applied for this mission. The properties of the optimal localization in both frequency domains and spatial domains are acquired by Gabor filter. The frequency and angle represent the most significant parameters of the Gabor filter. Particular features that share similar frequency or angle can be chosen and used for individualizing among various facial expressions depicted in images [Liu et al., 2015]. The linear filter that used to detect the edge in the spatial domain is a Gabor filter. Gabor filter has two components to represent the orthogonal directions, these components are real and imaginary. Those two components can be formed into a complex or may be used individually. Equation 1 is used for computing
of Gabor filter [Deepak Verma, 2012]
While equation 2 is used for computing imaginary component of Gabor filter [Yousra, 2009]:
and parameters are given by the following equations 3 and 4:
Where the (x, y) specify the position of pixel in the spatial domain, while the other samples represent parameters and illustrated in table 1.
Table 1: Gabor's parameters [Yousra, 2009
proposed a method for achieving facial on recognition system by using Convolutional neural network (CNN) for feature extracting and classifying facial expressions, the result was 96.76% of accuracy in the CK+ et al., 2017].
Al-proposed a novel method for facial expression recognition based on the combination of using Horizontal Diagonal HD) features, the results on the JAFFE and CK databases showed high recognition rate of 93.33% and 90.62%
The images contain particular angles have features that aligned with it, and for extracting these features Gabor filters can be applied for this mission. The properties of the optimal localization in both frequency domains and spatial domains are The frequency and angle represent the most significant parameters of the Gabor filter. Particular features that share similar frequency or angle can be chosen d for individualizing among various facial expressions The linear filter that used to detect the edge in the spatial domain is a Gabor filter. Gabor filter has two components to represent the orthogonal hese components are real and imaginary. Those two components can be formed into a complex or may be used individually. Equation 1 is used for computing real component
Eq. 1
imaginary component
+ ) Eq. 2 parameters are given by the following equations 3
Eq. 3
Eq. 4
) specify the position of pixel in the spatial domain, while the other samples represent parameters and
Yousra, 2009]
The Gabor filter bank is exploited to extract the features. The filter bank and other several filters are created and used f extracting multi-scale and multi
[image:2.595.319.547.131.295.2]given facial image. The filter bank that is commonly used consisting of Gabor filters of 8 orientations and 5 different scales, as shown in figure 1[Ali
Figure 1: Gabor filter, 8 orie scales [Ali et al., 2015
The representation of Gabor features for the facial image can be computed by convolution the image I(x, y) with the Gabor filters bank gu,v(x,y) for getting Gabor filter as shown in
equation 5. The result of the convolution process is a complicated value, where the decomposition of it to real and imaginary part is possible as shown in equations 6 and 7 respectively [Deepak Verma, 2012;
u,v u,v
Where Gu,v isGabor filter of size the convolutional operator.
u,v u,v
u,v u,v
E refers to even part, while O
and the phase
decomposition of filtering, as shown in equations 8 and 9 respectively [Hafez, 2015]
(
Convolutional Neural Networks (CNN)
CNN is an efficient recognition algorithm which is widely used in pattern recognition and image processing. It has many features such as simple structure, less training parameters and adaptability. It has become a hot topic in voice analysis and image recognition. Its weight shared network structure make it more similar to biological neural networks. It reduces the complexity of the network model and the number of weights [Liu et al., 2015]. Convolutional neural networks (CNNs) use images as input and convolution kernels, made up out of weights, as connections to the next layer.
The Gabor filter bank is exploited to extract the features. The filter bank and other several filters are created and used for scale and multi-orientation features from a given facial image. The filter bank that is commonly used consisting of Gabor filters of 8 orientations and 5 different
Ali et al., 2015]
filter, 8 orientations and 5 different Ali et al., 2015]
The representation of Gabor features for the facial image can be computed by convolution the image I(x, y) with the Gabor (x,y) for getting Gabor filter as shown in equation 5. The result of the convolution process is a complicated value, where the decomposition of it to real and imaginary part is possible as shown in equations 6 and 7
, 2012; Hafez et al., 2015].
Eq. 5
Gabor filter of size u and angle v, represent
Eq. 6
Eq. 7
O is the odd part. The amplitude are both resulted from the decomposition of filtering, as shown in equations 8 and 9
Eq. 8
Eq. 9
Convolutional Neural Networks (CNN)
CNN is an efficient recognition algorithm which is widely in pattern recognition and image processing. It has many features such as simple structure, less training parameters and adaptability. It has become a hot topic in voice analysis and image recognition. Its weight shared network structure make it lar to biological neural networks. It reduces the complexity of the network model and the number of weights Convolutional neural networks (CNNs) use images as input and convolution kernels, made up out of
These weights are arranged in 3D volumes and transforms the input image into an output of node activations [
2016].
Convolutional Neural Networks Architecture
There are four operations for building any block of Convolutional Neural Network. These operations are Convolutional Layer, ReLU (Rectified Linear Unit)
layer (Sub Sampling) and fully Connected Layer or as known (Classification). The work of these operations is as following
Convolutional Layer
This layer forms the basis of the convolutional Neural Networks and accomplishes the basic training operations, and therefore the network neurons are fired. The work of this layer is preserving the spatial relationship among pixels through learning image features by using input data in a form of small squares. Every image in this method can be represen
matrix of pixel values [Wu, 2017] . The convolutional process can be expressed in more general as there is (
layer, and by using (m x m) filter f. The output size
( ), so the convolutional can be computed by the equation 10:
.
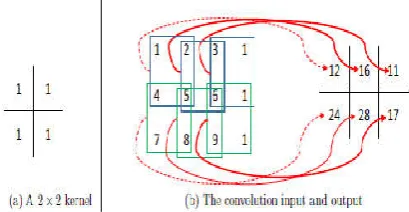
[image:3.595.314.532.241.422.2]The overall process is illustrated in figure 2, where (a) represent is 2 x 2 kernel, the stride by 1 pixel each time, and (b) is 4 x 4 matrix which represent the convolutional input at left, at right the output of this process.
Figure 2: Demonstration of the Convolutional Operation. [ 2017]. Before the beginning of convolutional process, three parameters must be decided for detect the size of activation map.
Theses parameters are [Habrman, 2016
Depth: which represent the number of filters used in t convolution operation.
Stride: represent the number of pixels by which the filter matrix will be slide on the input matrix.
Zero-padding: this parameter provide the ability to add zero's around the border of input matrix.
ReLU (Non Linearity)
ReLU is a non-linear operation and it refers to Rectified Linear Unit. The work of this layer is to replace the values of each negative pixel in the activation map with zero[15]. ReLU provide a non-linearity to the CNN, where the most today's data which need to train by CNN is in form of non
The size of input will not be changed under this layer, and the output of ReLU is given by the function at 11 equation [ 2017] which is illustrated in figure 3:
These weights are arranged in 3D volumes and transforms the input image into an output of node activations [Habrman,
Convolutional Neural Networks Architecture
There are four operations for building any block of Network. These operations are Rectified Linear Unit), Pooling layer (Sub Sampling) and fully Connected Layer or as known (Classification). The work of these operations is as following
basis of the convolutional Neural Networks and accomplishes the basic training operations, and therefore the network neurons are fired. The work of this layer is preserving the spatial relationship among pixels through t data in a form of small squares. Every image in this method can be represented as a The convolutional process can be expressed in more general as there is ( ) input
. The output size will be ), so the convolutional can be
Eq. 10
The overall process is illustrated in figure 2, where (a) represent is 2 x 2 kernel, the stride by 1 pixel each time, and (b) is 4 x 4 matrix which represent the convolutional input at
of the Convolutional Operation. [Wu, Before the beginning of convolutional process, three parameters must be decided for detect the size of activation map.
Habrman, 2016]
: which represent the number of filters used in the
: represent the number of pixels by which the filter matrix will be slide on the input matrix.
: this parameter provide the ability to add zero's around the border of input matrix.
and it refers to Rectified Linear Unit. The work of this layer is to replace the values of each negative pixel in the activation map with zero[15]. ReLU linearity to the CNN, where the most today's ed to train by CNN is in form of non-linear data. The size of input will not be changed under this layer, and the output of ReLU is given by the function at 11 equation [Wu,
Where
,
represent the input and output respectively whose are the same size, and,
Here , , refers to height, width and depth.
1) is the size of input, (F) is spatial extent and (S) is the stride. The output of this layer is
Where:
= ( – )/ + 1.
= ( – )/ + 1.
= .
Figure 3. The ReLU function
Pooling Layer
Subsampling (also called spatial pooling or down sampling). The work of this layer is reducing the dimensionality of each activation map with retains only the most significant information. There are various types of spatial pooling like average, max, sum, etc. Max pooling will be used
Where at this type of pooling if there is 2 x 2 window and the stride is 2 then the result will be the largest element from the activation map in that window. Average pooling for that window or the sum of overall
also can be used instead of max pooling. Equation 12 shows max pooling function[16].
Where n x n is the block region will be token for applying max-pooling on it, the output of this process is a single value which represent the biggest value at that block, and
represent the input layer, applies a window function
to the input patch, and computes the maximum in the neighborhood [16][17]. Max pooling
figure 4.
Fully Connected Layer
This mean that every neuron in the previous layer is connected with each neuron in the next layer
Eq. 11
input and output respectively whose
,
, and
refers to height, width and depth. ( 1 × 1 ×
is the size of input, (F) is spatial extent and (S) is the stride. The output of this layer is ( 2 2 2)
The ReLU function [Wu, 2017]
Subsampling (also called spatial pooling or down sampling). The work of this layer is reducing the dimensionality of each activation map with retains only the most significant information. There are various types of spatial pooling like etc. Max pooling will be used in this work. Where at this type of pooling if there is 2 x 2 window and the stride is 2 then the result will be the largest element from the activation map in that window. Average pooling for that elements for the same window also can be used instead of max pooling. Equation 12 shows
Eq. 12
is the block region will be token for applying pooling on it, the output of this process is a single value which represent the biggest value at that block, and
×
applies a window function
( , )
input patch, and computes the maximum in theMax pooling operation is shown in
[image:3.595.59.264.444.550.2]Figure 4. Max Pooling [Valero, 2016
The output of the previous layers (convolutional and pooling) which represent high-level features of the inputted image. Fully connected layer will use these features to classify the input images into different classes depending on the training dataset. The features that result from convolutional and subsampling layers sometimes are good and equivalent for the classification task, but it is better when those features are combined together. The summation of output probabilities of the FC layer always equal to 1, which ensured by softmax function, where it take values between zero and one and the sum of these values. Equation 13 shows the softmax function [Amara, 2017]:
Where
( )
the softmax function, (z) acts is the input, ( output for real values between zero and one, ( inputs and each input may have one or more [image:4.595.51.275.474.776.2]C is the number of dimensions). The total error at the output layer can be got by using equation 5 [Amara, 2017
Figure 5. Proposed system architecture Valero, 2016]
The output of the previous layers (convolutional and pooling) level features of the inputted image. Fully connected layer will use these features to classify the input images into different classes depending on the training e features that result from convolutional and subsampling layers sometimes are good and equivalent for the classification task, but it is better when those features are combined together. The summation of output probabilities of o 1, which ensured by softmax function, where it take values between zero and one and the sum of these values. Equation 13 shows the softmax function
Eq. 13
is the input, (y) is the output for real values between zero and one, (c) is number of inputs and each input may have one or more dimension (where The total error at the output
, 2017]:
sed system architecture
Proposed system design
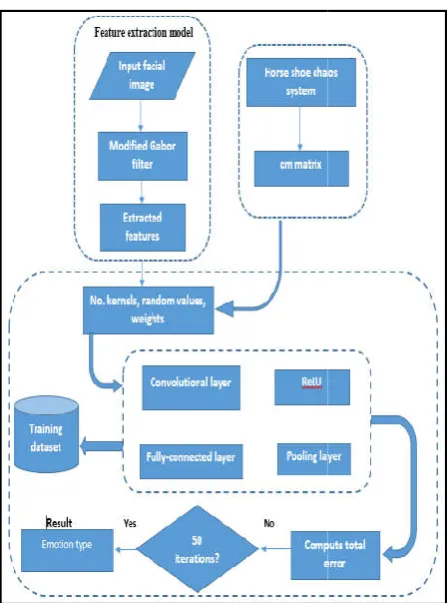
Modified Gabor filter used to extract the facial features, this method is achieved by applying two stages of modifications. The first proposed modifictions are combine between the wvelet trnsform with the Gbor filter to increse the effeciency and speeding of the gbor filter. The second modifiction is using the control parameters and averaging of the transformed image in equation 5 to adjusted the features extrcted by Gbor filter and increse the accurcy
modification is using the control parmeter to the equation 8 to adjust the value of the output ampltude tht effect in the next Gabor calculations. Modified Convolutional Neural Network (M-CNN) have been used to classify the type of emotion depending the extracted features by Modified Gabor filter. The modification to the CNN is by using the horseshoe chaos system in the learning phase in order to increas
speed and get more efficient classification with stable decisions for different time periods. Figure 5 shows the architectural model of the proposed system.
Modified Gabor feature proposed algorithm
Input: Scale (R, G, B) image I.
Output: Features that are delivered to the classifier.
Step 1: Starts
Step 2: Apply 2-levels wavelet transform to the face image.
Step 2: For
= 0.1
transform image parts.Step 3: Resized (I) with scale.
Step 4: For
= 0 180
Step 5: Apply equations (2.10) and (2.11) to compute
′
.Step 6: Apply equations (2.8) and (2.9) to compute both real imaginary components of Gabor filter.
with following parameters:
Step 7: Compute the Gabor features by applying modify equation 2.12.
Modified Gabor filter used to extract the facial features, this method is achieved by applying two stages of modifications. first proposed modifictions are combine between the wvelet trnsform with the Gbor filter to increse the effeciency and speeding of the gbor filter. The second modifiction is using the control parameters and averaging of the transformed to adjusted the features extrcted by Gbor filter and increse the accurcy of this opertion. The third modification is using the control parmeter to the equation 8 to adjust the value of the output ampltude tht effect in the next fied Convolutional Neural Network CNN) have been used to classify the type of emotion depending the extracted features by Modified Gabor filter. The modification to the CNN is by using the horseshoe chaos system in the learning phase in order to increase the learning speed and get more efficient classification with stable decisions for different time periods. Figure 5 shows the architectural model of the proposed system.
Modified Gabor feature proposed algorithm
Scale (R, G, B) image I.
Features that are delivered to the classifier.
levels wavelet transform to the face image.
0.5
do steps 3 to 9 to the LL30
steps 5 to 9 5: Apply equations (2.10) and (2.11) to compute′
and6: Apply equations (2.8) and (2.9) to compute both real-imaginary components of Gabor filter.
Step 8: Decompose the result of step 7 to real and imaginary parts by applying equations (2.13) and (2.14).
Step 9: Compute the amplitude from the equation (2.15).
Where the ,
( , )
is the amplitude resulted from thedecomposing of iltering.
Step 10: Reducing the dimensions by 25 by resampling the image using sampling filter until features in feature
between 15 and 20.
Step 11: The extracted features is delivered to classifier.
Step 12: End.
MCNN Proposed Algorithm
Input: Training image (N x N) matrix.
Output: Emotion type with it's probability.
Step 1: Start
Step 2:
Initial the horseshoe chaos system and get the output numbers then stored in the chaos matrix (cm). The horseshoe chaos system are:
Step 3: Initialize:
Number of kernels (filters).
Filters' size.
A random values for all parameters.
Step 4: Apply convolution process by multiplying and summing each element in the filter matrix with the identical element in the input image according to the detected stride, by applying Eq.1.
=
Step 5: Apply ReLU operation to get non
replacing the negative values of each pixel in the activation map with zero through using Eq.2.
Step 6: Apply max pooling on the output of the ReLU layer for dimensionality reduction by applying Eq. 3.
8: Decompose the result of step 7 to real and imaginary parts by applying equations (2.13) and (2.14).
9: Compute the amplitude from the equation (2.15).
is the amplitude resulted from the
Reducing the dimensions by 25 by resampling the image using sampling filter until features in feature vector
11: The extracted features is delivered to classifier.
Initial the horseshoe chaos system and get the output numbers then stored in the chaos matrix (cm). The horseshoe chaos
convolution process by multiplying and summing each element in the filter matrix with the identical element in the input image according to the detected stride, by
Apply ReLU operation to get non-linearity by ative values of each pixel in the activation
Apply max pooling on the output of the ReLU layer for dimensionality reduction by applying Eq. 3.
aj = u(n, n))
Step 7: Apply FC layer, detect the emotion class and for each class find the output probabilities by applying Eq. 4.
Step 8: Compute the total error at the output layer using Eq. 5.
Step 9: Update:
Weights values using cm matrix.
Values of filter matrix using cm matrix.
Step 10: Repeat steps 2-9 until 50 rounds.
Step11: Stored the micro-facial emotions classifications results
Step 12: End.
Databases
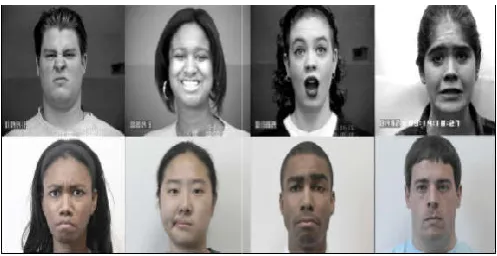
This work implemented with two databases, the first is Cohn Kanade database collects from students
universities whose age from 18 to 30 years, this database is extended to CK+ database. Figure 4 show examples of this database. The second database are used is the Japanese’s Females Facial Expressions (JAFFEs) Databases. The databases contain 213 image of 7 facial
[image:5.595.309.558.474.602.2]facial-expressions and neutral) poses by 10 Japanese’s female models. Figure 5 show examples of this database.
Figure 4. Examples of CK+ database
Figure 5. The JAFFE Databases Examples
))
Apply FC layer, detect the emotion class and for each class find the output probabilities by applying Eq. 4.
Compute the total error at the output layer using Eq. 5.
Weights values using cm matrix. using cm matrix.
9 until 50 rounds.
facial emotions classifications
This work implemented with two databases, the first is Cohn Kanade database collects from students of more hundred universities whose age from 18 to 30 years, this database is extended to CK+ database. Figure 4 show examples of this database. The second database are used is the Japanese’s Females Facial Expressions (JAFFEs) Databases. The ain 213 image of 7 facial-expressions (6 basics expressions and neutral) poses by 10 Japanese’s female-models. Figure 5 show examples of this database.
Examples of CK+ database
[image:5.595.307.556.634.777.2]Experimental result
[image:6.595.341.524.85.246.2]Frequency domain is more reliable for extraction features from image to ease the effect of scaling, rotating and translation in order to reduce the tedious manual work needed for the normalization process. Figure 6 shows an example of Modified Gabor filter results.
Figure 6. Modified Gabor Filter Output
The results in figure 6 were get from applied the modified Gabor filter using the following information
aspect ratio psi=0; phase theta=90; orientationbw=2.8; bandwidth or effective width lambda=3.5; wavelength pi=180; No. of scales= 4; No. of orientations= 5. No. of rows in a 2
20. No. of columns in a 2-D Gabor filter =20.
[image:6.595.62.265.139.387.2]second technique used to facial features extraction is the PCA algorithm. The PCA was used for comparison purpose with modified Gabor filter. Figure 7 shows the PCA results. Table 2 and 3 show the results of applied MVJ, VJ, and PCA in features extraction.
Figure 7. PCA features extraction results
The modified convolution neural network (MCNN) used to classify and take the decisions depend on the extracted features (micro-expressions and facial expressions).
Frequency domain is more reliable for extraction features from image to ease the effect of scaling, rotating and translation in order to reduce the tedious manual work needed for the normalization process. Figure 6 shows an example of the
Modified Gabor Filter Output
The results in figure 6 were get from applied the modified Gabor filter using the following information: gamma=0.3; aspect ratio psi=0; phase theta=90; orientationbw=2.8; bandwidth or effective width lambda=3.5; wavelength pi=180; No. of scales= 4; No. of orientations= 5. No. of rows in a 2-D Gabor filter=
D Gabor filter =20. While the second technique used to facial features extraction is the PCA algorithm. The PCA was used for comparison purpose with modified Gabor filter. Figure 7 shows the PCA results. Table 2 and 3 show the results of applied MVJ, VJ, and PCA in
PCA features extraction results
[image:6.595.337.530.230.389.2]The modified convolution neural network (MCNN) used to classify and take the decisions depend on the extracted features
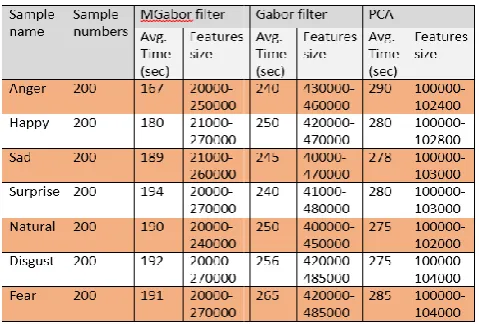
Table 2. The average time and features size of single face detection using the Gabor, MGabor, and PCA
Table 3. The average time and features size of Multi detection using the Gabor, MGabor, and PCA
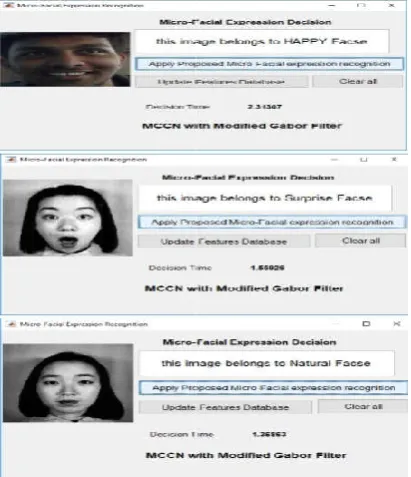
The MCNN content three layers with different size
on the features size passing to it. But the output is one of the seven emotions for human face with seven facial expressions. The MCNN will classify the Facial and Micro expression Feature and take decision for expression type (happy, sad, anger, fear, surprise, disgust, and natural). The MCNN designed to take the features from three different features extraction methods (modified Gabor filter, Gabor filter, and PCA). Figures 8-10 show the MCNN result with modified Gabor filter, Gabor filte
[image:6.595.332.538.542.781.2]extraction. Tables 4-4.7 show the result of the MCNN with different features extraction methods.
Figure 8. MCNN with Modified Gabor Filter results The average time and features size of single face detection using the Gabor, MGabor, and PCA
The average time and features size of Multi- face detection using the Gabor, MGabor, and PCA
The MCNN content three layers with different size depending on the features size passing to it. But the output is one of the seven emotions for human face with seven facial expressions. The MCNN will classify the Facial and Micro-Facial expression Feature and take decision for expression type anger, fear, surprise, disgust, and natural). The MCNN designed to take the features from three different features extraction methods (modified Gabor filter, Gabor 10 show the MCNN result with modified Gabor filter, Gabor filter, and PCA features 4.7 show the result of the MCNN with different features extraction methods.
[image:6.595.37.268.556.732.2]Figure 9. MCNN with Gabor Filter Results
[image:7.595.319.548.92.316.2]Figure 10. MCNN with PCA Results
Figure 11. Accuracy rate of Multi- face Human Emotions Recognition using the Gabor, Modified Gabor, and PCA
MCNN with Gabor Filter Results
MCNN with PCA Results
face Human Emotions Recognition using the Gabor, Modified Gabor, and PCA
Table 4: The average time and features size of single Human Emotions Recognition using MCNN and Gabor, Modified Gabor,
[image:7.595.324.546.97.317.2]and PCA
Table 5: The average training time and features size of single Human Emotions Recognition using MCNN and Gabor, Modified
Gabor, and PCA
Table 4. 1: The decision accuracy of Multi
Recognition using the Gabor, Modified Gabor, and PCA
Conclusion
The main objective of the proposed system is to recognition the human emotions based on the facial expression and micro expression for the mobile devices and computers.
Table 4: The average time and features size of single Human Emotions Recognition using MCNN and Gabor, Modified Gabor,
and PCA
age training time and features size of single Human Emotions Recognition using MCNN and Gabor, Modified
Gabor, and PCA
: The decision accuracy of Multi- face Human Emotions Gabor, Modified Gabor, and PCA
[image:7.595.53.275.330.773.2] [image:7.595.308.548.370.532.2]We implement the proposed system (evaluated and testing) under different cases and using two face databases. From the results, the proposed modification give us a good results comparing with same methods without modify them. Less than time execution and more accuracy for classification and recognition for seven human emotions expression. We conclude that:
Modified Gabor filter have been used to extract the facial features with high speed and best the efficiency in features extraction due to the wavelet transform effects.
Modified Convolutional neural network can be considered as one of the best Facial expression detection due to the ability to deals with many types of features extracted from different features extractions methods with same efficiency for all features types and size.
MCNN able to classify the emotions of each facial image and it was a very successful method for detecting the emotions which are represented by the micro expressions on the face.
REFERENCES
Ali, L. R., Homood, H. K. and Elameer, A. S. 2017. “Feature Extraction Techniques on Facial Images : An Overview,” Int. J. Sci. Res., vol. 6, no. 9, pp. 2015–2018.
Al-Sumaidaee, S. S., Dlay, S. A. M., Woo, W. L. and Chambers, J. A. 2015. “Facial Expression Recognition using Local Gabor Gradient Code-Horizontal Diagonal Descriptor,” in 2nd IET International Conference on Intelligent Signal Processing (ISP), 2015, pp. 1–6. Amara, J., Owonibi, M., Kaur, P. and Bouaziz, B. 2017.
“Convolutional Neural Network Based Chart Image Classification,” in 25th International Conference in Central Europe on Computer Graphics, Visualization and Computer Vision, 2017.
Arumugam, D. and Be, S. 2011. “Emotion classification using facial expression,” Int. J. Adv. Comput. Sci. Appl., vol. 2, no. 7, pp. 92–98.
Ekman, P. 1997. “Should We Call it Expression or Communication,” Innovation, vol. 10, no. 4, pp. 333–344. Habrman, D. 2016. “Face Recognition with Preprocessing and
Neural Networks,” Linköping University, Department of Electrical Engineering, Master Thesis.
Hafez, S. F., Selim, M. M. and Zayed, H. H. 2015. “2D Face Recognition System Based on Selected Gabor Filters and Linear Discriminant Analysis LDA,” Int. J. Comput. Sci. Issues, vol. 12, no. 1, pp. 33–41.
K. O. and Nash, R. 2015. “An Introduction to Convolutional Neural Networks,” no. December.
L. K. S. and K. J. Deepak Verma, “Performance Analysis of Feature Extraction Technique for Facial Expression Recognition,” Int. J. Adv. Comput. Technol. ISSN2319-7900, vol. 2, no. 4, pp. 16–20, 2012.
Liu, T., Fang, S., Zhao, Y., Wang, P.and Zhang, J. 2015. “Implementation of Training Convolutional Neural Networks,” University of Chinese Academy of Sciences, Beijing, China.
Lopes, A. T., de Aguiar, E., De Souza, A. F. and Oliveira-Santos, T. 2017. “Facial expression recognition with Convolutional Neural Networks: Coping with few data and the training sample order,” Pattern Recognit., vol. 61, no. January, pp. 610–628.
Lucey, P., Cohn, J. F., Kanade, T., Saragih, J., Ambadar, Z. and Matthews, I. 2010. “The extended cohn-kande dataset (CK+): A complete facial expression dataset for action unit and emotionspecified expression,” IEEE Conf. Comput. Vis. Pattern Recognit. Work., no. July, pp. 94– 101.
Rashi Goyal and Tanushri Mittal, 2014. “Facial Expression Recognition using Artificial Neural Network,” HCTL Open Int. J. Technol. Innov. Res., vol. 10, no. July, pp. 1– 10.
Scherer, D., Andreas, M. and Behnke, S. “Evaluation of Pooling Operations in Convolutional Architectures for Object Recognition,” in 20th International Conference on Artificial Neural Networks (ICANN).
Shan, K., Guo, J., You, W., Lu, D. and Bie, R. 2017. “Automatic Facial Expression Recognition Based on a Deep Convolutional-Neural-Network Structure,” in IEEE Computer Society, pp. 123–128.
Valero, H. G. 2016. “Automatic Facial Expression Recognition,” School of Computer Science, The University of Manchester, Master Thesis.
Wu, J. 2017. “Introduction to Convolutional Neural Networks,” Nanjing University, China.
Yousra BEN JEMAA, S. K.2009. “Automatic local Gabor features extraction for face recognition,” Int. J. Comput. Sci. Inf. Secur., vol. 3, no. 1.
Zeiler, M. D. and Fergus, R. 2014. “Visualizing and Understanding Convolutional Networks,” in Springer International Publishing Switzerland, pp. 818–833.
![Figure 1: Gabor filter, 8 orie scales [Ali et al., 2015filter, 8 orientations and 5 different Ali et al., 2015]](https://thumb-us.123doks.com/thumbv2/123dok_us/8894205.952199/2.595.319.547.131.295/figure-gabor-filter-orie-scales-filter-orientations-different.webp)