Prolonged exposure of human beta cells to
elevated glucose levels results in sustained
cellular activation leading to a loss of glucose
regulation.
Z Ling, D G Pipeleers
J Clin Invest.
1996;
98(12)
:2805-2812.
https://doi.org/10.1172/JCI119108
.
Human beta cells can be maintained in serum-free culture at 6 mmol/liter glucose, with 80%
cell recovery and preserved glucose-inducible functions after 1 wk. Between 0 and 10
mmol/liter, glucose dose-dependently increases the number of beta cells in active protein
synthesis (15% at 0 mmol/liter glucose, 60% at 5 mmol/liter, and 82% at 10 mmol/liter), while
lacking such an effect in islet non-beta cells (> 75% activated irrespective of glucose
concentrations). As in rat beta cells, this intercellular difference in glucose sensitivity
determines the dose-response curves during acute glucose stimulation of human beta cells.
During 2-h incubations, human beta cells synthesize 7 fmol insulin/10(3) cells at 0
mmol/liter glucose, 20 fmol at 5 mmol/liter, and 31 fmol at 10 mmol/liter. Culture at higher (10
or 20 mmol/liter) glucose does not affect beta cell recovery but decreases by 50-85% the net
effect of glucose upon insulin synthesis and release. These reduced responses to glucose
are not caused by diminished cellular activities but are the consequence of a shift of beta
cells to a state of sustained activation. The presence of more activated cells at low glucose
eliminates glucose-dependent cell recruitment as a mechanism for adjusting beta cell
responses to acute variations in glucose concentration. It leads to elevated basal
biosynthetic (3-fold) and secretory (10-fold) activities, and, hence, to a 4-fold reduction […]
Research Article
Find the latest version:
J. Clin. Invest.
© The American Society for Clinical Investigation, Inc. 0021-9738/96/12/2805/08 $2.00
Volume 98, Number 12, December 1996, 2805–2812
Prolonged Exposure of Human
b
Cells to Elevated Glucose Levels Results in
Sustained Cellular Activation Leading to a Loss of Glucose Regulation
Zhidong Ling and Daniel G. Pipeleers
Diabetes Research Center, Vrije Universiteit Brussel, B-1090 Brussels, Belgium
Abstract
Human b cells can be maintained in serum-free culture at 6 mmol/liter glucose, with 80% cell recovery and preserved glucose-inducible functions after 1 wk. Between 0 and 10 mmol/liter, glucose dose-dependently increases the number of b cells in active protein synthesis (15% at 0 mmol/liter glucose, 60% at 5 mmol/liter, and 82% at 10 mmol/liter), while lacking such an effect in islet non-b cells (. 75% acti-vated irrespective of glucose concentrations). As in rat b cells, this intercellular difference in glucose sensitivity determines the dose–response curves during acute glucose stimulation of human b cells. During 2-h incubations, human b cells synthesize 7 fmol insulin/103 cells at 0 mmol/liter glucose, 20
fmol at 5 mmol/liter, and 31 fmol at 10 mmol/liter. Culture at higher (10 or 20 mmol/liter) glucose does not affect b cell recovery but decreases by 50–85% the net effect of glucose upon insulin synthesis and release. These reduced responses to glucose are not caused by diminished cellular activities but are the consequence of a shift of b cells to a state of sus-tained activation. The presence of more activated cells at low glucose eliminates glucose-dependent cell recruitment as a mechanism for adjusting b cell responses to acute variations in glucose concentration. It leads to elevated basal biosyn-thetic (3-fold) and secretory (10-fold) activities, and, hence, to a 4-fold reduction in the b cell insulin content and the amount of insulin released at maximal glucose stimulation. Prolonged exposure of human b cells to high glucose can thus lead to a loss of their glucose regulation as a consequence of sustained cellular activation, without signs of glucose-induced toxicity or desensitization. (J. Clin. Invest. 1996. 98:2805–
2812.) Key words: glucose • islets • insulin • diabetes
Introduction
Glucose is the major physiologic regulator of pancreatic b cell functions. Patients with non–insulin-dependent diabetes ex-hibit a b cell mass which has lost this homeostatic control by
the nutrient. Their chronically elevated glucose levels are be-lieved to further impair the insulin secretory responsiveness to glucose (1–6). This concept has been documented in animal models of hyperglycemia (7–11) as well as in cultured islet cell preparations (12–15). It is still unclear whether the deleterious effects of persistently high glucose concentrations are the con-sequence of a glucose-induced toxicity (1–5), desensitization (5, 6, 12, 13), hyperactivation (16, 17), or exhaustion (1, 2, 18) of the b cells. In a recent study on rat islet b cells, we found that chronic exposure to elevated glucose levels induces a pro-longed state of b cell activation and glucose hypersensitivity rather than a glucotoxicity or glucose desensitization (19). This shift in the functional state of the b cell preparation is respon-sible for a reduced insulin secretory response to glucose (19). It is now important to assess whether this mechanism also oc-curs in human b cells, in particular in view of the species differ-ences which have been observed recently between human and rat b cells (20). In this study, we first investigated whether the glucose responsiveness of human b cells also depends on the existence of intercellular differences in glucose sensitivity as observed previously in rat b cells (21–24). Then, we examined whether prolonged exposure to elevated glucose levels affects this functional heterogeneity and, as a consequence, impairs the glucose responsiveness of the human b cells.
Methods
Preparation of human islets and dispersed islet cells.Human pancre-ata were obtained from organ donors (17 donors, 20–50 yr of age) at European hospitals affiliated with b-Cell Transplant, a European Concerted Action on islet cell transplantation in diabetes. Islets were prepared in the Central Unit of this multicenter program (Medical Campus, Vrije Universiteit Brussel). After collagenase digestion and Ficoll gradient purification (25), the islet-enriched interface was har-vested, washed, and suspended in Ham’s F10 medium supplemented as described below. The preparations were precultured for 1 or 2 d to reduce contamination by cell debris and exocrine cells. To examine the glucose sensitivity of individual cells, the precultured islet prepa-rations were dispersed into single cells and further purified by flow cytometry using cellular light scatter as discriminating parameter (26). Immediately after dissociation and purification, . 90% of the cells stained positive in vital staining with neutral red. The purified fractions consisted of 70–85% endocrine cells, 10–20% nongranu-lated cells, and 2–8% exocrine cells. To examine the influence of chronic exposure to high glucose, undissociated islet preparations were cultured at different concentrations of glucose.
Culture. Freshly isolated human islet preparations were precul-tured for 1 or 2 d in bacteriologic Petri dishes (14 cm diameter; Nunc, Roskilde, Denmark) with 35 ml Ham’s F10 medium containing 0.5% (wt/vol) BSA (fraction V, RIA grade; Sigma Chemical Co., St. Louis, MO), 0.075 mg/ml penicillin, and 0.1 mg/ml streptomycin, 6.1 mmol/ liter glucose, 2 mmol/liter glutamine, 2 mmol/liter leucine, 2 mmol/li-ter nicotinamide, and 2% human serum. Afmmol/li-ter this preculture period, the islet preparations were either dissociated into single cells or dis-tributed over Petri dishes and further cultured for 7 d in serum-free Part of this work was presented at the 29th Congress of the European
Association for the Study of Diabetes, Istanbul, 1993.
Address correspondence to D. Pipeleers, Diabetes Research Cen-ter, Vrije Universiteit Brussel, Laarbeeklaan 103, B-1090 Brussels, Belgium. Phone: 32-2-477-45-41; FAX: 32-2-477-45-45; E-mail: dpip @mebo.vub.ac.be
Ham’s F10 medium containing 1% BSA, 2 mmol/liter glutamine, and different concentrations of glucose. The cells were kept at 378C in a CO2 incubator (95% air/5% CO2) with medium changes every 3 d.
Samples were taken after isolation, after dissociation, and at the end of culture for measuring the cellular insulin and DNA content, and for electron microscopy and immunocytochemistry (26). The via-bility of dispersed single islet cells was examined by vital staining with neutral red (27).
Total protein and insulin biosynthesis. Protein synthesis by single islet cells was measured after a 45-min preincubation in Ham’s F10 medium containing 0.5% BSA and 1 mmol/liter glutamine. The cells were then distributed into 5-ml Falcon tubes and incubated for 30 min in 200 ml Ham’s F10 medium containing different concentrations of glucose, 1% BSA, 50 mCi l-[3,5-3H]tyrosine (specific activity 50 Ci/
mmol; Amersham International, Buckinghamshire, United Kingdom). The total tyrosine concentration was 15 mmol (5 mmol [3H]tyrosine
and 10 mM unlabeled tyrosine) and the specific activity of the tracer was 16.7 Ci/mmol. When protein synthesis was measured in cultured islet preparations, the fractions were washed twice in Earle’s Hepes medium and three times in Ham’s F10 medium without glucose. This wash procedure took 40–60 min. Preparations were then incubated for 2 h under the same condition as dispersed cells. The labeling incu-bation was stopped by adding 0.8 ml cold Earle’s Hepes containing 1 mmol/liter unlabeled tyrosine. After extensive washing the prepara-tions were either extracted in 1 ml acetic acid (2 mol containing 0.25% BSA) for measurement of total protein and proinsulin biosyn-thesis (23) or processed for autoradiography.
Autoradiography of dispersed single islet cells and cultured islets.
The use of autoradiographs for analyzing the protein synthetic activ-ity of individual cells has been described previously (23, 24). The 3
H-labeled single cell preparations were washed with PBS, fixed in 4% (vol/vol) paraformaldehyde for 15 min at room temperature, washed with distilled water containing 0.5% BSA, and dried on polylysine-coated glass slides. The cells were then postfixed for 15 min in 4% (vol/vol) paraformaldehyde, and stained for insulin using a mouse an-tiinsulin serum and rhodamine-labeled second antibodies. The cells were also stained for DNA using bisbenzimidine (Hoechst 33342). The slides were then exposed for 4 h to an autoradiographic emulsion (L-4; Ilford Ltd., Basildon, Essex, United Kingdom), which was de-veloped for 7 min in ID-11 (Ilford) at 208C and then fixed for another 7 min in Hypam (Ilford). At least 200 insulin-positive or -negative cells were analyzed per condition. Autoradiographic silver grains were counted by epipolarization microscopy at a final magnification of 400. Background labeling, determined in parallel experiments without tracer, was , 2 grains/cell. The cells with . 5 silver grains were scored as positive and cells with . 30 silver grains were classi-fied as strongly positive.
The 3H-labeled islets were fixed with 2.5% glutaraldehyde,
post-fixed in 1% OsO4, and embedded in Spurr’s resin before 1-mm sec-tions were prepared. Secsec-tions were etched with sodium methoxide and stained for insulin using a guinea pig antiinsulin serum and a per-oxidase-labeled anti–guinea pig serum. The autoradiographs were ex-posed for 1 d and examined for silver grains on insulin-positive and -negative cells.
Measurement of insulin release. Cultured islet preparations were loaded on preformed columns consisting of 1 ml swollen Biogel P2 (Biorad, Richmond, VA) and perifused with Ham’s F10 medium sup-plemented with 0.5% BSA, 2 mmol/liter glutamine, 2 mmol/liter CaCl2, and equilibrated with 95% O2/5% CO2 (28). After 20 min of
perifusion with Ham’s F10 containing 2.5 mmol/liter glucose, 10-min pulses of glucose stimulation were induced with 5, 10, or 20 mmol/li-ter glucose, and supplemented, at 20 mmol/limmol/li-ter, with IBMX. At a flow rate of 1 ml/min, samples were collected over 1 min. At the end of each perifusion, the gels were removed from the column by sus-pension in 2 M acetic acid/0.25% BSA. The acid cell extracts and the collected fractions were assayed for insulin (26).
Data expression. DNA content of cultured preparations was ex-pressed as a function of the values at start, i.e., on the day of isolation.
Since cell counts could not be performed in the cell clumps, cell num-ber was calculated on the basis of DNA content, assuming that 6.6 ng DNA corresponds to 103 cells. This value has been determined in
sin-gle islet cell preparations. Cellular insulin content and insulin biosyn-thesis were expressed per 103b cells. Insulin release was expressed
per 103b cells or as a function of the corresponding cellular hormone
content. Results are expressed as means6SEM. Statistical signifi-cance of differences was calculated by ANOVA or by Student’s t test.
Results
Recovery of b cells after culture at different glucose concentra-tions. After 7 d of culture in serum-free medium containing 6 mmol/liter glucose, the DNA content of the islet preparations was reduced to 53% of the values measured in freshly isolated preparations (Table I). The percentage of b cells increased from 33% on day 1 to 53% on day 7 (Table I), indicating that the reduction in DNA content was mainly caused by loss of non-b cells, with 80% of b cells being recovered at the end of this culture period (Table I). The mean insulin content of the cultured b cells was 75% of that in freshly isolated b cells (P. 0.05, Table I). Culture at lower (3 mmol/liter) or higher glu-cose (up to 20 mmol/liter) did not significantly influence the recovery of b cells, but resulted in a lower cellular insulin con-tent (Table I). The highest degree of degranulation was no-ticed after culture at 20 mmol/liter glucose, with a fivefold lower cellular insulin content than after 6 mmol/liter glucose culture. Glucagon content was comparable in all cultured preparations (data not shown). In all conditions, the cultured preparations consisted of . 80% ultrastructurally intact cells as judged by electron micrographs (data not shown).
Glucose responsiveness of b cells after culture at 6 mmol/li-ter glucose.To determine the glucose responsiveness of indi-vidual cells, islets which had been cultured for 1 or 2 d at 6 mmol/ liter glucose were dissociated into single cells before incu-bating the cell suspension for 30 min with [3H]tyrosine at
[image:3.612.315.556.549.693.2]dif-ferent glucose concentrations. Glucose dose-dependently in-creased the rates of total protein and proinsulin synthesis in these preparations. The rates of total protein and proinsulin synthesis increased, respectively, two- and sixfold when glu-cose was raised from 0 to 10 mmol/liter (Fig. 1); further in-creases in glucose did not lead to higher rates of proinsulin
Table I. Composition of Human Islet Preparations after Culture Cell preparations Recovery Percent insulin-positive cells Insulin content
DNA b cells
% start fmol/103b cells
At start 100 100 3362 550061016 After 7 d of culture
at glucose
3 mmol/liter 56612* 77613 4864‡ 22156430*
6 mmol/liter 5368* 8268 5364§ 40726718
10 mmol/liter 52611* 71611 4966‡ 34606530§
20 mmol/liter 5869* 8868 5364§ 8036175*i
Data represent means6SEM of five to seven independent experiments. Statistical significance of differences was calculated by ANOVA, versus freshly isolated cells: ‡P, 0.05, §P, 0.01, *P, 0.001; vs. 6 mmol/liter
Figure 1. Effect of glucose on the synthe-sis of protein (left, Total), insulin (right), and noninsulin protein (left, NIP) by hu-man islets. Data are expressed per 103 cells
for protein and NIP synthesis and per 103 b cells for insulin synthesis. Means6SEM are calculated from 7 to 10 independent experiments. Statistical significance of dif-ferences with 0 mmol/liter glucose (*§) and with the preceding glucose level (‡¶) are calculated by ANOVA. ‡P, 0.05;
*¶P, 0.01; §P, 0.001.
Figure 2. Effect of glucose upon [3H]tyrosine incorporation by human islet cells. The preparations were incubated with [3H]tyrosine for 30 min
[image:4.612.55.557.178.673.2]synthesis. In the absence of glucose, 7% of newly formed pro-tein corresponded to insulin immunoreactive material; glucose dose-dependently increased this ratio up to 25% at 10 mmol/li-ter. Synthesis of noninsulin proteins was not significantly in-creased by glucose (Fig. 1).
The 3H-labeled preparations were also examined in
autora-diographs to determine the percentage of cells that were bio-synthetically active. More than 70% of insulin-negative cells were already intensely labeled in the absence of glucose (Figs. 2 and 3); addition of glucose did not further increase the per-centage of insulin-negative cells in active biosynthesis (Fig. 3). In contrast, only a few insulin-positive b cells were labeled in the absence of glucose, while glucose recruited,
dose-depen-dently, more b cells into biosynthetic activity (Figs. 2 and 3). This glucose-induced recruitment is most pronounced between 0 and 5 mmol/liter, leading to an additional 4666% of b cells into protein synthesis (Fig. 3). Raising the glucose concentra-tion from 5 to 10 mmol/liter recruited another 2065% of b cells (Fig. 3). At 10 mmol/liter glucose, 10–20% b cells remained biosynthetically inactive (Fig. 3).
[image:5.612.57.299.55.256.2]Effect of prolonged exposure to low or high glucose levels on subsequent glucose responsiveness of b cells. After 7 d of culture, the insulin biosynthetic activity of human islets was measured over 2 h of incubation at different concentrations of glucose. The data were expressed as function of the number of islet or b cells present in the islet preparations (see Methods). In the control preparations, cultured at 6 mmol/liter glucose, raising the glucose concentration from 0 to 20 mmol/liter dose-dependently increased the rates of insulin synthesis, up to fourfold higher rates with a half-maximal effect at 5 mmol/liter and maximal effect at 10 mmol/liter (Fig. 4). Basal and maximal synthetic activities were comparable with the values measured in Figure 3. Effect of glucose on the percent insulin-negative (left) and
insulin-positive (right) cells with [3H]tyrosine incorporation. Glucose
[image:5.612.314.556.82.233.2]dose-dependently recruits insulin-positive cells into biosynthetic ac-tivity. Insulin-negative cells are activated irrespective of the glucose concentration. Data represent means6SEM from four to nine inde-pendent experiments. Statistical significance of differences with 0 mmol/liter glucose (*§) and with the preceding glucose level (‡¶) is calculated by ANOVA. ‡P, 0.05; *¶P, 0.01; §P, 0.001.
Figure 4. Effect of glucose on insulin syn-thesis by human islets after 7 d of culture at 3, 6, 10, or 20 mmol/liter glucose. Data are expressed per 103b cells and represent
[image:5.612.62.400.542.731.2]means6SEM from five to seven indepen-dent experiments. Statistical significance of differences with 6 mmol/liter glucose cultured cells is calculated by ANOVA. *P, 0.05.
Table II. Effect of Glucose Concentration during Culture on Glucose-inducible Insulin Synthesis
Culture condition
(Pro)insulin synthesis
Net increase* Glucose
0 mmol/liter
Glucose 10 mmol/liter
fmol/103b cells/2 h
1 or 2 d at glucose
6 mmol/liter 762 4064 (3566) 7 d at glucose
3 mmol/liter 562 1764 (1263) 6 mmol/liter 762 3166 (2466) 10 mmol/liter 2263‡ 3768 (1566)
20 mmol/liter 2468‡ 2865 (463)§
1- or 2-d cultured preparations (Table II). Culture at 3 mmol/ liter glucose markedly reduced the maximal levels of glucose-inducible insulin synthesis, whereas culture at 10 mmol/liter glucose increased the basal rates and shifted the dose–response curve to the left with a half-maximal effect at 1 mmol/liter and maximal effect at 2.5 mmol/liter glucose (Fig. 4). After culture at 20 mmol/liter glucose, the cells exhibited the same high basal activity as after 10 mmol/liter glucose, but they were no longer responsive to the glucose stimulation (Fig. 4 and Table II). Consequently, the net glucose effect upon insulin synthe-sis, calculated as the difference between the rates at 10 and 0 mmol/litr, was markedly reduced after culture at 10 mmol/liter and disappeared completely after culture at 20 mmol/liter (Ta-ble II).
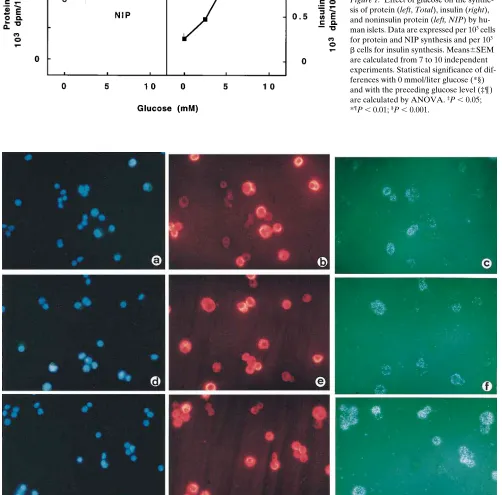
The observed differences in basal activity were the result of differences in the number of b cells that were biosynthetically active at 0 mmol/liter glucose. The protein synthetic activity of individual cells was analyzed in autoradiographs of sections of islets labeled during incubation in glucose-free medium. After culture at 6 mmol/liter glucose, only a few insulin-positive cells incorporated the radioactive amino acid; most grains accumu-lated in insulin-negative cells (Fig. 5 a). After culture at 20 mmol/liter glucose, most cells were intensely labeled, thus indi-cating that most insulin-positive cells were biosynthetically ac-tive in glucose-free medium (Fig. 5 c).
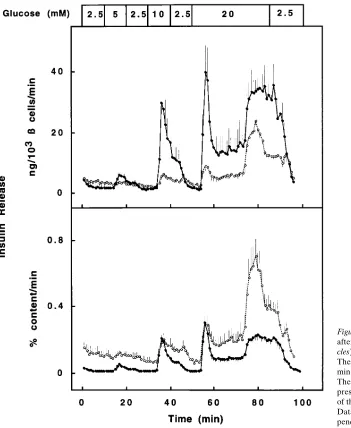
Effect of prolonged exposure to high glucose levels on sub-sequent secretory activity of cultured human b cells. The effect of culture at 20 mmol/liter glucose was also examined on the secretory responsiveness of the cells. The islet preparations were carried on perifusion columns and submitted to glucose pulses at increasing concentrations. Control islets were cul-tured at 6 mmol/liter glucose. At 2.5 mmol/liter glucose, the 20 mmol/liter cultured islets released twofold more insulin than the controls (Fig. 6 and Table III); however, they did not respond to a 5 mmol/liter glucose pulse while control islets were stimulated threefold. A secretory response was elicited by a 10 mmol/liter glucose pulse, but the amount of released hormone was markedly lower than in control preparations. At
20 mmol/liter glucose, both preparations exhibited a biphasic release (Fig. 6 and Table III). Since the lower insulin content of the 20 mmol/liter cultured cells (Table I) may contribute to their lower secretory output, insulin release was also expressed as a percentage of the cellular hormone content that was mea-sured at the start of the perifusion (Fig. 6 and Table III). In this mode of expression, basal discharge from 20 mmol/liter tured cells was ninefold higher than that from 6 mmol/liter cul-tured cells; their first phase release during the 10 and 20 mmol/ liter glucose pulses represented similar fractions of stored insu-lin than that from 6 mmol/liter cultured cells and their second phase release was even higher. Over the entire 90-min perifu-sion test, the 20 mmol/liter cultured cells released 18% of their hormone content, while the control cells secreted only 7% (Table III).
Discussion
This study demonstrated that human islet preparations can be cultured for at least 1 wk without considerable losses in the number and functions of the b cells. Culture is carried out in the same serum-free medium as previously selected for rat b cells (29) except for lower glucose concentrations (6 mmol/ liter instead of 10 mmol/liter for rat cells) and the absence of IBMX. After 1 wk of culture, 80% of the initial b cell number is recovered with a comparable insulin content as at start. The presence of lower (3 mmol/liter) or higher (10 and 20 mmol/ liter) glucose levels leads to lower cellular insulin reserves. This reduction is attributable to a decreased rate of insulin produc-tion at low glucose levels, whereas it results from an imbalance between the increased rates of insulin production and release at high glucose levels.
After 1 or 2 d of culture at 6 mmol/liter glucose, the human b cells exhibited a potent functional responsiveness to glucose, as illustrated by the five- to sixfold increase in proinsulin syn-thesis. The glucose-induced increase in hormone production was mediated by a dose-dependent activation of b cells, as has been observed previously in rat b cells (21–24). A rise in glu-Figure 5. Effect of glucose upon [3H]tyrosine incorporation by human islet cells after 7 d of culture at 6 mmol/liter (a and b) or 20 mmol/liter
glu-cose (c). Autoradiographs of 1-mm islet sections are shown after immunostaining for insulin and counterstaining with hematoxylin. The prepara-tions were incubated with [3H]tyrosine for 2 h in the absence of glucose (a and c) or with 10 mmol/liter glucose (b). After culture at 6 mmol/liter
[image:6.612.59.562.61.229.2]crease in insulin release. Culture at lower (3 mmol/liter) or at higher (10 or 20 mmol/liter) glucose did not result in a lower recovery of b cells, at least not after 1 wk, but markedly im-paired their functional state. After culture at 3 mmol/liter glu-cose, the human b cell population exhibited a marked reduc-tion in its insulin biosynthetic capacity during an acute stimulation by glucose. A similar finding has been made previ-ously for rat b cells after culture at 6 instead of 10 mmol/liter glucose, a phenomenon attributed to an increase in the pro-portion of glucose-unresponsive cells (19). After culture at 10 and 20 mmol/liter glucose, the human b cells were capable of achieving the same maximal rates of insulin biosynthesis as af-ter 6 mmol/liaf-ter culture, but these rates were already achieved when the cells were examined at 2.5 mmol/liter glucose or lower. By looking only at the shape of the dose–response curves after culture at elevated glucose levels, i.e., the small gain in amplitude for a rise in glucose concentration, one could infer that the b cells exhibit a state of inactivity or glucose in-sensitivity. However, our study indicates that such interpreta-tion is incorrect. Indeed, this culture condiinterpreta-tion was found to in-duce a prolonged state of activation in the majority of b cells, Figure 6. Insulin release from human islets after 7 d of culture at 6 mmol/liter (filled cir-cles) or 20 mmol/liter (open circles) glucose. The preparations were perifused with 10-min pulses of varying glucose concentration. The rate of insulin release per minute is ex-pressed per 103b cells (top) or as a function
of the cellular insulin content (bottom). Data represent means6SEM from six inde-pendent experiments.
cose from 0 to 5 mmol/liter recruited 45% b cells into biosyn-thetic activity and elevated insulin synthesis from 20 to 65% of its maximal rates. At 10 mmol/liter glucose, 80–85% of the b cells were activated. It is not yet known whether the 15–20% glucose-unresponsive cells require other stimuli for activation or whether they represent an inactive or impaired state of the cells. The glucose-dependent recruitment of cells was specific for the insulin-containing cells: in the insulin-negative cell pop-ulation, 75% of the cells were active irrespective of the glucose concentration. These results indicate that the human pancre-atic b cell population is composed of cells which differ in their individual sensitivity to glucose, a property that determines the shape of their dose–response curves to acute glucose stimula-tion. This cellular heterogeneity has also been noticed when human b cells were compared for their threshold of glucose-inducible calcium oscillations (30). The concept of functional heterogeneity in the b cell population (21, 22) can thus be ex-tended from the rat to the human species.
in-which was maintained when the cells were subsequently kept at low or even in the absence of glucose, indicating a hyperac-tivity of the cells. This state is maintained for a minimum of 24 h in the presence of basal glucose levels (our unpublished obser-vations). Prolonged exposure to high glucose resulted in a loss of the intercellular heterogeneity and thus eliminated the dose-dependent cellular activation as a mechanism to adjust functional responses to acute variations in glucose concentra-tions within the physiologic range. This conclusion is at vari-ance with that of Eizirik et al. (14) who reported that the meta-bolic and insulin biosynthetic activities of human islets are reduced after 7 d of culture at 28 mmol/liter instead of 5.6 mmol/liter glucose. This discrepancy may result from the use (in reference 14) of a different culture condition, i.e., RPMI medium with 10% fetal calf serum. It may also be attributable to another method of data expression: we have chosen to ex-press our data as a function of the number of b cells and not as a function of islet number, which can, in itself, be subject to variations.
The poor rise in the insulin release rates after glucose stim-ulation is thus not necessarily a sign for a failure of glucose to activate the pancreatic b cell population. After culture at 20 mmol/liter glucose, release rates were only twofold higher af-ter maximal glucose stimulation than at basal levels (2.5 mmol/ liter glucose). When hormone release was expressed as a func-tion of the cellular hormone content, this impaired amplifica-tion by glucose was not associated with a reduced secretory ac-tivity but, on the contrary, associated with a 10-fold higher basal activity than that in control cells. This is in line with our observations on the biosynthetic activity of the cells. Our data are also comparable with those obtained previously in both in vivo and in vitro models of hyperglycemia (16, 17, 31–34). This study emphasizes that the insulin levels measured at low or at high glucose cannot be taken as an adequate parameter for the secretory activity of the b cells, if they cannot be expressed as a function of the number of b cells and their hormone content. Prolonged exposure to high glucose resulted in markedly lower hormone stores and, hence, reduced the amounts that
were released by activated cells. However, restoration of insu-lin stores in human b cells is not always sufficient to normalize their glucose-inducible insulin secretion (11). In patients with non–insulin-dependent diabetes, the chronically elevated glu-cose levels can be expected to influence the secretory respon-siveness of the b cells via two mechanisms, first through the reduction in the cellular insulin stores, and secondly by in-creasing the proportion of b cells that remain activated irre-spective of acute variations in glucose. Both mechanisms will, in themselves, result in an impaired rise in circulating insulin levels after glucose stimulation. Therefore, the latter observa-tion is not necessarily a sign for an inactive or glucose-desensi-tized b cell population. It may, instead, express a hyperacti-vated state of the cells with a loss in functional heterogeneity. While the present in vitro study over 7 d indicates that both mechanisms can develop in normal human b cells, it does not provide evidence for their existence in non–insulin dependent diabetes mellitus patients whose b cells may exhibit a constitu-tive abnormality and where, furthermore, longer periods of hyperglycemia occur.
Acknowledgments
The authors thank the personnel of the central unit of b-Cell Trans-plant for preparing the human islets cells; René De Proft, Lutgart Heylen, Geert Stangé, and Gabriel Schoonjans for technical assis-tance in the present work, Run-Nian Wang for morphologic illustra-tion, and Decio Eizirik for proofreading the manuscript.
This work was supported by grants from the European Commu-nity (BMH1-CT92-0805, BMH4-CT95-1561), from the Ministry of Scientific Policy (CE-03-001), from the Flemish Community (93/019, Biomed), and from the Juvenile Diabetes Foundation International (DIRP 995004).
References
1. Weir, G.C., and J.L. Leahy. 1994. Pathogenesis of non-insulin-dependent (type II) diabetes mellitus. In Joslin’s Diabetes Mellitus, 13th. C.R. Hahn and G.C. Weir, editors. Lea & Febiger, Malvern, PA. 240–264.
2. Yki-Järvinen, H. 1992. Glucose toxicity. Endocr. Rev. 13:415–431. 3. DeFronzo, R.A., R.C. Bonadonna, and E. Ferrannini. 1992. Pathogenesis of NIDDM. A balanced overview. Diabetes Care. 15:318–368.
4. Leahy, J.L. 1990. Natural history of b-cell dysfunction in NIDDM. Diabe-tes Care. 13:992–1010.
5. Robertson, R.P., L.K. Olson, and H.J. Zhang. 1994. Differentiating glu-cose toxicity from gluglu-cose desensitization: a new message from the insulin gene.
Diabetes. 43:1085–1089.
6. Robertson, R.P. 1989. Type II diabetes, glucose “non-sense,” and islet desensitization. Diabetes. 38:1501–1505.
7. Leahy, J.L., S. Bonner-Weir, and G.C. Weir. 1984. Abnormal glucose regulation of insulin secretion in models of reduced B-cell mass. Diabetes. 33: 667–673.
8. Leahy, J.L., H.E. Cooper, D.A. Deal, and G.C. Weir. 1986. Chronic hy-perglycemia is associated with impaired glucose influence on insulin secretion: a study in normal rats using chronic in vivo glucose infusions. J. Clin. Invest. 77: 908–915.
9. Bonner-Weir, S., D.F. Trent, and G.C. Weir. 1983. Partial pancreatec-tomy in the rat and subsequent defect in glucose-induced insulin release. J. Clin. Invest. 71:1544–1553.
10. Korsgren, O., J. Jansson, S. Sandler, and A. Andersson. 1990. Hypergly-cemia-induced B-cell toxicity. The fate of pancreatic islets transplanted into di-abetic mice is dependent on their genetic background. J. Clin. Invest. 86:2161– 2168.
11. Jansson, L., D.L. Eizirik, D.G. Pipeleers, L.A.H. Borg, C. Hellerström, and A. Andersson. 1995. Impairment of glucose-induced insulin secretion in human pancreatic islets transplanted to diabetic nude mice. J. Clin. Invest. 93: 721–726.
12. Bolaffi, J.L., L. Bruno, A. Heldt, and G.M. Grodsky. 1988 Characteris-tics of desensitization of insulin secretion in fully in vitro system. Endocrinol-ogy. 122:1801–1809.
[image:8.612.56.298.83.217.2]13. Davalli, A.M., A.E. Pontiroli, C. Socci, F. Bertuzzi, B. Fattor, S. Braghi,
Table III. Effect of Glucose Concentration during Culture on Glucose-inducible Insulin Release
Culture condition
Insulin release*
Basal Stimulated Total
fmol/103b cells/min fmol/103b cells/90 min
Glucose 6 mmol/liter 0.360.1 5.661.5 186644 Glucose 20 mmol/liter 0.660.2 1.360.3 92614‡
% cellular content/min
% cellular content/ 90 min
Glucose 6 mmol/liter 0.0160.003 0.2560.06 761 Glucose 20 mmol/liter 0.1160.03‡ 0.2860.05 1863‡
V. Di Carlo, and G. Pozza. 1992. Human islets chronically exposed in vitro to different stimuli become unresponsive to the same stimuli given acutely: evi-dence supporting specific desensitization rather than b-cell exhaustion. J. Clin. Endocrinol. & Metab. 74:790–794.
14. Eizirik, D.L., G.S. Korbutt, and C. Hellerström. 1992. Prolonged expo-sure of human pancreatic islets to high glucose concentrations in vitro impairs the b-cell function. J. Clin. Invest. 90:1263–1268.
15. Purrello, F., M. Vetri, C. Gatta, D. Gullo, and R. Vigneri. 1989. Effects of high glucose on insulin secretion by isolated rat islets and purified b-cells and possible role of glycosylation. Diabetes. 38:1417–1422.
16. Leahy, J.L., M. Bumbalo, and C. Chen. 1993. Beta cell hypersensitivity for glucose precedes loss of glucose-induced insulin secretion in 90% pancre-atectomized rats. Diabetologia. 36:1238–1244.
17. Thibault, C., C. Guettet, M.C. Laury, J.M. N’Guyen, T.A. Tormo, B. Portha, L. Pénicaud, and A. Ktorza. 1993. In vivo and vitro increased pancreatic beta-cell sensitivity to glucose in normal rats submitted to a 48-h hyperglycae-mic period. Diabetologia. 36:589–595.
18. Hoenig, M., L.C. MacGregor, and F.M. Matschinsky. 1986. In vitro ex-haustion of pancreatic b-cells. Am. J. Physiol. 250 (Endocrinol. Metab. 13): E502–E511.
19. Ling, Z., R. Kiekens, T. Mahler, F.C. Schuit, M. Pipeleers-Marichal, S. Abdullah, K. Gunther, W.L. Malaisse, and D.G. Pipeleers. 1996. Effects of chronically elevated glucose levels on the functional properties of rat pancreatic beta cells. Diabetes. In press.
20. De Vos, A., H. Heimberg, E. Quartier, P. Huypens, L. Bouwens, D. Pipeleers, and F. Schuit. 1996. Human and rat beta cells differ in glucose trans-porter but not in glucokinase gene expression. J. Clin. Invest. 96:2489–2495.
21. Pipeleers, D. 1992. Heterogeneity in pancreatic b-cell population. Dia-betes. 41:777–781.
22. Pipeleers, D., R. Kiekens, Z. Ling, A. Wilikens, and F. Schuit. 1994. Physiologic relevance of heterogeneity in pancreatic b cell population. Diabeto-logia. 37(Suppl. 2):S57–S64.
23. Schuit, F.C., P.A. In’t Veld, and D.G. Pipeleers. 1996. Glucose stimu-lated proinsulin biosynthesis by a dose-dependent recruitment of pancreatic beta cells. Proc. Natl. Acad. Sci. USA. 85:3865–3869.
24. Kiekens, R., P.A. In’t Veld, T. Mahler, F.C. Schuit, M. Van De Winkel,
and D.G. Pipeleers. 1991. Differences in glucose recognition by individual rat pancreatic B cells are associated with intercellular differences in glucose-induced biosynthetic activity. J. Clin. Invest. 89:117–125.
25. Warnock, G.L., D.K. Ellis, M. Cattral, D. Untch, N.M. Kneteman, and R.V. Rajotte. 1989. Viable purified islets of Langerhans from collagenase-per-fused human pancreas. Diabetes. 38(Suppl. 1):136–139.
26. Pipeleers, D.G., P.A. In’t Veld, M. Van De Winkel, E. Maes, F.C. Schuit, and W. Gepts. 1985. A new in vitro model for the study of pancreatic A and B cells. Endocrinology. 117:806–816.
27. Pipeleers, D.G., and M. Van De Winkel. 1986. Pancreatic B cells possess defense mechanism against cell-specific toxicity. Proc. Natl. Acad. Sci. USA. 83: 5267–5271.
28. Van Schravendijk, C., R. Kiekens, and D.G. Pipeleers. 1992. Pancreatic b cell heterogeneity in glucose-induced insulin secretion. J. Biol. Chem. 25: 21344–21348.
29. Ling, Z., and D.G. Pipeleers. 1994. Preservation of glucose-responsive islet beta cells during serum-free culture. Endocrinology. 134:2614–2621.
30. Hellman, B., E. Gylfe, P. Bergsten, E. Grapengiesser, P.E. Lund, A. Tengholm, D.G. Pipeleers, and Z. Ling. 1994. Glucose induces oscillatory Ca21
signalling and insulin release in human pancreatic beta cells. Diabetologia.
37(Suppl. 2):S11–S20.
31. Hansen, B.C., and N.L. Bodkin. 1990. b-cell hyperresponsiveness: earli-est event in the development of diabetes in monkeys. Am. J. Physiol. 259:R612– R617.
32. Andersson, A., J. Westman, and C. Hellerström. 1974. Effects of glu-cose on the ultrastructure and insulin biosynthesis of isolated mouse pancreatic islets maintained in tissue culture. Diabetologia. 10:743–753.
33. Liang, Y., H. Najafi, R.M. Smith, E.C. Zimmol/Lerman, M.A. Magnu-son, M. Tal, and F.M. Matschinsky. 1992. Concordant glucose induction of glu-cokinase, glucose usage, and glucose-stimulated insulin release in pancreatic is-lets maintained in organ culture. Diabetes. 41:792–806.
34. Purrello, F., M. Buscema, A.M. Rabuazzo, V. Caltabiano, F. Forte, C. Vinci, M. Vetri, and R. Vigneri. 1993. Glucose modulates glucose transporter affinity, glucokinase activity, and secretory response in rat pancreatic b-cells.

![Figure 3. Effect of glucose on the percent insulin-negative (insulin-positive (left) and right) cells with [3H]tyrosine incorporation](https://thumb-us.123doks.com/thumbv2/123dok_us/8220225.821517/5.612.57.299.55.256/figure-effect-glucose-percent-negative-positive-tyrosine-incorporation.webp)
![Figure 5. Effect of glucose upon [3H]tyrosine incorporation by human islet cells after 7 d of culture at 6 mmol/liter (a and b) or 20 mmol/liter glu-cose (c)](https://thumb-us.123doks.com/thumbv2/123dok_us/8220225.821517/6.612.59.562.61.229/figure-effect-glucose-tyrosine-incorporation-human-islet-culture.webp)