© 2017, IRJET | Impact Factor value: 5.181 | ISO 9001:2008 Certified Journal | Page 2649
Effect of TQM Practices on Financial Performance through Innovation
Performance - In Indian Manufacturing Context
Farish K A
1, Anu P Anil
2, Dr. Satish K P
31
M.Tech Student, Dept. of Production Engineering, GEC Trichur, Thrissur, Kerala, India
2PhD Research scholar Dept. of Mechanical Engineering, GEC Trichur, Thrissur, Kerala, India
3
Professor, Dept. of Production Engineering, GEC Trichur, Thrissur, Kerala, India
---***---Abstract -
Total quality management (TQM) is amanagement approach of an organization, centered on quality, based on the participation of all its members and aiming at long term success through customer satisfaction and benefits to all members in the organization and to society. This study examines the direct and indirect effects of TQM practices on financial and innovation performance by using structural equation modelling (SEM). Previous literatures described different results of the relationship between TQM practices and these two performance measures. Thus, the scope of this study is to investigate the relationship between the TQM practices and organization performance more precisely, Indian manufacturing context. The data was collected from a survey of 260 Indian manufacturing organizations using a self-structured detailed questionnaire. Based on review of TQM literatures, 13 TQM constructs were identified and selected for this study. From results of the survey, the data was analyzed and hypotheses were tested using SEM. Overall, findings of this study highlight that, TQM practices has a direct and significant effect on both financial performance and innovation performance. The results also shows that, there is an indirect and significant effect of TQM practices on financial performance through innovation performance. The study also revealed that supplier quality management, continuous improvement, quality information analysis, quality assurance and knowledge management were perceived as the most dominant TQM practices associated with both financial and innovation performance.
Key Words
:
Total quality management practices,
Financial performance, Innovation performance, Structural equation modelling, Supplier quality management, Quality assurance.
1. INTRODUCTION
Total Quality Management (TQM) is a system of managing quality in organizations in order to improve products and services. Crosby (1979) stated “QM is a logical way of ensuring that organized activities happen the way they are planned.”. It provides lasting solutions to the organizations plagued with problems of defects, high costs on account of rework and waste, and delayed delivery of products and
© 2017, IRJET | Impact Factor value: 5.181 | ISO 9001:2008 Certified Journal | Page 2650
manufacturing context, with the objective of bridging the gapand clearing up confusions.
2. LITERATURE REVIEW
2.1 Critical factors of TQM
Various studies have examined that; constitutes of quality management, common barriers to quality management implementation and factors are critical for the success of QM (Ahire et al., 1996; Flynn et al., 1994; Rao et al., 1999; Saraph et al., 1989; Sila, 2007; Yusof & Aspinwall, 2000). Although these studies have provided different results such as critical factors, they have identified a common set of practices considered essential to the success of quality management implementation. To generate distinct generic constructs, a list of constructs proposed in a large set of literature was analysed. The critical factors identified in the previous TQM literature are given below.
• Leadership and top management Commitment
• Supplier performance • Customer focus
• Supplier quality management • Continuous improvement • Team work
• Communication
• Quality improvement systems • Employees involvement • Employees empowerment • Rewards and recognition • Education and training • Strategic quality planning • Strategic management
• Quality information and analysis • Quality assurance
• SPC usage
• Quality citizenship • Quality culture • Benchmarking
• Role of quality department • Quality policy
• Process and product design • Quality management environment • Operational quality planning • Quality information availability • Process management
• Product quality and innovation • Quality information usage • Knowledge management
Through the thorough review of the TQM literatures, the present study identified a set of 13 TQM practices by frequency of occurrence method and it is shown in Table 1. These 13 factors selected for this study.
Table -1: Critical TQM factors identified for the present study
Sl No Critical factors selected for the present study 1 Leadership and top management commitment
(LTMC)
2 Customer focus (CF)
3 Supplier quality management (SQM) 4 Continuous improvement (CI) 5 Employees empowerment (EE) 6 Education and training (ET) 7 Quality information analysis (QIA) 8 Quality assurance (QA)
9 Quality citizenship (QCZ) 10 Quality culture (QC) 11 Process management (PM) 12 Product innovation (PI) 13 Knowledge management (KM)
2.2 Performance measure indicators
© 2017, IRJET | Impact Factor value: 5.181 | ISO 9001:2008 Certified Journal | Page 2651
3. RESEARCH FRAME WORK AND PROPOSED
HYPOTHESES
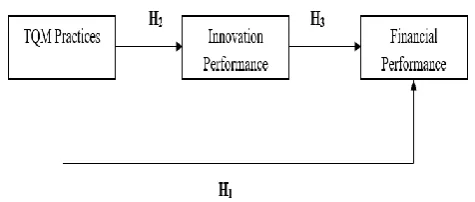
A review of the previous empirical studies on TQM practices suggests that researchers have defined TQM practices construct in various ways although they are complementary to each other. In this study, we decided to use one of these models or framework for the TQM practices construct. Based on the analysis of previous research, a conceptual research framework is developed and a research model has been proposed to examine the direct and indirect effect of TQM practices on company’s performance by measuring the financial and innovation performance as a performance indicators in the Indian manufacturing companies. The proposed TQM conceptual research frameworks are shown in Figure 1. This research models suggests that the greater the extent to which these TQM practices are present, the financial performance and innovation performance of Indian manufacturing organizations will be higher. In this framework, the independent variables are TQM practices and a dependent variables are financial and innovation performance. The two research questions of this study can be articulated as follows:
Do the identified TQM practices have direct and indirect effect on company’s financial and innovation performance?
Which TQM practices are more associated with the company’s financial and innovation performance?
Therefore aim of this study is to find out the direct and indirect effect of TQM practices on financial and innovation performance in Indian manufacturing companies and finding out which TQM practices are more associated with the company’s financial and innovation performance. Hence, in guiding the direction of the analysis, three research hypotheses were developed and will be tested in this research. They were based on the findings identified in the literature review.
H1: TQM practices have direct and positive effects on financial performance of Indian manufacturing organizations.
H2: TQM practices have direct and positive effects on innovation performance of Indian manufacturing organizations.
[image:3.595.319.557.103.204.2]H3: TQM practices have indirect and positive effects on financial performance through innovation performance of Indian manufacturing organizations.
Figure -1: Conceptual research framework
4. RESEARCH METHODOLOGY
In order to accomplish the objective of this research study, a questionnaire survey methodology was adopted and was carried out in selected Indian manufacturing organizations.
4.1 Survey instrument
Based on previous literatures (Salaheldin (2009), Bayraktar et al. (2008), Saravanan R and Rao, K.S.P. (2007), Sila and Ebrahimpour (2002), Antony et al. (2002) and Brah et al. (2000)) a self-structured detailed questionnaire was developed with the items for 13 TQM constructs along with the questions on performance measure and information about the respondents. Which includes questions that are capable of extracting maximum available data from the industries. The level of implementation is marked in a seven point likert scale, 1(Strongly disagree), 2 (Disagree), 3 (Somewhat disagree), 4 (Neutral), 5 (Somewhat agree), 6 (Agree), 7 (Strongly agree).
4.2 Data collection
© 2017, IRJET | Impact Factor value: 5.181 | ISO 9001:2008 Certified Journal | Page 2652
analyzed using IBM SPSS (20.0) statistics software and AMOS(20.0) software.
4.3 Data analysis and hypotheses test results
4.3.1 Reliability analysis
[image:4.595.321.541.129.191.2]Reliability is the ability of the instrument to measure consistently. Reliability coefficients were initially computed to check the internal consistency of the measuring items of the independent and dependent variables. As the internal consistency method is the most common form of reliability estimation (Nunnally, 1978) and it has been used in this study. This method assesses the equivalence, homogeneity and inter correlation of the items used in a measure. IBM SPSS Statistics software (version 20.0) is used for the evaluation of collected data. Reliability tests were performed separately for the items of each TQM practice (13 independent variables) and two dependent variables (financial performance and innovation performance). The Cronbach's alpha (α) values of the study variables are summarized in Table 2 and Table 3. One item from process management was deleted, so that it became reliable. Nunnally (1978) is often related with the assertion that instruments used in the basic research should have reliability of 0.7 or better.
Table -2: Reliability analysis of TQM practices
Sl
No TQM Practices items No of Cronbach's alpha (α)
1 LTMC 5 0.725
2 CF 4 0.811
3 SQM 5 0.922
4 CI 5 0.792
5 EE 4 0.853
6 ET 4 0.837
7 QIA 4 0.760
8 QA 5 0.900
9 QCZ 5 0.736
10 QC 5 0.765
11 PM 4 0.785
12 PI 5 0.772
[image:4.595.43.266.440.697.2]13 KM 3 0.898
Table -3: Reliability analysis of financial and innovation performances
Here final reliability analysis result shows that all the constructs have α > 0.7 (ranges from 0.725 to 0.922). So we can conclude that the data collection instrument i.e., the questionnaire developed were reliable.
4.3.2 Validity analysis
Validity is referred to how well our concept is defined by the measures. The concept of validity was formulated by Kelly (1927, p. 14) and who stated that a test is valid means if it measures what it claims to measure. The general purpose of checking validity is to find a way of minimizing the loss of information and summarizing these information into smaller sizes. There are mainly two types validity ; content validity and construct validity. Content validity is a subjective evaluation, which was considered suitable because these critical factors and results in the evaluation of quality management have been obtained from a literature review expert opinions. The main objective of the content validity is to ensure that the previous empirical issue must be extend by the selection of construct items, it also include theoretical and practical considerations (Robinson et al., 1991). In this study the 13 critical factors for measuring TQM implementation should have content validity, as the measurement items were developed based on both an comprehensive review of the literature and detailed evaluations by academicians and practicing managers. Although construct validity means the degree to which a measure or other test assesses the fundamental theoretical construct it is supposed to measure. The construct validity of each measure was evaluated through a factor analysis.
4.3.3 Factor analysis
Factor analysis is used for checking the validity of collected data. It is is a statistical approach that can be used to analyze the interrelationships among large number of variables and explain these variables in terms of their common underlying factors(Prasad et al., 2010). Factor structure of dependent and independent variables can be find out with the help of factor analysis with principal component by varimax rotation. For assessing the construct validity, factor loadings are obtained for each item. The loadings indicate the strength of the relationship between an item and a particular factor or practice. The higher the loading, the better the representation that particular item has on the factor. For this study, a loading of 0.40 or greater on the factor was considered (Hair et al., 1998; Arumugam et
Sl
No Performance Indicator items No of Cronbach's alpha (α)
1 IP 5 0.871
© 2017, IRJET | Impact Factor value: 5.181 | ISO 9001:2008 Certified Journal | Page 2653
al., 2008; Ooi et al., 2008). For the independent variable sincesome items were below 0.40 or are having collinearity with more than one factor. Hence it is continued to perform factor analysis and thereby removing the items one by one untill we get all the item have factor loading above 0.4. And totally 12 items relating to these factors were eliminated. Further, it was found that these 8 independent varibles explained 74.992 percent of total variance. The Kaiser-Meyer-Olkin (KMO) measure of sampling adequacy was 0.803 which is greater than 0.60 indicate there exist a sufficient intercorrelations while the Barlett's test of sphericity was significant (χ2=14127.378, p=0.000 <0.01). For dependent variables all items are higher factor loading and these two variables explaining 62.619 percent of variance in the data. Also KMO is 0.778 and Barlett's test of sphericity was significant (χ2= 1255.273, p=0.000 <0.01). Findings show that our sample is suitable for the hypothesis analyses.
4.3.4
Structural equation modelling (SEM)
It was proposed where the thirteen TQM practices were related against the two performance indicators (financial performance and innovation performance).
The purpose of SEM was to observe the combined effect of TQM practices on performance measures (Hair, Black, & Anderson, 2010). Instead of performing two individual multiple regression which would regress only one dependent variable of performance at a time, but by performing structural equation modelling we can observe altogether at the same time the combined effect of 13 TQM practices on the two dependent variables. Thereby determining systematic and statistically significant co variation between the constructs. The latent factors were created based on the combined effect of the 13 TQM practices and two performance measures. AMOS software was used to conduct analysis for SEM to examine the strength of the relationships between the model independent and dependent variables. Confirmatory modelling approach is employed to examine the relationships. The building of the SEM model was based on literature review documenting the 13 TQM practices related to the two performance measures. The structural equation modelling provided outcomes that assessed how well the model fitted the empirically collected data.
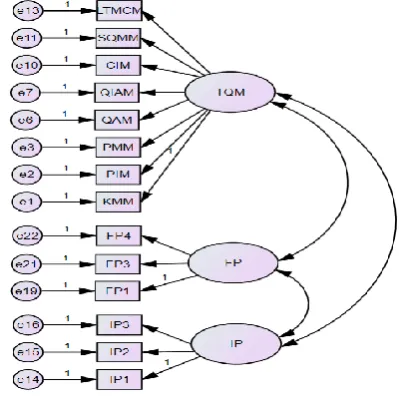
Before evaluating the structural equation model, the validity of the measurement model (as shown in fig 2) was tested. After estimating the measurement model for all factors without constraining the covariance matrix of the factors, the SEM for the factors together with the measurement models was estimated. At each step, whether or not the model fitted the data was assessed. This assessment of the model was done by examining the standard errors, by deleting, adding, and or modifying paths in the model (modification indices), then re tested using the same data set, and also examining t-values, p-values, a number of
goodness of fit statistics (CFI, GFI, RMSEA etc.). AMOS 20.0 software was used to test the measurement model. During the process, some practices namely, customer focus, employee empowerment, education and training, quality citizenship and quality culture is eliminated due to low loading.
Figure -2: Measurement model of the relationship between TQM practices and performance measures
The assumptions of multivariate analysis– normality, linearity, and homoscedasticity were tested for the variables used in the measurement model. The analysis of the assumptions of the multivariate model indicated there is no statistically significant violations exist. During the estimation of the measurement model for TQM practices and performance measures, an examination of the modification indices and standardised residuals revealed redundant items in some scales. These redundant items were eliminated, which resulted in better-fitted models. The results of the measurement model and structural model with the recommended values of the fit indices for the satisfactory fit of a model to data are shown in Table 4.
[image:5.595.330.530.183.385.2]
© 2017, IRJET | Impact Factor value: 5.181 | ISO 9001:2008 Certified Journal | Page 2654
For hypothesis testing, structural equation model wereproposed to observe the relationships between 13 TQM practices and two performance measures of Indian manufacturing organizations (as shown in fig 3). The primary purpose of this study was to identify the direct and indirect effects of TQM practices on the various dimensions of performances (financial and innovation). Through testing the hypothesised structural model, which was developed based on a comprehensive literature review, this purpose was accomplished. Parameter estimates including the factor loadings of TQM practices on the TQM construct, regression path coefficients for the structural paths, are shown in fig 3.
[image:6.595.309.557.134.215.2]
Figure -3: Structural equation model of the relationship between TQM practices and performances
[image:6.595.50.261.247.483.2]The goodness of fit statistics used to assess the fit of the data to the hypothesised model are the same as those used to test the measurement models and are presented in table 4. Also the table 5 shows, the hypotheses H1, H2 and H3 were significant at p <0.05 and all the paths in the model are supported. H1 and H2 significant, means TQM practices have direct and positive effects on financial performance and innovation performance of Indian manufacturing organizations. Similarly hypothesis H3 is significant, means there is an indirect effect on financial performance by TQM practices through innovation performance. Supplier quality management, continuous improvement, quality information analysis, quality assurance and knowledge management were found to contribute more on improvement of financial performance through the effect of innovation performance in Indian manufacturing organizations.
Table -5: Construct structural model (TQM on financial performance through innovation performance)
5. CONCLUSIONS
This paper has accomplished the stated objectives of the study successfully and analyzed the direct and indirect effect of TQM practices on financial and innovation performances in Indian manufacturing organizations. The study also revealed that supplier quality management, continuous improvement, quality information analysis, quality assurance and knowledge management were perceived as the most dominant TQM practices associated with both financial and innovation performances of Indian manufacturing organizations. The findings of this study suggest that these five practices of TQM should be explored to achieve high innovation performance and there by high financial benefits in Indian manufacturing companies. So they can improve their competitive position in global market. This study has also demonstrated that manufacturing companies in India believe total quality management is a key contributing factor to firm performance and survival.
ACKNOWLEDGEMENT
Gratitude goes to all the organizations and the employees of those organizations for their immense contribution towards this research.
REFERENCES
[1] Santos-Vijande M.L. and Alvarez-Gonzalez L.I., “Innovativeness and Organizational Innovation in Total Quality Oriented Firms: The Moderating Role of Market Turbulence”, Technovation, Vol. 27, 2007, pp. 514-532. [2] Prajogo D.I. and Sohal A.S., “Tqm and Innovation: A Literature Review and Research Framework” Technovation, Vol .21, 2001, pp. 539-558.
[3] Slater S.F. and Narver J.C., “Does Competitive Environment Moderate the Market Orientation Performance relationship?”, Journal of Marketing, Vol.58, 1994, pp. 46-55.
© 2017, IRJET | Impact Factor value: 5.181 | ISO 9001:2008 Certified Journal | Page 2655
[5] Ahire S.L., Golhar D.Y. and Waller M.A., “Developmentand validation of TQM implementation constructs”, Decision Sciences, Vol. 27, 1996, pp. 23–56.
[6] Flynn B.B., Schroeder R.G. and Sakakibara S., “A framework for quality management research and an associated measurement instrument”, Journal of Operations Management, Vol. 11, 1994, pp. 339–366. [7] Rao S.S., Solis L.E. and Raghunathan T.S., “A framework
for international quality management research: Development and validation of a measurement”, Total Quality Management, Vol. 10, 1999, pp. 1047–1075. [8] Sila I., “Examining the effects of contextual factors on
TQM and performance through the lens of organizational theories: An empirical study”, Journal of Operations Management, Vol. 25, 2007, pp. 83–109. [9] Yusof S.M. and Aspinwall E., “Critical success factors for
total quality management implementation in small and medium enterprises”, Total Quality Management, Vol. 10, 2000, pp. 803–809.
[10] Monge C.A.M., Rao S.S., Gonzalez M.E. and Sohal A.S., “Performance measurement of AMT: A cross-regional study”, Benchmarking: An International Journal, Vol. 13, 2006, pp. 135–146.
[11] Prajogo D.I. and Sohal A.S., “The multidimensionality of TQM practices in determining quality and innovation performance: An empirical examination”, Technovation, Vol. 24, 2004, pp. 443–453.
[12] Salaheldin S.I. and Mukhalalati B.A., “The implementation of TQM in the Qatari healthcare sector”, Journal of Accounting-Business and Management, Vol. 16 No. 2, 2009, pp. 1-14.
[13] Bayraktar E., Tatiglu E. and Zaim S., “An instrument for measuring the critical factor of TQM in Turkish higher education”, Total Quality Management and Business Excellence, Vol. 19 No. 6, 2008, pp. 551-74.
[14] Saravanan R. and Rao K.S.P., “The impact of total quality service age on quality and operational: an empirical study”, The TQM Magazine, Vol.19, No.3, 2007, pp. 197-205.
[15] Sila I. and Ebrahimpour M., “An investigation of the total quality management survey based research published between 1989 and 2000: a literature review”, International Journal of Quality and Reliability Management, Vol.19, No.7, 2002 , pp. 902-970.
[16] Brah S.A., Wong J.L. and Rao B.M., “TQM and business performance in the service sector: A Singapore study”, International Journal of Operations & Production Management, Vol. 20, 2000, pp. 1293–1314.
[17] Zakuan N.M., Yusof S.M., Laosirihongthong T. and Shaharoun A.M., “Proposed relationship of TQM and organizational performance using structured equation modeling”, Total Quality Management, Vol.21, No.2, 2010, pp.
[18] Nunnally, J.C., Psychometric Theory, second edition McGraw-Hill, New York, 1978.
[19] Kelley, T.L., Interpretation of educational measurements. New York: World Book Company, 1927.
[20] Arumugam V., Ooi K.-B., Teh P.-L. and Chong A. Y.-L., “TQM practices and its association with production workers”, Industrial Management and Data Systems, Vol. 108, No. 7, 2008, pp. 909-927.
[21] Anu P. Anil and Dr. Satish K. P., “Investigating the relationship between TQM practices and Firm’s performance: A conceptual framework for Indian organizations”, Elsevier Science Direct Procedia Technology , Vol. 24, 2016, pp. 555-561.
[22] Hair J.F. Jr, Anderson R.E., Tatham R.L. and Black W.C., Multivariate Data Analysis, 5th edition., Prentice-Hall, Englewood Cliffs, NJ, 1998.
[23] Durbin J. and Watson G.S., “Tests for serial correlation in least squares regression II”, Biometrika, Vol. 30, 1951, pp. 159-78.
[24] Ooi K.-B., Arumugam V., Safa M.S. and Bakar N.A. “HRM and TQM: association with job involvement”, Personnel Review, Vol. 36 No. 6, (2007a), pp. 939-62.
[25] Ooi K.-B., Cheah W.-C., Lin B. and Teh P.-L., “Total quality management practices and knowledge sharing: an empirical study of Malaysia’s manufacturing organizations”, Asia Pacific Journal of Management, Vol. 29 No. 1, 2012, pp. 59-78.
[26] Cohen, J., Statistical Power Analysis for the Behavioral Sciences, 2nd edition, Lawrence Erlbaum, Hillsdale, NJ, p. 1309, 1988.
[27] Sadikoglu E., “Total quality management practices and performance”, The Business Review, Cambridge, Vol.10, No.2, 2008, pp. 60- 68.
[28] Jitpaiboon T. and Rao, S.S., “A meta-analysis of quality measures in manufacturing system”, International Journal of Quality & Reliability Management, Vol. 24 No. 1, 2007, pp. 78-102.