Identification of Motor Imagery Movements from EEG
Signals Using Automatically Selected Features in the
Dual Tree Complex Wavelet Transform Domain
Syed Khairul Bashar
∗,
Mohammed Imamul Hassan Bhuiyan
Department of Electrical and Electronic Engineering, Bangladesh University of Engineering and Technology, Dhaka-1000, Bangladesh
Copyright c⃝2015 by authors, all rights reserved. Authors agree that this article remains permanently open access under the terms of the Creative Commons Attribution License 4.0 International License
Abstract
The decoding of human brain electrical func-tions by electroencephalogram (EEG) signal is the most important step in brain computer interface (BCI) based systems. So, in this paper, an automatic feature selection method has been proposed to classify imagery left and right hand movements from the EEG signals in the Dual Tree Complex Wavelet Transform domain. First, the EEG signals are decomposed into several bands of real and imaginary coefficients and then, some statistical features like Shannon entropy and variance have been calculated. These features are combined into a single feature space and after that optimal features have been selected automatically imposing some feature selection criteria from this combined feature space. The selected features have been shown to be promising to distinguish different kinds of EEG signals by statistical hypothesis testing (e.g., one way ANOVA) as well as graphical analysis (e.g., scatter plots, box plots). Finally, k-nearest neighbor based classifiers are developed using these selected features to identify left and right hand imagery movements. A mean accuracy of 90.00% is achieved in pub-licly available BCI competition II Graz motor imagery data set which is shown to be better than some existing techniques.Keywords
Electroencephalogram (EEG), ShannonEntropy, Dual Tree Complex Wavelet Transform, Feature Selection, kNN Classifier
1
Introduction
Brain computer interfacing (BCI) allows to control and op-erate computer aided systems by intent alone. The major ob-jective of BCI is to assist disable people for their rehabilita-tion. BCI involves detection, analysis and classification of different types of motor imagery movements to implement real time control and communication. Electroencephalogram (EEG) signals are often used for BCI purpose since it can be implemented as a non-invasive system [1]. Analysis of EEG signals to decode human brain activity is essential for the im-plementation of BCI systems.
There are several categories of EEG-based BCI such as limb motor imagery classification [2], continuous arm move-ments direction detection [3], individual finger movement de-coding [4], P300 evoked potential based character recogni-tion [5] etc. One major category of BCI is the detecrecogni-tion of motor imagery movements such as left and right hand move-ments. Various methods have been developed in the literature for classifying different types of arm movements. A wavelet-based common spatial pattern algorithm using low frequency features and Fisher linear discriminant classifier is developed to classify fast and slow hand movements in [6]. In [7], fil-ter bank common spatial patfil-tern is implemented with mutual information based feature selection and for the identification task, Naive Bayesian Parzen Window classifier is used. Wrist movement classification has been done by extracting gamma band features from wavelet packet transform and employing radial basis function classifier in [8]. Separability of EEG signals using adaptive auto regressive parameters is proposed in [9]. Time-frequency optimization is performed to clas-sify left and right hand movements with reduced electrodes in [10]. For utilizing cross-channel dependency in BCI, mul-tivariate empirical mode decomposition based classification method is presented in [11].
Hopfield neural network (FHNN) classifier in [17].
The aim of this study is to assist developing BCI sys-tems through identifying imagery hand movements by au-tomatically extracting suitable features from EEG signals in the dual tree complex wavelet transform (DTCWT) domain. DTCWT has been widely used for image and video process-ing ([18], [19]), and recently, it has been used in the area of bio-medical signals ([20], [21]). But to the best of our knowledge, the DTCWT is being employed for the first time in the classification of imagery hand movements in conjunc-tion with automatic feature selecconjunc-tion. Since motor imagery movements occur in the low frequency EEG bands [22], to perform detail analysis on specific bands, DTCWT has been used as it is a rich level analysis tool than traditional discrete wavelet transform (DWT). The product of Shannon entropy and signal variance obtained from the various DTCWT bands are used as features. The ability of this value in discriminat-ing imagery hand movements is demonstrated usdiscriminat-ing various types of scatter plots, box plots and one way ANOVA anal-ysis. An automatic selection method based onJ3 criteria is proposed for selecting the optimum feature vector. Left and right hand imagery movements are classified using these fea-tures employing a number of classifiers. The performance of these classifiers in detecting hand movements is obtained and compared with those of several existing techniques.
2
Description of the EEG database
The BCI competition II data set (motor imagery III) pro-vided by Technical University of Graz has been used in this paper. This data was acquired from a normal subject while the subject sat in a chair with armrests and was trying to con-trol a feedback bar by making imagery movements of left or right hands. Left and right cues were in random order [23].
0 1 2 3 4 5 6 7 8 9 sec
Trigger Beep
[image:2.595.353.507.49.204.2]Feedback period with Cue
Figure 1.Timing scheme of the experiment.
The experiment consists of 7 runs with 40 trials each. Dur-ing each trial at t=2s an acoustic stimulus indicates the be-ginning of the trial and a cross ‘+’ was displayed for 1s. Af-ter this an arrow (left or right) was displayed at t=3s as the cue. At the same time the subject was asked to move a bar into the direction of the cue which was controlled by adap-tive auto-regressive parameters of channel C3 and C4. The EEG signal was filtered between 0.5 and 30 Hz while the sampling rate was 128 Hz. A detail description of the exper-imental set up can be found in [24]. Fig. 1 shows the timing scheme of the experimental setup while Fig. 2 presents the electrode/channel positions.
3 2
3 2
1
C3 Cz C4
1
5
c
[image:2.595.63.293.487.636.2]m
Figure 2.Electrode positions.
3
Dual Tree Complex Wavelet
Trans-form
Dual tree complex wavelet transform is a recent enhance-ment to the discrete wavelet transform which has additional properties including nearly shift invariant and directionally selective in two and higher dimensions [25]. DTCWT is2d
times redundant for any d dimensional signal as compared to DWT and offers directional information in six directions. Thus is it more efficient in time frequency localization of EEG signal.
Similar to positive/negative post-filtering of real subband signals, the idea behind dual tree approach is quite simple. DTCWT employs two real DWTs where the first DWT gives the real part of the transform while the second DWT gives the imaginary part. The analysis filter bank structure used to implement DTCWT is given in Fig. 3. Two real wavelet transforms use two different sets of filters which satisfy per-fect reconstruction conditions. If square matricesHhandHg
denote the two real DWTs, then the DTCWT can be repre-sented as follows:
H=
[ Hh Hg ]
(1) The inverse transform ofHis given as,
H−1= 1 2 [
H−h1 H−g1 ]
(2) If the vectorxrepresents a real signal, thenwh =Hhx
rep-resents the real part andwg =Hgxrepresents the imaginary
part of the DTCWT.
h0(n)
h1(n) 2 2
h0(n)
h1(n) 2 2
h0(n)
h1(n) 2 2
h0(n)
h1(n) 2 2
g0(n)
g1(n) 2 2 g0(n)
g1(n) 2 2
g0(n)
g1(n) 2 2
g0(n)
g1(n) 2 2
x(n)
Figure 3.Analysis filter bank of DTCWT.
[image:2.595.313.551.613.749.2]Among several available wavelets, Farras wavelets [26] are used to perform DTCWT. Fig. 4 represents the EEG signals from C3 channel for left and right hand imagery movements and the corresponding second level DTCWT real and imagi-nary coefficients.
200 400 600
−0.10 0.1 0.2
(a)
200 400 600
−0.2 0 0.2
(b)
50 100 150
−0.05 0 0.05
(c)
50 100 150
−0.1 0 0.1
(d)
50 100 150
−0.1 −0.050 0.05
(e)
50 100 150
−0.1 −0.050 0.05
(f)
20 40 60 80
−0.10 0.1 0.2
(g)
20 40 60 80
−0.2 0 0.2
(h)
20 40 60 80
−0.2 0 0.2
(i)
20 40 60 80
−0.2 0 0.2 (j) A m pl it ude A m pl it ude A m pl it ude A m pl it ude A m pl it ude A m pl it ude A m pl it ude A m pl it ude A m pl it ude A m pl it ude
Samples Samples
Samples Samples
[image:3.595.48.280.126.353.2]Samples Samples Samples Samples Samples Samples
Figure 4.(a)-(b) EEG signal from C3 channels for left and right hand move-ment; (c)-(d) real coefficients of level 1 for left and right movements respec-tively; (e)-(f) imaginary coef. of level 1 for left and right; (g)-(h) real coef. of level 2 for left and right; (i)-(j) imaginary coef. of level 2 for left and right imagery movements.
4
Analysis in Dual Tree Complex
Wavelet Transform Domain
The proposed method consists of first decomposing the EEG signal of each trial with dual tree complex wavelet transform into three levels and then extracting suitable fea-tures from different bands. After extracting suitable feafea-tures, optimal features are selected automatically usingJ3criteria and finally kNN classifier is deployed for classifying hand movements.
4.1
Feature Extraction in DTCWT DomainSince BCI competition II Graz data set was recorded with low pass filtering of 30 Hz, no preprocessing was needed to discard the unnecessary high frequency components. As discussed in [22], motor imagery activity occurs in low fre-quency EEG band signal. So to have in-depth view, wavelet transform is applied to the acquired EEG signal. Since for-ward transform of DTCWT gives two branches containing real and imaginary coefficients, it gives a rich way of analyz-ing EEG signals than DWT. The experiment was carried out by taking feedback from C3 and C4 channel while making Cz the reference. As a result, by applying DTCWT, EEG signal acquired from both C3 and C4 channel for a single trial is de-composed into three levels. If the original low passed signal is denoted by X which has 0.5 to 30 Hz frequency compo-nents, after first level decomposition, it providesY1 (16-30 Hz) andZ1(0.5-15 Hz). After second level decomposition,
Z1leads toY2(7.5-15 Hz) andZ2(0.5-7.5 Hz). So after three
levels of DTCWT, the four frequency parts areY1(16-30 Hz),
Y2(7.5-15 Hz),Y3(3.75-7.5 Hz) andZ3(0.5-3.75 Hz). Recon-structions of these components using the inverse DTCWT ap-proximately correspond to the physiological EEG sub-bands delta, theta, alpha and beta respectively [27]. Since each fre-quency band gives both real and imaginary coefficients, we have total 4 real and 4 imaginary coefficient bands for each channel. From now on, the real and imaginary bands and as-sociated levels will be denoted asRBxandIBxwhere ‘x’ is
the level index.
The underlying dynamics of EEG signals is spread over various sub-bands in the frequency domain. To classify mo-tor imagery movements, we need to extract more information in lower frequency bands of EEG signals and mu rhythms [15]. For this purpose, variance and Shannon entropy in dif-ferent bands have been extracted as features.
4.1.1 Variance
Variance of a distribution is a measure of how widely val-ues are dispersed from the average or mean value. It is the average squared distance between the mean and each item in the distribution. Variance is denoted byσ2whereσis defined as:
σ= √∑
(xi−x¯)2
N (3)
whereN is the number of data points in a distribution,xiis
theith sample of the distribution,x¯is the mean ofNsamples.
4.1.2 Shannon Entropy
Entropy is a measure of randomness which is a common concept in signal processing. Wavelet entropy can provide useful information about the underlying dynamical process associated with the signal [28]. The entropy Emust be an additive cost function such that E(0) = 0 and E(S) = ∑
i
E(Si), whereSis the signal. In our study most common
Shannon entropy has been used.
The Shannon entropy is defined as [29]
E(S) =−∑
i
Si2log(Si2) (4)
whereSi are the coefficients of signalS in an orthonormal
basis.
4.2
Automatic Feature SelectionSince the four level DTCWT of the EEG signal leads to eight coefficient bands for each channel, a total of 16 features are available from two channels. But how can we select the best feature combination? To combat this problem, we have usedJ3criteria [30] for selecting optimum feature combina-tion.J3is a cost function for class separability measurement defined as
J3=trace{S−w1Sm} (5)
HereSwis the within class scatter matrix andSmis the
mix-ture scatter matrix defined as
Sw= M
∑
i=1
PiSi
Sm=E[(x−µµµ0)(x−µµµ0)T]
(6)
where, Pi is the priori probability of ith class,M denotes
total class number and Si is the corresponding co-variance
matrix given by
Si=E[(x−µµµi)(x−µµµi)T] (7)
whereµµµi is the mean of each class whileµµµ0 is the global mean. These two means are related by
µ µ µ0=
M
∑
i=1
Piµµµi (8)
Sometimes between class scatter matrixSbis used instead
of Sm in (5). For M class problem, between class scatter
matrix can be calculated as
Sb= M
∑
i=1
Pi(µµµi−µµµ0)(µµµi−µµµ0)T (9)
J3criteria has the advantage that it is invariant under linear transform [31]. For a feature vector with a particular number of features, the feature elements yielding maximum value of
J3 are selected as the elements of the optimal feature vec-tor. Here from available 16 features, 4 optimal features have been chosen automatically. The four features found usingJ3 criteria areRB3(C3), RB4(C3), RB2(C4)andIB3(C4)
Table 1.Results of ANOVA Analysis
Features P-value from ANOVA
RB3(C3) 2.4635e-16
RB4(C3) 6.7988e-32
RB2(C4) 3.9746e-04
IB3(C4) 2.0261e-04
Table 1 shows the best possible features for a 4 element feature vector selected via the J3 criterion and the corre-sponding p-values of one way ANOVA analysis. The hy-pothesis about the p-values is that the value, p<0.05 indi-cates that at least one sample mean is significantly different than the other sample means statistically [32]. From Table 1, it is clear that these four features have very small p-values which indicates they can be used as good features.
Apart from one way ANOVA analysis, scatter plots and box plots are provided to further illustrate the classification quality of the features. Fig. 5 represents the scatter plots of
0 10 20 30 40 50 60 70
0 0.2 0.4 0.6
(a) Trial index
A
m
pl
it
ude
Left Right
0 10 20 30 40 50 60 70
0 0.05 0.1
A
m
pl
it
ude
Left Right
[image:4.595.300.562.53.232.2](b) Trial index
Figure 5.(a)-(b) Scatter plots ofRB3andRB4during left and right hand imagery movements respectively for in C3 channel.
0 10 20 30 40 50 60 70
0 0.005 0.01 0.015 0.02
(a) Trial index
A
m
pl
it
ude
Left Right
0 10 20 30 40 50 60 70
0 0.1 0.2 0.3 0.4
(b) Trial index
A
m
pl
it
ude
Left Right
Figure 6. (a)-(b) Scatter plots ofRB2andIB3during left and right hand imagery movements respectively for in C3 channel.
RB3 andRB4for C3 channel, respectively whereas Fig. 6 presents the scatter plots ofRB2andIB3for C4 channel, re-spectively. In Fig. 5 and Fig. 6, green hexagon and red square markers indicate feature values during left and right hand im-agery movements respectively. The green and red markers have significantly different values indicating their variation during different imagery hand movements which states that they can be used as good features.
Fig. 7-10 present the box plots of RB3(C3),RB4(C3),
RB2(C4)andIB3(C4)respectively for left and right hand imagery movements. The box plots indicate that the features have distinct values for the two specific movements and as a result they can be used in classifiers.
The scatter plots, box plots and the p-values of one way ANOVA indicates thatRB3(C3),RB4(C3),RB2(C4)and
[image:4.595.313.563.283.458.2]0 0.1 0.2 0.3 0.4 0.5 0.6
[image:5.595.48.278.50.226.2]Left hand Right hand
Figure 7.Boxplot ofRB3(C3)for left and right hand imagery movements respectively.
0 0.01 0.02 0.03 0.04 0.05 0.06 0.07 0.08 0.09
Left hand Right hand
Figure 8.Boxplot ofRB4(C3)for left and right hand imagery movements respectively.
4.3
Classification Using kNN Classifierk-Nearest Neighbors algorithm (kNN) is a non-parametric learning algorithm method used for classification. Among the various methods of supervised statistical pattern recog-nition, the Nearest Neighbor rule achieves consistently high performance, without a priori assumptions about the distribu-tions from which the training examples are drawn [33].
In order to classify a sample trial vectorX which has un-known class, kNN classifier ranks the sample trial’s neigh-bors among the training trial vectors and uses the class labels of the k most similar neighbors to predict the class of the new test trial [34]. The classes of these neighbors are then weighted according to the similarity of each neighbor where the similarity index is the cosine value between two docu-ment vectors of Euclidean distance. The cosine similarity index is defined as
sim(X, Dj) =
∑
ti∈(X∩Dj)xi×dij ||X||2× ||Dj||2
(10) whereXis the test or unknown trial;Djis the j-th training
trial;tiis shared by bothX andDj;dij is the weight forti
in training sampleDj whereasxiis the weight forti inX.
Thel2norm ofXis defined as
||X||2=
√
x2
1+x22+x23+... (11) The number “K”decides how many neighbors influence
0 0.002 0.004 0.006 0.008 0.01 0.012 0.014 0.016 0.018 0.02
[image:5.595.303.533.51.219.2]Left hand Right hand
Figure 9.Boxplot ofRB2(C4)for left and right hand imagery movements respectively.
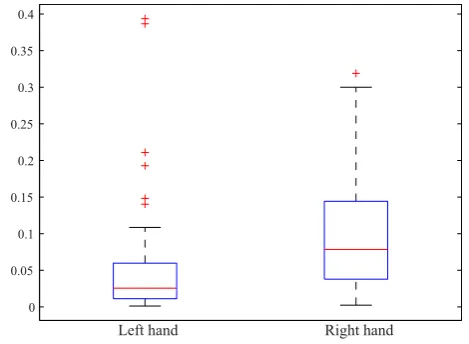
0 0.05 0.1 0.15 0.2 0.25 0.3 0.35 0.4
Left hand Right hand
Figure 10.Boxplot ofIB3(C4)for left and right hand imagery movements respectively.
the classification. If k = 1, then the algorithm is simply called the nearest neighbor algorithm.
5
Experimental Results
The EEG data set has 140 trials each for left and right hand (total 280 trials) of 9 seconds length. Since the cue was given at t=3 sec, data segment after 3 seconds from C3 and C4 channels are used for classification. Only four features have been used to form the final feature vector. The train and test feature matrix has dimension of 140×4 which is fed to kNN classifier. The experiment was carried out using MATLAB 2013b [32] on Windows-7 32 bit platform having 1 GB RAM and 2.93 GHz Intel Core 2 Duo processor. Both training and testing data sets have been used in leave one out cross vali-dation method. The accuracy has been calculated using the following equation:
Accuracy= Correctly classif ied EEG epochs
T otal EEG epochs ×100%
[image:5.595.299.534.258.430.2] [image:5.595.48.279.260.434.2]6 and 7 elements, respectively (If the same accuracy occurs, only the lowest “K” value is selected). The distance param-eter of the kNN classifier is selected as Euclidean distance [32].
2 4 6 8 10 12 14 16 18 20
0.85 0.86 0.87 0.88 0.89 0.9 0.91
“K” values
M
ea
n A
cc
ura
cy (%)
[image:6.595.58.304.109.256.2]4 features 5 features 6 features 7 features
Figure 11. Mean accuracy(%) vs different “K” values for various feature vector lengths.
Table 2 presents the feature elements and the correspond-ing best mean accuracy values of different feature combina-tions found by J3 feature selection approach. If only two features are selected usingJ3 criteria then the accuracy is very satisfying 87.86% which indicates that the combined feature space has significant distinguishable property for left and right hand imagery movements. When total number of selected features are 3, 4 and 5, then the mean accuracy is highest 90%. We have used four features for final compar-isons (3 or 5 features can also be used similarly).
Table 2.Outcome ofJ3Criteria for Different Feature Combinations
Selected Feature Numbers
Selected Features
Mean Accuracy
(%) 2 RB3(C3),IB3(C4) 87.86 3 RB3(C3),RB4(C3),IB3(C4) 90.00
4 RB3RB2((CC3)4),RB4(C3),
,IB3(C4) 90.00
5 RB3(CIB33),(RB4C4)(C3),RB2(C4),
,RB4(C4) 90.00
6 RB3RB2((CC3)4),RB4(C3),RB2(C4),
,IB3(C4),RB4(C4) 89.64
7
RB1(C3),RB3(C3),RB4(C3),
IB4(C3),RB1(C4),IB3(C4),
RB4(C4)
[image:6.595.326.535.172.430.2]89.64
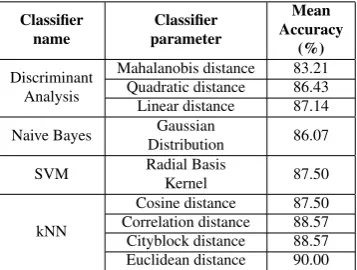
Table 3.Performance Evaluation of Different Classifiers
Classifier name
Classifier parameter
Mean Accuracy
(%)
Discriminant Analysis
Mahalanobis distance 83.21 Quadratic distance 86.43 Linear distance 87.14
Naive Bayes Gaussian
Distribution 86.07
SVM Radial Basis
Kernel 87.50
kNN
Cosine distance 87.50 Correlation distance 88.57 Cityblock distance 88.57 Euclidean distance 90.00
Table 3 provides the performance evaluation of different clas-sifiers with varying parameters which indicates that kNN
classifier with Euclidean distance gives better accuracy than others.
Finally Table 4 compares the mean accuracy of the pro-posed method with several other methods. It can easily be concluded that using simple kNN classifier, our method pro-vides good mean accuracy to classify left and right hand mo-tor imagery movements than all the methods listed in table 4.
Table 4.Comparison of Mean Accuracy
Method Proposed
By Classifier
Mean Accuracy
(%)
PSD
Solhjoo et al. [12]
Mahalanobis
distance 63.1 Gaussian
classifiers 65.4 LDA 65.6
Raw EEG
Solhjoo et al. [13]
HMM 77.5
AAR
Tavakolian et al. [14]
Bayes
Quadratic 82.86 BGN 83.57 MLP 84.29
Morlet wavelet
Lemm et al. [15]
Bayes
Quadratic 89.29
Wavelet based features
Q. Xu et al. [16]
FSVM 87.86
Discriminative area selection
W. Hsu
[17] FHNN 83.10 Proposed
method (DTCWT)
kNN 90.00
One may ask about the gain in performance achieved due to the use ofJ3 criterion. Table 5 provides the mean accu-racy values obtained by using 4 element feature vectors with various combinations of the elements. It also shows the mean accuracy obtained by using the feature vector whose elements are automatically selected by theJ3criterion. From Table 5, it is clear that the mean accuracy obtained by usingJ3 selec-tion criterion is significantly higher than other combinaselec-tions listed in the table and thus justifying the use ofJ3criterion.
Table 5.Mean Accuracy for Different Feature Combinations
Selected Features Mean Accuracy (%)
RB1(C3),IB1(C3),RB2(C4),IB2(C4) 63.57
RB1(C4),IB1(C4),RB2(C3),IB2(C3) 77.14
RB2(C3),IB2(C3),RB3(C3),IB3(C3) 76.43
RB2(C4),IB2(C4),RB3(C4),IB3(C4) 71.43
RB2(C3),IB2(C3),RB3(C4),IB3(C4) 74.64
RB2(C4),IB2(C4),RB3(C3),IB3(C3) 78.21
RB1(C3),IB1(C3),RB1(C4),IB1(C4) 75.36
RB2(C3),IB2(C3),RB2(C4),IB2(C4) 83.93
RB3(C3),IB3(C3),RB3(C4),IB3(C4) 87.14
RB4(C3),IB4(C3),RB4(C4),IB4(C4) 76.07 4 features fromJ3criterion 90.00
[image:6.595.88.267.632.767.2]responsi-ble for motor movements in neuro-physiological context. As a result, level 2 and 3 features perform relatively better in the hand movement classification problem. It can also be inferred from Table 1 that p-values of the selected features are much smaller for C3 channel than C4 and as a result, C3 channel may perform better than C4. Future works can be done to find more about the performance of individual chan-nels to have further specific information about EEG dynam-ics. Also, feature selection criteria may be improved incor-porating other between class inherent property of the selected features like orthogonality and mutual information.
6
Conclusions
In this paper a comprehensive method has been proposed to distinguish the left and right hand motor imagery move-ments which offers a promising support for an important ap-plication in BCI. EEG signals have been successfully clas-sified by extracting features from a combined space formed by variance and Shannon entropy of EEG signals in the dual tree complex wavelet transform domain. Optimal combina-tion of features have been selected automatically usingJ3 criteria and justification of using these features has been pro-vided with a number of scatter plots, box plots and one-way ANOVA analysis. Among various types of classifiers like SVM, kNN, Bayes classifier and LDA, kNN provides the highest accuracy of 90.00%. Finally the performance has been compared with several other recent methods available in EEG based BCI literature and shown to be superior to the others.
REFERENCES
[1] Nicolas-Alonso, L.F.; Gomez-Gil, J. Brain computer inter-faces, a review, Sensors 2012, 12, 1211-1279.
[2] Yi, W.; Qiu, S.; Qi, H.; Zhang, L.; Wan, B.; Ming, D. EEG feature comparison and classification of simple and com-pound limb motor imagery, J. Neuroeng. Rehabil 2013, 10.
[3] Woo, J.S.; Muller, K.R.; Lee, S.W. Classifying directions in continuous arm movement from EEG signals, Brain-Computer Interface (BCI), 2015 3rd International Winter Conference on. IEEE, 2015, pp. 1-2.
[4] Liao, K.; Xiao, R.; Gonzalez, J.; Ding, L. Decoding individual finger movements from one hand using human EEG signals, PLoS ONE 2014, 9.
[5] Chen, Szi-Wen, and Yeh-Chi Lai. “A signal-processing-based technique for P300 evoked potential detection with the ap-plications into automated character recognition.” EURASIP Journal on Advances in Signal Processing 2014, no. 1 (2014): 1-10.
[6] Robinson, N.; Vinod, A.P.; Ang, K.K.; Tee, K.P.; Guan, C.T. EEG-based classification of fast and slow hand movements using wavelet-CSP algorithm, Biomedical Engineering, IEEE Transactions on 2013, 60, 2123-2132.
[7] Ang, K.K.; Chin, Z.Y.; Wang, C.; Guan, C.; Zhang, H. Filter bank common spatial pattern algorithm on BCI competition IV datasets 2a and 2b, Frontiers in Neuroscience 2012, 6.
[8] Khan, Y.U.; Sepulveda, F. Brain-computer interface for single-trial EEG classification for wrist movement imagery using spatial filtering in the gamma band, IET signal process-ing 2010, 4, 510-517.
[9] Neuper, C.; Schlogl, A.; Pfurtscheller, G. Enhancement of left-right sensorimotor EEG differences during feedback-regulated motor imagery, Journal of Clinical Neurophysiol-ogy 1999, 16, 373-382.
[10] Yang, Yuan, Sylvain Chevallier, Joe Wiart, and Isabelle Bloch. “Time-frequency optimization for discrimination be-tween imagination of right and left hand movements based on two bipolar electroencephalography channels.” EURASIP Journal on Advances in Signal Processing 2014, no. 1 (2014): 1-18.
[11] Park, Cheolsoo, David Looney, Alireza Ahrabian, and Danilo P. Mandic. “Classification of motor imagery BCI using multi-variate empirical mode decomposition.” Neural Systems and Rehabilitation Engineering, IEEE Transactions on 21, no. 1 (2013): 10-22.
[12] Solhjoo, S.; Moradi, M. Mental task recognition: A compar-ison between some of classification methods, BIOSIGNAL 2004 International EURASIP Conference, 2004, pp. 24-26.
[13] Solhjoo, S.; Nasrabadi, A.M.; Golpayegani,M.R.H. Classi-fication of chaotic signals using HMM classifiers: EEG-based mental task classification, Signal Processing Confer-ence, 2005 13th European. IEEE, 2005, pp. 1-4.
[14] Tavakolian, K.; Vasefi, F.; Naziripour, K.; Rezaei, S. Men-tal task classification for brain computer interface applica-tions, Canadian Student Conference on Biomedical Comput-ing, 2006.
[15] Lemm, S.; Schafer, C.; Curio, G. BCI competition 2003-data
set III: probabilistic modeling of sensorimotorµrhythms for
classification of imaginary hand movements, Biomedical En-gineering, IEEE Transactions on 2004, 51, 1077-1080.
[16] Xu, Q.; Zhou, H.; Wang, Y.; Huang, J. Fuzzy support vector machine for classification of EEG signals using wavelet-based features, Medical engineering & physics 2009, 31, 858-865.
[17] Hsu, W.Y. Brain-computer interface: The next frontier of telemedicine in human computer 251 interaction, Telematics and Informatics 2015, 32, 180-192.
[18] Shi, F.; Selesnick, I.W. Video denoising using oriented com-plex wavelet transforms, Acoustics, Speech, and Signal Pro-cessing, 2004. Proceedings.(ICASSP’04). IEEE International Conference on. IEEE, 2004, Vol. 2, pp. ii-949.
[19] Rahman, S.M.; Ahmad, M.O.; Swamy, M. Video denois-ing based on inter-frame statistical modeldenois-ing of wavelet co-efficients, Circuits and Systems for Video Technology, IEEE Transactions on 2007, 17, 187-198.
[20] Das, A.B.; Bhuiyan, M.I.H.; Alam, S.S. Classification of EEG signals using normal inverse Gaussian parameters in the dual-tree complex wavelet transform domain for seizure detection, Signal, Image and Video Processing 2014, pp. 1-8.
[21] Yang, H.; Guan, C.; Ang, K.K.; Wang, C.C.; Phua, K.S.; Yu, J. Dynamic initiation and dual-tree complex wavelet feature-based classification of motor imagery of swallow EEG sig-nals. Neural Networks (IJCNN), The 2012 International Joint Conference on. IEEE, 2012, pp. 1-6.
[23] Pfurtscheller, G.; Neuper, C.; Schlogl, A.; Lugger, K. Sepa-rability of EEG signals recorded during right and left motor imagery using adaptive autoregressive parameters, Rehabili-tation Engineering, IEEE Transactions on 1998, 6, 316-325.
[24] Graz description of data set III of BCI-competition 2003, Available online: http:// www.bbci.de /competition/ii/ (ac-cessed on 15-06-2015).
[25] Selesnick, I.W.; Baraniuk, R.G.; Kingsbury, N.G. The dual-tree complex wavelet transform, Signal Processing Magazine, IEEE 2005, 22, 123-151.
[26] Wavelet Software. Available online:
http://eeweb.poly.edu/iselesni/WaveletSoftware/ (accessed on 21-06-2015).
[27] Adeli, H.; Ghosh-Dastidar, S.; Dadmehr, N. A wavelet-chaos methodology for analysis of EEGs and EEG subbands to detect seizure and epilepsy, Biomedical Engineering, IEEE Transactions on 2007, 54, 205-211.
[28] Rosso, O.A.; Blanco, S.; Yordanova, J.; Kolev, V.; Figliola, A.; Schurmann, M.; Basar, E.Wavelet entropy: a new tool for analysis of short duration brain electrical signals, Journal of neuroscience methods 2001, 105, 65-75.
[29] Wang, D.; Miao, D.; Xie, C. Best basis-based wavelet packet entropy feature extraction and hierarchical EEG classifica-tion for epileptic detecclassifica-tion, Expert Systems with Applicaclassifica-tions 2011, 38, 14314-14320.
[30] Coelho, L.P.; Braga, D.; Dias, M.S.; Garcia-Mateo, C. An Au-tomatic Voice Pleasantness 281 Classification System Based on Prosodic and Acoustic Patterns of Voice Preference, 282 INTERSPEECH 2011, pp. 2457-2460.
[31] Theodoridis, S.; Koutroumbas, K. Pattern Recognition, fourth ed.; Academic Press Elsevier: Boston, 2009.
[32] MATLAB. Available online:
http://www.mathworks.com/products/matlab/ (accessed
on 25-06-2015).
[33] Islam, M.J.; Wu, Q.J.; Ahmadi, M.; Sid-Ahmed, M.; oth-ers. Investigating the performance of naive-bayes classifiers and k-nearest neighbor classifiers, Convergence Information Technology 2007. International Conference on. IEEE, 2007, pp. 1541-1546.