S. S. Sonawane
Research Scholar College of Engineering, PuneUniversity of Pune (India)
Dr. P. A. Kulkarni
Adjunct Professor College of Engineering, PuneUniversity of Pune (India)
ABSTRACT
A common and standard approach to model text document is bag-of-words. This model is suitable for capturing word frequency, however structural and semantic information is ignored. Graph representation is mathematical constructs and can model relationship and structural information effectively. A text can appropriately represented as Graph using vertex as feature term and edge relation can be significant relation between the feature terms. Text representation using Graph model provides computations related to various operations like term weight, ranking which is helpful in many applications in information retrieval.
This paper presents a systematic survey of existing work on Graph based representation of text and also focused on Graph based analysis of text document for different operations in information retrieval. In this process taxonomy of Graph based representation and analysis of text document is derived and result of different methods of Graph based text representation and analysis are discussed. The survey results shows that Graph based representation is appropriate way of representing text document and improved result of analysis over traditional model for different text applications.
General Terms:
Graph, Graph based methods, Text analysis.
Keywords:
Information Retrieval, Graph Theory, Natural Language Processing.
1. INTRODUCTION
Nowadays text is the most common form of storing the information. The representation of document is important step in the process of text mining. Hence, the challenging task is the appropriate representation of the textual information which will capable of representing the semantic information of the text. Traditional models like vector space model consider numerical feature vectors in a Euclidean space. Because of its simplicity vector space model [1] has following disadvantages
(1) The meaning of a text and structure cannot expressed
(2) Each word is independent from other, word appearance sequence or other relations cannot be represented.
(3) If two documents have similar meaning but they are of different words, similarity cannot computed easily
The words are organized into sections, paragraphs, sentences and clauses to define the meaning of document. Hence relationship between different components of document, their ordering and position are important to understand document in detail.
Graph-based text representation model [1] is known as one of best solution for these problems. Graph representation is mathematical constructs and can model relationship and structural information effectively. Graph representation of text document is powerful because it can helpful in most of operations in text such as topological, relational, statistical etc. In this paper various methods on modeling of text document using Graph are presented. This paper also surveys different Graph based analysis methods of text document.
The organization of the paper is as follow: Section 2 describes the document model as Graph . Various methods of text document representation using Graph are reviewed in section 3 with detail analysis. Section 4 list analysis of text document using Graph topological properties where different properties are studied and detailed analysis is presented . Conclusion and Future work is given in section 5.
2. DOCUMENT AS GRAPH
Document is models as Graph where term represented by vertices and relation between terms is represented by edges.
G={V ertex, EdgeRelation}
There are generally five different types of vertices in the Graph representation
V ertex = {F, S, P, D, C} Where F − F eatureterm, S −
Sentence, P−P aragraph, D−Document, C−Concept
F={t1, t2, t3, ..., tn}
S=Pn i=0ti
P =Pn i=0si
D=Pn
i=0pi
Fig. 1. Sample document reprinted from [2]
EdgeRelation={Syntax, Statistical, Semantic}
Edge relation between two feature terms may different on the context of Graph.
(1) Word occurrence together in a sentence or paragraph or section or document
(2) Common words in a sentence or paragraph or section or document
(3) Co-occurrence on the fixed window of n words
(4) Semantic relation - Words have similar meaning ,words spelled same way but have different meaning ,opposite words
Bag-of-words approach is not suitable technique to capture term importance. Relationship between texts can be preserved by maintaining the structural representation of the context will definitely lead to a better operation such as term weighting scheme.
3. GRAPH REPRESENTATION OF TEXT
Text document can be represented as a Graph in many ways. Nodes denote features and edge represent relationship between nodes. Fig 3 shows different methods of Graph representation of text document.
3.1 Co-occurrence Graph
There are several approaches to construct a Graph based on the co-occurrence of the words in the document.
In [2] Syntactic filters are avoided and individual feature is considered in constructing Graph. If term is new in text then a node is added to the Graph. An undirected edge is added if they co-occur within a certain window size. Fig.2 shows the Graph constructed of sample document Fig 1 assuming window size 2.
Sentence connected if near or sharing common word. [3] proposed an algorithm for sentence as vertex and sentences are connected if they near to each other or share at least one common keyword. Small world topology is analyzed. Consecutive sentences in text documentS1, S2, ..Snrepresented as vertex set of Graph. Edge is added for every consecutive sentence(Si, Si+ 1). If two sentences share at least one word it can connect using an edge.
[4, 5] and [6] proposed keyword as vertex and connected by an edge if occurrence together in the window if fixed slide over the stream of tokens.
The Collocation relationship between words [7] is the occurrence of two or more words within a well-defined unit of information is (sentence, document). For the selection of meaningful and significant collocations, consider a, b be the number of sentences containing A and B , k be the number of sentences containing both A and B , and n be the total number of sentences. Significance measure depends on the probability of joint occurrence of rare events.
[image:2.595.322.548.75.288.2]Spectral method is used in [8] in which syntactic relationship between words is considered. [9] Used a statistical method to find
Fig. 2. Sample Graph reprinted from [2] drawn of sample document shown in fig 1
the frequent words. [10] Proposed a Graph representation based to syntactic relation between words.
[11] Represent weighted Graph as text document where feature term as nodes, edge shows the relationship between node in a unit and weight measure of strength of relationship. A minimum length of a sentence as a unit is selected to measure the co-occurrence information of feature terms instead of a whole paragraph as the unit to avoid larger Graph with loss of mutual information of feature terms.
The formula used for computing the strength of the relationship is
Wij=
f req(ti,tj)
f req(ti)+f req(tj)−f req(ti,tj)
whereW ijdenote weight betweenniandnj.f req(ti)shows the
number of timesti and tj occur together in the unit. f req(ti)
and f req(tj) denote frequency of ti and tj appearing in di
respectively. HighWijdenote strong link else weak link.
TextRank [12] extracted the representative word from text document. These words represent as vertices. Un-directed Edges between two vertices is computed using co-occurrence relation on the basis of distance between word occurrences such that two vertices are connected if their corresponding lexical units co-occurs within a window of Maximum words can be 2 to 10 words. Directed Graph also created using this approach where a direction was set following the natural flow of the text in forward and backward direction.
co-occur window Size=2
Undirect 6,715 13.4 1,897 3.8 28.2 38.6 32.6 co-occur
window Size=3
Undirect 6,558 13.1 1,851 3.7 28.2 37.7 32.2 co-occur
window Size=5
Undirect 6,570 13.1 1,846 3.7 28.1 37.6 32.2 co-occur
window Size=10
Directed 6,662 13.3 2,081 4.1 31.2 42.3 35.9 forward
co-occur Size=2
Directed 6,636 13.3 2,082 4.1 31.2 42.3 35.9 backward
co-occur Size=2
P-Precision,R-Recall, FM-F Measure
3.2 Co-occurrence based on POS tagger
The purpose of POS tagging [13] is to assign the correct lexical category (e.g., noun, verb, article...), to each word in a text. The main difficulty with POS tagging is that the assignment of a word class is often an ambiguous task as the lexical category of a word usually depends on the context in which it is used. For example, the word store can be used as a both noun or a verb. To deal with this ambiguity, POS taggers usually consider sequences of n words in order to derive the context in which words are used. This alternative syntactic model takes relationship between words into account. This approach avoids the usage of an external knowledge base to produce a labeled Graph.
The grammatical relation is used to find relevance of reviews [14] using Graph model. Review text is first tagged with part-of-speech information producing noun, verb, adjective or adverb vertices. The Graph generator takes a piece of text as input and generates a Graph as its output. Graph structure is defined using relevance vector which is created using metrics exact matches (e), substring matches (s), distinct strings (d) or non-matches, synonyms (y), hyponyms (h) and rare domain words (r)
dorg(e, s, d, y, h, r)
A linguistic structure of a paragraph of text document is based on parse trees [15] for each sentence of paragraph. A Parse Thicket is a Graph, which includes parse trees for each sentence, as well as additional arcs for inter-sentence relationship between parse tree nodes for words such as co-references, taxonomic relations such as sub entity, partial case, and predicate for subject, rhetoric
[image:3.595.47.299.98.368.2]information in texts but they do not take into account the semantic relations between words. Semantic relationship [16] between words is considered to construct Graph. Semantic relation is specified using Thesaurus Graph and concept Graph. In treasure Graph vertex denotes terms and edge denotes sense relations for example synonymy and antonymy. [17] Conceptual Graph is constructed from text document. Word net and Verbnet is used to find the semantic roles in a sentence and using these roles conceptual Graph is constructed Raw text are pre-processed and disambiguated nouns are mapped to Wordnet concepts. Concept rather than words are very efficient, concise representation of document content. It can easily and clearly interpretable. Co-occurrence of concepts [18] rather than words together is calculated on the basis if hypernym and holonym occurrence together. Page rank is used to infer the correct sense of concept in the document.
Table 2. Comparison of term-concept [18] with TF-IDF method for dataset of 20 newsgroup each containing 1000 document.
Method Accuracy of classification
Top 10 key-concepts with Naive Bayes 41.48 Top 20 weighted key-concepts with k-NN 38.74 Weighted TF-IDF vector with k-NN 36.95 TF-IDF vector with Naive Bayes 27.55
[image:3.595.317.558.314.372.2]Table 2 shows accuracy of term-concept with TF-IDF method for dataset of 20 newsgroup dataset each containing 1000 document. A Hyponym pattern is combined with Graph structures [19] that capture two properties associated with pattern extraction: popularity and productivity. A word is popular if it was discovered many times by other words (or phrases) in a hyponym pattern. A candidate word is productive if it frequently leads to the discovery of other words. Together, these two measures capture not only frequency of occurrence, but also cross-checking that the word occurs both near the class name and near other class members.
Table 3. Popularity and Productivity metric [19]
N Popularity Productivity ( InD) ( OutD)
25 1 1
50 0.98 1
64 0.77 0.78
Table 3 shows for states dataset popularity metric provide good accuracy. Productivity metric good for 50 states dataset.
Concept Graph vertices denote concept and edges denote conceptual relation. For example hypernymy or hyponymy. Motter et al. [20] proposed relation between words if Words are related to similar concepts. Conceptual network is built from thesaurus dictionary. Semantic relation is considered in [21] to find the relationship between words. Graph structure of wordnet is studied to understand global organization of lexicon.
[image:3.595.379.496.497.571.2]Fig. 3. Text document representing methods using Graph
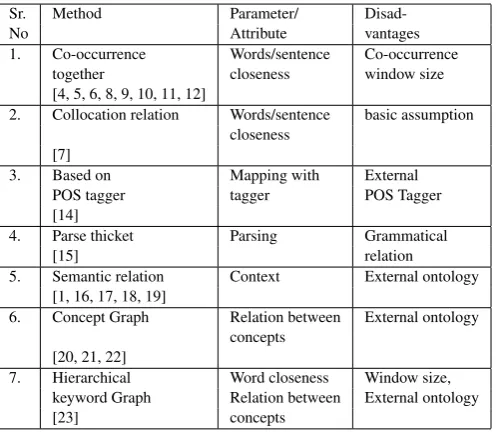
Table 4. Methods for representing Text document as Graph
Sr. Method Parameter/
Disad-No Attribute vantages
1. Co-occurrence Words/sentence Co-occurrence
together closeness window size
[4, 5, 6, 8, 9, 10, 11, 12]
2. Collocation relation Words/sentence basic assumption closeness
[7]
3. Based on Mapping with External
POS tagger tagger POS Tagger
[14]
4. Parse thicket Parsing Grammatical
[15] relation
5. Semantic relation Context External ontology [1, 16, 17, 18, 19]
[image:4.595.51.300.313.530.2]6. Concept Graph Relation between External ontology concepts
[20, 21, 22]
7. Hierarchical Word closeness Window size, keyword Graph Relation between External ontology
[23] concepts
to UMLS Met thesaurus using MetaMap. Semantic relationship between concepts is constructed on the basis of extracted token classification using POS tagger in class set vertex, edge and ignore.
3.4 Hierarchical Keyword Graph
Terms and concepts in document are combined in Hierarchical manner in hierarchical keyword Graph [22] where terms together are connected and later stage semantic meaning is considered and concepts are added to Hierarchical Keyword Graph. Concept of words using thesaurus and the words are grouped based on their concepts and are visualized in HK Graph.
Table 4 shows detailed survey of methods representing text document as Graph with two components i) Parameter/Attribute represents important component taken into consideration while
Fig. 4. Classification of Graph based Analysis Methods.
constructing Graph and ii) Disadvantages of the method indicates method is highly depends on the listed parameters.
Graph representation is constructed according to the application. There is lot of scope for experimentation for constructing standard Graph Model for text document representation and analysis.
4. GRAPH BASED ANALYSIS
Different types of computation can perform in order to rank the vertices or to measure the topological properties of Graph. Various analysis techniques with result are listed. Fig 4 shows classification of different Graph based analysis methods.
4.1 Vertex and Edge Ranking
Vertex ranking is computed on the basis of basic Graph properties.
4.1.1 Degree of a vertex . based on counting number of neighbours of V
deg(v) =|{v0|v0∈V ∧ ∃(v, v0)∈E}|
The function deg assigns more importance to vertices that have many neighbours.
4.1.2 Closeness. assigns more importance to vertices that are close to all other vertices in the Graph.
cls(v) =P
v6=v0∈V 1 dsp(v,v0)
and wheredsp(v, v0)
is the shortest path distance betweenvand v0
. Thekhighest ranked vertices of Graph maintain only thosek vertices in the Graph that are ranked highest according to a vertex rank method 1 and 2.
4.1.3 Small world property. A Graph having the small world property is a Graph which has both short average path lengths like a random Graph, as well as high local clustering coefficients like a regular Graph.
The path length between two nodes in the Graph is denoted by dG(i, j)with(i, j)∈Nand measures how many connections part
the two given nodes at least. The average path lengthdGover the
Graph is then calculated as the arithmetical mean over all possible distances:
dΩ=|N1|
P1 i=|N|
1 i
Pi
j=0dG(i, j)
4.1.4 Term weight. Term weight [6] proved relevant alternative to term frequency which represents the number of different contexts in which term occurs in the document. It provides more relevant result. The additional edge is added only if the context is new.
Table 5. Term weight comparison with Term frequency [6]
Model Parameter Dataset TREC1-3 Ad Hoc TF(b=0.20) 0.147
TW(p=0.003) 0.1576
Term weight model compared with TF model and proved significantly outperformed shown in table 5. This shows how well the Graph-of-word encompasses concavity, document length normalization and lower-bounding regularization compared to the traditional bag-of-words.
Table 6. [23] Mean average precision (MAP) of retrieval results of ranking with four Graph-based term weights
(TextRank, TextLink, PosRank, PosLink)
Approach Degree Path Cl. coef. Sum TF-IDF BLOG
TextRank 0.3501 0.3617 0.3583 0.3567 0.2963 TextLink 0.3697 0.3947 0.3906 0.3850
PosRank 0.3897 0.3944 0.3918 0.3919 PosLink 0.3903 0.3778 0.3833 0.3838
Graph topological properties (average degree, path length, clustering coefficient) are integrated into ranking shows improvement in the result compare to traditional method.Table 6shows the result. Discourse aspects of the documents being ranked for retrieval is considered.
4.1.5 Pagerank Surfer Model . TextRank [12] implements construction of Graph based on the recommendation concept. The importance of recommendation is recursively computed based on the units making the recommendation. Score of the vertex is
S(Vi) = (1−d) +d∗PJ∈Vi
1
|Out(Vj)|S(Vj)
WhereIn(V i)is pointing to its predecessor vertices andOut(V i)
is pointing to its successor vertices. Where d is a damping factor
= 0.85 which has the role of integrating into the model the probability of jumping from a given vertex to another random vertex in the Graph. The sentences that are highly recommended by other sentences in the text are likely to be more suggestive for the given text and will be given a higher score and added as a forwarding link from vertex.
[2] discussed a random-walk approach for term weighting that has the ability to capture term dependencies in a text by accounting for the structural properties of the text is used. Table 7 list the comparison results.
By analyzing the rw weights observed a non-linear correlation with the tf weights, with an emphasis given to terms surrounding
confirmed 6.90 1 estimated 1.00 1
Kaines 6.81 1 sales 1.00 1
Operator 6.76 1 total 1.00 1
London 4.14 1 brokers 1.00 1
Cargoes 4.01 2 May 1.00 1
Shipment 4.01 1 June 1.00 1
dlrs 4.01 1 tonne 1.00 1
White 3.87 1 cif 1.00 1
important key-terms such as e.g. sugar or cargoes. This spatial locality has resulted in higher ranks for terms like operator compared to other terms like London.
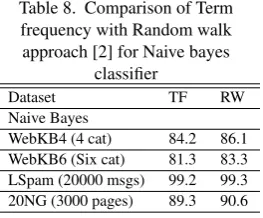
[image:5.595.343.530.86.220.2]Also The results are compared with three frequently used text classifiers Rocchio, Naive Bayes, and SVM, selected based on their performance and diversity of learning methodologies. Table 8 shows results for Naive bayes classifier.
Table 8. Comparison of Term frequency with Random walk approach [2] for Naive bayes
classifier
Dataset TF RW
Naive Bayes
WebKB4 (4 cat) 84.2 86.1 WebKB6 (Six cat) 81.3 83.3 LSpam (20000 msgs) 99.2 99.3 20NG (3000 pages) 89.3 90.6
However this approach is not used for longer sequence of words. Performance In the text classification task, the random-walk model achieves relative error rate reductions of 3.2-84.3 percentage as compared to the traditional term frequency based approach. Pagerank algorithm is used to find concepts in the Graph with great score [1] . Performance is Concept Graph exhibits 11 percent improvement over term TF-IDF.
[24] discussed Graph based representation for document summarization. Document is represented as a network of sentences. Sentence similarity is carried out on the basis of information shared among each other and centrality of sentence is calculated on the basis of similarity with other sentence. Cosine similarity using term frequency is carried to find central sentence for document summarization. Along with this feature degree centrality is carried to find the prestige of a sentence. Performance of the system on noisy data after adding 17 percent noise on the datasets. The performance loss is very small. This suggests that 17 percent noise on the data is not enough to make significant changes on the Centroid of a cluster.
4.2 Graph Operations
4.2.1 Graph Union. Graph union [13] is merging of two Graphs without any loss of information. the corpus D is represented asD=
d1, d2, ...dnand ifGirepresentsd1then the combined information
[image:5.595.373.505.316.425.2] [image:5.595.62.285.352.421.2]GD=S n
i=1Gi
Usage of Graph union to merge textual documents typically requires post-processing with an operator that extracts relevant information from the combined Graph.
4.2.2 Computation of Subgraph . Problem with Graph representation is that documents represented by Graphs cannot classified with most model based classifier.
To overcome these issue hybrid methodology [25] used which is the combination of 1) keeping important structural web page information by extracting relevant sub-Graphs from a Graph that represents web page and 2) represent web document by a simple vector with Boolean values to apply traditional classification method to classify web document. But the computational resources required to process hybrid model are still extensive.
To overcome this [26] proposed a weighted subgraph mining mechanism W-gSpan. In effect W-gSpan selects the most significant constructs from the Graph representation and uses these constructs as input for classification.
[11] Presented an approach using maximum common subgraph for finding similar document represented using weighted directed graph. This approach compute the similarity compute the similarity of two Graphs by considering the contributions both from the common nodes and from the common edges, as well as their weights.
Sim(G1, G2) =β
|N(g)|
max(|N(G1)|,|N(G2)|)+ (1−
β)
P
∀E(g)(min(wij,wi0j0)/max(wij,wi0j0))
max(|E(G1)|,|E(G2)|)
whereg=mcs(G1, G2)denotes the mcs ofG1andG2N(g)is the number of nodes ing4andE(g)is the number of edges ing. wijandwijdenote the weight ofeijinG1and the weight ofeij
[image:6.595.316.557.69.223.2]inG2respectively.max(N(G1), N(G2))is the larger number of nodes inG1orG2.βis an artificial coefficient determined by the user, and it belongs to(0,1).
Table 9. Graph Structure Model Comparison for Classification over Vector Space Model [11]
Class label Graph Vector Space Model Structure model
F-score F-score Envi ronment 0.5405 0.8205
Computer 0.8572 0.6977
Education 0.9756 0.7843
Transport 0.6667 0.6061
Economy 0.7805 0.6286
Military 0.4615 0.6842
Sports 0.7083 0.7692
Medicine 0.7317 0.7
Art 0.647 0.766
Politics 0.7369 0.8
Agriculture 1 0.6667
Law 0.7619 0.6286
History 0.8837 0.7391
Philosophy 0.7895 0.7027
Electronics 0.7027 0.7805
Avg. 0.7496 0.7183
Table 9 list Graph structure model perform better classification over vector space model however this method is not suitable for long length texts.
Fig. 5. Graph Matching comparison with cosine similarity [14]
4.3 Graph Features
Twenty one Graph based features [27] are applied to compute text rank score for novelty detection which is based on the following definitions:
(1) Background Graph: The Graph representing the previously seen sentences.
(2) G(S) :The Graph of the sentence that is being evaluated. (3) Reinforced background edge: an edge that exists both in the
background Graph and inG(S).
(4) Added background edge: a new edge in G(S) that connects two vertices that already exist in the background Graph. (5) New edge: an edge in G(S) that connects two previously
unseen vertices.
[image:6.595.74.271.452.654.2](6) Connecting edge: an edge in G(S) between a previously unseen vertex and a previously seen vertex.
Table 10. Comparison of Graph based feature [27] (SG) with TextRank (TR) and K-divergence (KL)
Feature set Average F measure
KL 0.618
TR 0.6
SG 0.619
KL + SG 0.622 KL+SG+TR 0.621
SG+TR 0.615
TR+TL 0.618
Table 10 shows comparison of Graph based feature (SG) with TextRank(T R)and K-divergence(KL). By integrating text rank and simple graph based features to the KL divergence feature classification results are improved.
4.4 Graph Matching
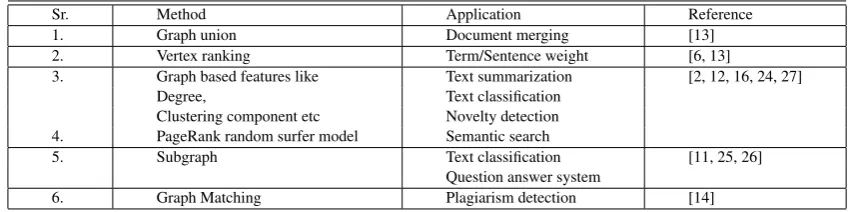
[image:6.595.387.484.465.593.2]representation and analysis are systematically analyzed and the detail chart is presented in table 11.
5. CONCLUSION
Graph model is most suitable representation of text document. This paper discussed previous text representation model and Graph based analysis in detail. This paper presented survey of the results in the field of Graph representation and analysis of text document. These results are examined along three directions i) From the perspective of edge relation to represent Graph ii) From the perspective of selecting concept as vertex for Graph representation iii) From the perspective of applying different Graph operations, Graph properties to analyze Graph.
Graph structure represents nodes denote feature terms and edges denote relationship between terms. Relationship can be co-occurrence [4, 5, 6, 7, 8, 9, 10, 11, 12] , grammatical [14, 15], semantic [1, 16, 17, 18, 19] or conceptual [13, 20, 21]. The edge relation to construct the Graph can be replaced by kind of mutual relation between text entities. Once text document represented as Graph, various graph analysis methods can be apply on it. Graph operation such as Graph union [13] , Graph intersection, topological properties [7, 26, 27] such as degree coefficient, clustering component and vertex ranking, small world property found effective and efficient text document analysis for different applications. Approaches defined in [12, 27] used PageRank model along with Graph properties to rank the documents. Current research focuses on applying Graph properties along with suitable Graph techniques for analyzing text data for different applications.
As there were no standard Graph model for representing text document hence relevant to the application, Graph based text representation model can be used. More systematic research on Graph model for text representation is necessary and can apply to analyze it.
Graph based analysis does not required detailed linguistic knowledge, domain or language specific collection. It is highly portable to other domains and languages. The application of Graph based representation of text elements provides processing of the information in various areas like document clustering, document classification, word sense disambiguation, prepositional phrase attachment. However Graph algorithms or techniques need to be extended in order to capture the requirement and complexities of the applications.
6. REFERENCES
[1] Jae-Yong Chang and Il-Min Kim Analysis and Evaluation of Current Graph-Based Text Mining Researches. Advanced Science and Technology Letters Vol.42, 2013, pp. 100−103.
[2] Hassan S., Mihalcea R., Banea C., Random-Walk Term Weighting for Improved Text Classification. IEEE International Conference on Semantic Computing, ICSC-2007, 2007.
representation model and its realization. In Natural Language Proceeding and knowledge Engineering (NLP-KE), 2010, pp 1−8.
[6] Francois Rousseau, Michalis Vazigiannis,Graph-of-word and TW-IDF: New Approach to Ad Hoc IR. Proceedings of the 22nd ACM international conference on Conference on information and knowledge management 2013, pp. 59−68.
[7] Bordag, S., Heyer, G., Quasthoff, U. Small worlds of concepts and other principles of semantic search. In T. Bhme, G. Heyer, H. Unger (Eds.), IICS, 2003, lecture notes in computer science Vol. 2877, pp. 10−19.
[8] i Cancho, R. F., Capocci, A., Caldarelli, G. Spectral methods cluster words of the same class in a syntactic dependency network. International Journal of Bifurcation and Chaos, 2007, 17(7), pp. 2453−2463.
[9] Chris Biemann, Unsupervised Part-of-Speech Tagging Employing Efficient Graph Clustering Proceedings of the COLING/ACL 2006 Student Research Workshop,July 2006, pp. 7−12.
[10] Dorogovtsev, S. N., Mendes, J. F. F. Language as an evolving word web. Proceedings of The Royal Society of London. Series B, Biological Sciences 268(1485), pp. 2603−2606.
[11] J. Wu, Z. Xuan, and D. Pan Enhancing Text Representation for Classification Tasks with Semantic Graph Structures. International Journal if Innovative Computing, Information Control, Vol. 7, No. 5(B), 2011, pp. 2689−2698.
[12] Rada Mihalcea and Paul Tarau. TextRank: Bringing order into texts. Association for Computational Linguistics EMNLP−04, pp. 404?411.
[13] Antoon Bronselear, Gabreilla Pasi, An approach to graph-based analysis of textual document , 8th European Society for Fuzzy Logic and Technology, Proceedings EUSFLAT 2013, pp.634?641.
[14] Lakshmi Ramachandran , Edward F. Gehringer,Determining Degree of Relevance of Reviews Using a Graph-Based Text Representation. Proceedings of the 2011 IEEE 23rd International Conference on Tools with Artificial Intelligence, 2011, pp.442−445.
[15] Galitsky, B., Ilvovsky, D., Kuznetsov, S.O., and Strok, F., Matching sets of parse trees for answering multi-sentence questions, Proc. Recent Advances in Natural Language Processing (RANLP 2013), Bulgaria, 2013, pp. 285?294. [16] Steyvers, M., Tenenbaum, J. B. The large-scale structure
of semantic networks: Statistical analyses and a model of semantic growth. Cognitive Science, 2005, Pp.41−78. [17] Svetlana Hensman, Construction of conceptual graph
representation of texts. Proceedings of the Student Research Workshop at HLT-NAACL 2004, p.49−54.
Table 11. Graph based analysis method used in different text analysis applications
Sr. Method Application Reference
1. Graph union Document merging [13]
2. Vertex ranking Term/Sentence weight [6, 13]
3. Graph based features like Text summarization [2, 12, 16, 24, 27]
Degree, Text classification
Clustering component etc Novelty detection 4. PageRank random surfer model Semantic search
5. Subgraph Text classification [11, 25, 26]
Question answer system
6. Graph Matching Plagiarism detection [14]
[19] Kozareva, Z., Riloff, E., Hovy, E. . Semantic class learning from the web with hyponym pattern linkage graphs. In Proceedings of ACL-08: HLT, Ohio: Association for Computational Linguistics,2008, pp. 1048−1056.
[20] Motter, A.E et al Topology of the conceptual network of language. Phy. Rev. E.Stat. Nonlin. Soft Matter Phys., 65, 2002.
[21] Sigman, M., Cecchi, G. A.The global organization of the WordNet lexicon. Proceedings of the National Academy of Sciences of the USA,2002, 99, pp. 1742−1747.
[22] Daisuke Kobayashi, Tomohiro Yoshikawa and Takashi Furuhashi, Visualization and Analytical Support of Questionnaire Free-Texts Data based on HK Graph with Concepts of Words, IEEE International Conference on Fuzzy Systems June 2011, pp. 27−30.
[23] Rio Blanco, Christina LiomaGraph-based term weighting for information retrieval. Information retrieval, 15(1), February 2012, pp 54−92.
[24] Gunes Erkan and Dragomir R. Radev. LexRank: Graph based centrality as salience in text summarization. Journal of Artificial Intelligence Research,Volume 22 issue 1, 2004, pp. 457−479.
[25] Kjetil Valle, Pinar OzturkGraph-based Representations for Text Classification. India-Norway Workshop on Web Concepts and Technologies, October 3rd 2011.
[26] Jiang, F. Coenen, R. Sanderson and M. Zito, Text classification using graph mining-based feature extraction. Research and Development in Intelligent Systems XXVI, Springer, 2010, pp.21−34.
![Fig. 2.Sample Graph reprinted from [2] drawn of sample documentshown in fig 1](https://thumb-us.123doks.com/thumbv2/123dok_us/8041826.771609/2.595.322.548.75.288/fig-sample-graph-reprinted-drawn-sample-documentshown-g.webp)
![Table 1. TextRank approach [12] for number of keywords per abstractevaluated against number of correct keywords assigned by indexerwith co-occurrence window size set to 2, 3,5,10 words](https://thumb-us.123doks.com/thumbv2/123dok_us/8041826.771609/3.595.47.299.98.368/textrank-approach-keywords-abstractevaluated-keywords-assigned-indexerwith-occurrence.webp)
![Table 9. Graph Structure Model Comparison forClassification over Vector Space Model [11]](https://thumb-us.123doks.com/thumbv2/123dok_us/8041826.771609/6.595.74.271.452.654/table-graph-structure-model-comparison-forclassication-vector-space.webp)