324
SORTING DATES FRUIT BUNCHES BASED ON THEIR
MATURITY USING CAMERA SENSOR SYSTEM
1ABDELLAHHALIMI*, 2AHMED ROUKHE, 3BOUZID ABDENABI,4NOUREDDINE EL
BARBRI
1Phd Student, Department of Physics; Team Optoelectronic Information Processing, Laboratory LAMPE ;Univ My Ismail, Faculty of Science, Meknes, Morocco.
2,3Professor, Department of Physics ; Laboratory LAMPE , Univ My Ismail ,Faculty of Science Meknes Morocco.
4Asstt.prof. ENSA; Team Electronic and signal and system, Univ Hassan 1ffiliation; 77 Khouribga Morocco.
LAMPE: laboratory of Atomic, Mechanical, Photonics and Energetic . 1*Email: [email protected]
ABSTRACT
This paper presents the development and application of image analysis and computer vision system in quality and maturity evaluation of products in the agricultural field. Computer vision is a rapid, consistent and objective inspection technique, which has been expanded to varied industries. Monitoring and controlling ripeness is becoming a very important issue in fruit management since ripeness is perceived by customers as main quality indicator [1].In this paper, we present a method for automatic evaluation of date fruits maturity based on computer vision. The method was implemented, and tested on a sample of dates fruit images with different levels of maturity. Segmentation is one of the basic techniques in computer vision [2][5]. Color is often thought as a property of an individual object and the color of this object comes from the visible light that reflects off the object surface. In this experiment we have implemented a method to quantify the standard color of fruit in HSV(Hue, Saturation and Value) color spaces in order to achieve fruit image segmentation. For this reason, a machine vision system was trained to distinguish between good or mature and yellow or green date fruits. HSV system is suggested as the best color space for quantification in date fruit quality and maturity. In addition, our approach has the benefits of being insensitive to rotation, scaling, and translation. Moreover, the system can be applied to several types of maturity fruit evaluation. In this article we shall give the results of the experiments we have carried out; these results demonstrate the feasibility of our proposed method in color segmentation for date fruit evaluation.
Keywords: Image Processing; Image Segmentation And Binarisation; Computer Vision, Quality Control,
HSV And RGB Color Space
1. INTRODUCTION
The date palm is a pre-Saharian treein the province of Errachidia in the south of Morocco. The date tree, implanted mainly along the valleys of Ziz and Drâa, is
considered as one of the oldest fruit species of the country. It’s a symbol of fertility and also prosperity of the Saharans zones and it constitutes one of the main agricultural activities in the region. In parallel, the cultivation of the palm tree date, going back to many centuries ago, covers an important surface of over 15 million feet, and places Morocco in leading position in the world production of date fruits.
Maturity at harvest is the most important factor that determines storage-life and final fruit quality. Immature fruits are more subject to
shriveling and mechanical damage, and are of inferior quality when ripe. Overripe fruits are likely to become defective with insipid flavor soon after harvest. Any fruit picked either too early or too late in its season is more susceptible to physiological disorders and has a shorter storage life than fruit picked at the proper maturity[2][3]. That’s whywe need to determine the stage of maturity of date fruit and to classify it into three or four class dates:
• Unripened fruit.
• Unripe with the appearance of insufficiently mature part of date fruit.
• Not completely mature but likely to be artificially or naturally matured after harvest.
• Dates fruit with defects.
In this article, we focus on investigating color difference for image segmentation to specify the quality and maturity stage of date fruit. In this research, we study the conditions to design a system for sorting dates, based on the percentage of maturity and size of date fruit.
Color image processing is used in many fields of application, such as manufacturing, agriculture, commerce, etc. In agriculture, the color of crops, forests, fruits, and flowers in images can be evaluated according to their ripeness and size.
Thus, color representation is a fundamental problem in computer vision. Many applications depend on a good color representation in order to perform well. Although most color images are captured in RGB, this color space is rarely used for computer vision tasks. The main reason is that RGB
does not separate color from intensity which results in highly correlated channels [4].
The color segmentation has been a topic of focus in the literature and there exist several reviews about the different approaches published[5] [6].
We have developed a method which is able to segment images of date fruits and to classify them by their quality depending on the level of maturity and size using a HSV representation color, a method that can be applied to other types of fruit.
2. DEFINITION AND REQUIREMENTS
2.1. Fruit Maturity.
The maturity of fruits corresponds to a set of biochemical and physiological changes leading to the state of maturity and conferring on the fruit its organoleptic characteristics [7]. It can be modulated by the factors of the environment. Beyond the state of maturity, the fruit gets into a period of senescence leading to cellular disorganization and to gradual death.
In postharvest physiology we consider "mature" as "that stage at which a commodity has reached a sufficient stage of development that after harvesting and postharvest handling, its quality will be at least the minimum acceptable to the ultimate consumer"[8][16] . Fruit quality is a combination of attributes and properties that give fruits value in terms of human consumption. Growers and shippers are concerned that their commodities have good appearance and few visual defects. To receivers and distributors, firmness and a long storage life are of keen interest[9]. Consumers perceive quality fruit as one that looks good, firm, and with great size [10].
3. KEY INDICATEURS OF MATURITY.
Fruits harvested at a stage of premature maturing may more wither and undergo mechanical damage, and they are of inferior quality when they mature. On the other hand, you should not collect the fruit at a stage of maturation when the fruit is intended to be sent on a long distance, because they will not preserve for a long time [11] . Therefore, it is indispensable to make the harvest at a stage of maturation corresponding to the use that we want.
Equally, an indicator of maturity used for a cultivar or a given hybrid is not likely to be applicable to other cultivars or hybrids. It is thus substantial to combine several indicators to determine the stage of harvest. The indications of maturity have to measure the physical characteristics and the qualitative ones which evolve as the fruit develops, but for dates fruit we can determine the maturity by vision to be collected at a particular stage.
1.1. Date Fruit Maturity Evolution:
Fig.1. (a)-(b)-(c)-(d)–(e)-(f): a date fruit with different levels of maturity
(a)
(b)
(c)
(d)
326 a) Light green or more green than yellow. b) More yellow than green or completely
yellow.
c) Yellow with the appearance of a small part that has a honey color.
d) Expansion of the mature part and the decrease of the yellow part.
e) Overripe.
f) Defected or damaged fruit. Defective fruit is characterized by a small size and a very large number of wrinkles.
This system is applied to khalt (khalt is a category of date fruit in province d’Errachidia in Morocco).
3.2. Harvest State of Date Fruit. 3.2.1. Experimentation
Here we present the evolution of date fruit (A1, A2, A3, and A4) maturity in relation with time after harvest, the condition are: Temperature variation between 30 C° and 43 C°.
Date fruit A1:
The date fruit can never reach the stage of maturity
Fig.2: Maturity evolution in relation to time after harvest (green date fruit).
Date fruit A2:
The date fruit can never reach the stage of maturity
Fig.3: evolution of the state of maturity as a function of time after harvest
Date fruit A3:
Fig.4. Evolution of the state of maturity as a function of time after harvest
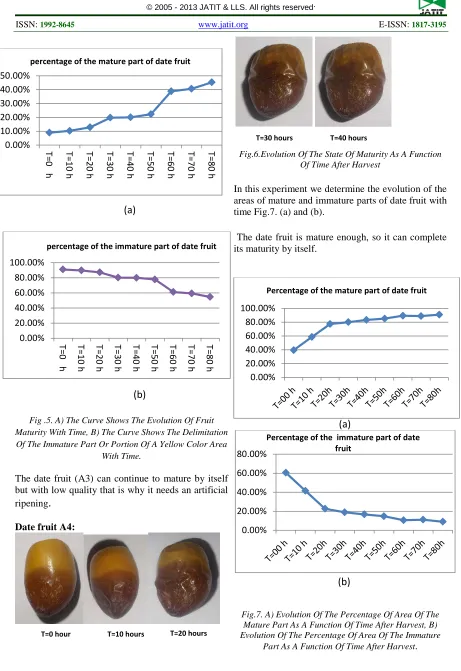
In this experiment we determine the evolution of the areas of mature and immature parts of date fruit with time Fig.5.(a) and (b).
T=0 hour T=10 hours T=20 hours
T=30 hours T=40 hours
T=0 hour T=10 hours T=20 hours
T=30 hours T=40 hours
T=0 hour T=10 hours T=20 hours
Fig .5. A) The Curve Shows The Evolution Of Fruit Maturity With Time, B) The Curve Shows The Delimitation Of The Immature Part Or Portion Of A Yellow Color Area
With Time.
The date fruit (A3) can continue to mature by itself but with low quality that is why it needs an artificial ripening
.
Date fruit A4:
Fig.6.Evolution Of The State Of Maturity As A Function Of Time After Harvest
In this experiment we determine the evolution of the areas of mature and immature parts of date fruit with time Fig.7. (a) and (b).
The date fruit is mature enough, so it can complete its maturity by itself.
Fig.7. A) Evolution Of The Percentage Of Area Of The Mature Part As A Function Of Time After Harvest, B) Evolution Of The Percentage Of Area Of The Immature
Part As A Function Of Time After Harvest. 0.00%
10.00% 20.00% 30.00% 40.00% 50.00%
T=0
h T=10 h T=20 h T=30 h 0 hT=4 T=50 h T=60 h T=70 h T=80 h
percentage of the mature part of date fruit
0.00% 20.00% 40.00% 60.00% 80.00% 100.00%
T=0
h T=10 h T=20 h T=30 h 0 hT=4 T=50 h T=60 h T=70 h T=80 h
percentage of the immature part of date fruit
0.00% 20.00% 40.00% 60.00% 80.00% 100.00%
Percentage of the mature part of date fruit
0.00% 20.00% 40.00% 60.00% 80.00%
Percentage of the immature part of date fruit
(a)
(b)
T=0 hour T=10 hours T=20 hours
T=30 hours T=40 hours
(a)
[image:4.612.75.536.57.728.2]328 Conclusion of the Experiment
This experiment shows that the date fruits are capable of continuing to mature even after having been harvested at a well determined level of maturity. The determination of the degree of maturation of these fruits is necessary because it allows us to define the duration of their storage and to decide on their best uses. These results, obtained in the concrete case of dates, can, according to researchers be applied to other fruits, provided that in other studies is carried out.
In province Errachidia, date fruits are ripened by sun curing and drying of (khalt) variety. This can also be achieved by artificial heat treatment in circumstances where ripening is not completed entirely on the palm or when early rains threaten to damage the crop. In its pure form artificial maturation consists of imitating the optimum conditions for ripening on the palm. The process requires rooms in which temperature, humidity and air ventilation can be controlled. Maturation is quite often accompanied by dehydration. But on the other hand there are date fruits which do not respond to the temperature treatment or, in the best scenario will initiate ripening but will never attain the characteristics of good date. One main reason for this is that it is necessary to sort harvested dates fruit
into three types:
A) Overripe date fruits
B) Not enough mature but in a stage where ripening is not competed entirely and can be achieved by artificial heat treatment or traditional by exposition to sun.
C) Defective dates or immature, or mature but at a stage where their maturity can never be entirely completed.
When fruits are harvested in summers, we have to sort different kinds dates according to their maturity and their contents defects. To do this we relied on the following method.
4. MATERIALS AND METHODS.
Image conversion (RGB to HSV) conversion in order to extract regions of interest.
1) Mathematical morphology applications to eliminate noise and image binarisation. 2) Extraction of immature and mature parts
then, geometric Feature Extraction. Sorting fruits.
Fig.9. The Computer Vision System For The Sorting Of Dates Fruits Based On Their Maturity Level.
Computer vision has been widely used for the quality inspection and grading of fruits and vegetables. It offers the potential to automate manual grading practices and thus to standardize techniques and eliminate tedious inspection tasks[12] . reported that the automated inspection of produce using Date fruit image capturing by
CCD cam
Drying and packaging
Artificial repening and packaging Destination for
animalhusbandry
Image Pre-processing
Image conversion ( RGB to HSV) and binarisation
Geometric Feature Extraction
Sorting
Defective or
immature Underripes Mature
Fruit sorting stript
sorting bins
Mature fruit fruit Image capturing
underripe fruits Fruit placer
Conveyer Belt
lighting
Fig.8. A reconfigu rable
machine vision not only results in labor savings, but can also improve quality inspection objectivity. 4.1. Image Conversion from RGB to HSV
HSV (Hue, Saturation and Value) defines a type of color space. It is similar to the modern RGB and CMYK models. The HSV color space has three components: hue, saturation and value. Brightness is sometimes substituted for ‘Value’and then it is known as HSB. The HSV model was created by Alvy Ray Smith in 1978. HSV is also known as the hex-cone color model.
The HSV color model can be considered as a different view of the RGB cube. Hence the values of HSV can be considered as a transformation from RGB using geometric methods. The diagonal of the RGB cube from black (the origin) to white corresponds to the V axis of the hexagon in the HSV model. For any set of RGB values, V is equal to the maximum value in this set. The HSV point corresponding to the set of RGB values lies on the hexagonal cross section at value V. The parameter S
is then determined as the relative distance of this point from the V axis. The parameter H is determined by calculating the relative position of the point within each sextant of the hexagon. The values of RGB are defined in the range [0, 1], the same value range as HSV. The value H is the ratio converted from 0 to 360 degree [13].
The passage from RGB to HSV was made by a transformation, not Shelf space. Several operators were proposed for it Conversion. The HSV system is defined as follows:
The RGB image is transformed into HSV with the 'rgb2hsv' routine of the image processing toolbox, version 6, of Matlab (Mathworks, 2005), which uses the following equations(Eq1):
( , , ) ( , , ) ( , , ) ( ) 2 ( ) 4 ( )
v Max r g b
Sc Max r g b Min r g b
a b
h if r Max
Max Min b r
if g Max Max Min
r g
if b Max Max Min = = − − = = − = − + = − − = + = −
RGB Image to HSV conversion relation
.
4.2. Results and Discussion.
The series of images taken under each experiment were used in the analysis to study the variation of yellow area with maturity area using HSV color space representation. These captured images were in RGB and then converted to HSV color space using an algorithm of Matlab (version 7.0; Math Works, Inc., USA). Between images, there is a fluctuation in the development of yellow regions that can be clearly seen Fig1. This is due to the mature part color development.
The size of the fruit is considered a very important parameter in distinguishing the good quality from poor one. The accuracy of color segmentation algorithm can be tested by studying the variation in the detected area while the fruits undergo color changes. In general, the mature part of date fruit varies depending on the number of days the fruit has taken to fully became mature. The data sets shown in Fig. 5, Fig.6, Fig.8 and Fig.9 demonstrate the variation in calculating the areas of fruit based on color HSV transformation. The sorting device online works based on this color space. The first function is used for "training" the color detection model to detect in order to isolate region of interest. The return value is on Mx3 matrix, and each row contains the average HSV value of the respective sub image. The selected windows are 5X5 pixel.
STEP 1: a function is used for "training" the color detection model in order to estimate the average HSV value of the region of interest. This function helps to choose manually several "seeds" from each image. At the end, the HSV matrix contains M rows (M is the total number of images stored): each row corresponds to the average HSV value of the selected seeds in the respective image. The average (or median) value of this matrix (column-wise) can be used in the sequence for detecting the specific color values.
STEP 2: We Use the estimated (average) HSV value for detecting the specified color in a specific tested image. The return value is an Mx3 matrix, and each row contains the average HSV value of the respective image stored.
330 For example the median value of HSV training is:
Defined as a color reference
In order to classify pixels in the image test we
calculate
D
hsv for H and S and V.hsv
D
=HSV
ref−
HSV
test =(d , d , d )
H S V1 2 3
( T T )
TD T
In This application:1
0.0123 , T
20.1232 , T
30.1198
T
=
=
=
So:(0.0123 0.1232 0.1198)
TD
: Containingthe tolerance (the maximum distance in each
test
HSV
coefficient of each pixel fromHSV
ref). If I (i,j) is the pixel in the image test:( , ) 1
( , )
0
hsv Thsv T
D
D
I i j
D
D
I i j
→
=
→
=
The average value of this matrix can be used in the sequence for detecting the specific color values.
max
HSV
: is the max distance in each HSVcoefficient of each pixel from
HSV
moy fixed experimentally.4.2.1. Morphology Mathematics.
Morphology is based on set theory. A structuring element is a special mask filter that enhances an input image. It can be of different sizes and of different shapes (square, diamond, and circle). Following are the main mathematical morphological operators[14].
Dilatation, Erosion , Opening, Closing.
Three morphological operations, closing, region filling and area opening, were used in order to identify the region of interest: Fundamental morphological operations are as follows:
(a) The dilatation of A by B:
𝐴 ⊕ 𝐵= {𝑍/(𝐵�)𝑧⋂𝐴 ≠}
(b) The erosion of A by B:
𝐴 ⊖ 𝐵= { 𝑍
�𝐵��𝑧⊆ 𝐴}
(c) The opening of set A by structuring element B:
𝐴 ⊚ 𝐵= (𝐴 ⊕ 𝐵)⊖ 𝐵.
(d) The closing of set A by structuring element B:
𝐴 ⊙ 𝐵= (𝐴 ⊕ 𝐵)⊖ 𝐵
The aim of area opening is to eliminate small area blemishes that can be ignored by our processes. The algorithms are based on several steps:
(1) Definition of the connected components;
(2) Calculation of the area of each connected component;
(3) Elimination of small areas which are less than the threshold T experimentally predefined.
4.2.2. Otsu Method
Thresholding is a simple but effective method to separate objects from the background. A commonly used method, the Otsu method, improves the image segmentation effect obviously. It’s simpler and easier to implement. However, it fails if the histogram is unimodal or close to unimodal.
Otsu’s thresholding technique is based on a discriminate analysis which partitions the image into
two classes
C
0 andC
1 at gray levels t such that0
{0,1, 2,..., }
C
=
t
and1
{
1,
2,...,
1}
C
= +
t
t
+
L
−
where L is the total number of the gray levels of the image. Let thenumber of pixels at the
i
th gray level ben
i, and n be the total number of pixels in a given image. The probability of occurrence of gray level i, is defined as:(5)
(6)
(7)
(2)
(3)
i i
n
P
n
=
C0 and C1 are normally corresponding to the object of interest and the background. The probabilities of
the two classes are
w
0 andw
1 :0 0 t i i
w
P
==
∑
1 1L i i t
w
P
− ==
∑
Thus, the means of the two classes can be computed as:
0 0 1
0
( )
/
( ) ( )
t
i i
µ t
iP w t µ t
=
=
∑
1
1
( )
/
1( )
L
i i t
µ t
iP w t
−
=
=
∑
Let
σ
B2andσ
T2 be the between-class variance andtotal variance respectively. An optimal threshold
t
*can be obtained by maximizing the between-class variance.
2 *
2
0 1
{
max
(
B)}
i L Tt
Arg
σ
σ
≤ ≤ −
=
Where, the between-class variance
σ
B2 and totalvariance
σ
T2are defined as:2 2 2
0
(
0)
1(
1)
B
w µ
µ
Tw µ
µ
Tσ
=
−
+
−
1 2 2 0
(
)
L T T ii
µ
σ
− ==
∑
−
The total mean of the whole image
µ
Tis defined as:1 0 L T i i
µ
iP
− ==
∑
An equivalent, but simpler formula for obtaining
optimal threshold
t
* is as follows:* 2 2
0 0 1 1
0
{(
(
)
(
) )}
max
T Tt L
t
Arg
w µ
µ
w µ
µ
≤ ≤
=
−
+
−
Otsu’s method of Thresholding gray level images is efficient for separating an image into two classes where two types of fairly distinct classes exist in the image, (Fig.13.J); (Fig 14.e); (Fig .16.e) shows the test image for Otsu’s method Thresholding..
4.3. Features definition and extraction.
We have determined the quality of the date fruit based on the geometric features, namely size,
defect, color, mature and immature area parts of this fruit. Below is the description of the properties, usefulness and the extraction mechanism of these features.
• The size:
The fruit size is another quality attribute used by farmers; the bigger size fruit is considered as the better quality. The size is estimated by calculating the area covered by the fruit image. To calculate the area of date fruit, we compute the threshold (T) that separates the date fruit and background in the original image by using the Otsu method [15].The number of pixels that cover the fruit image is considered as an estimate of size.
• Number of wrinkles.
• Color.
Here we give the features to calculate:
m
A
: Area of mature parts of date fruitm
P
: Perimeter of mature parts of date fruit.Im
A
: Area of parts immature (yellow color) of date fruit.Im
P
: Perimeter of immature part of date fruit.S
: Size fruit, the area covered by date fruit in theimage.
%
m mA
Pg
S
=
: Mature part area percentage inrelation to the total area of the date fruit.
Im
Im
%
A
Pg
S
=
: Immature part area percentage inrelation to the total area of the date fruit.
4.4 Result of the Experiment and the Region of Interest Extraction Example.
Our work consists in the detection and the isolation of the mature part of the fruit from the immature part. We also isolate the date fruit from the background.
Date Fruit D12 :
(12)
(16)
(9)
332
• Immature or yellow fruit part extraction.
Fig.10. The examples of processing results; the Column contents: (a) original image D12, (b) Detected Area, (c) Detected Area and morphology mathematic application,
(d) Edge detection.
• Mature part fruit extraction.
e) Original Image
f) Detected Area
g) Region detection .
h) Edge detection
I) Image hystogram .
J)
Area occupied by Date fruit extractionFig.11. The examples of processing results; Column contents: (e) original image D12, (f) Detected Area, (g) Detected Area and morphology mathematic application,
(h) Edge detection,(I) Image histogram , (J) Date fruit extraction area.
Date Fruit D15
• Mature parts extraction D15
a) Original Image a) Original Image b) Yellow region
extraction.
b) Dected Areas
c)
Area detection and morphological operationd) Edges detection.
e) Date fruit Extraction area
f) Image Histogram
Fig.12. The examples of processing results; Column contents: (a) original image , (b) Detected Area, (c) Detected Area after morphology mathematic application,
(d) Edge detection,(e) Area occupied by the date fruit extraction, (f) Histogram Image .
• Immature parts extraction D15
g) Date fruit Yellow part
h) yellow part after mathematic Morphologic application
I) Edge detection
Fig.13. the examples of processing results; Column contents: (g) Yellow region extraction, (h) Yellow region
extraction after morphology mathematic application, I) Edge detection
Date Fruit D64.
334 (a) Original Image
(b) Yellow region extraction
(c) Yellow region extraction and morphological operation.
(d) Edge detection
e) Date fruit Extraction area
(f
) Image HistogramFig.14. the examples of processing results; Column contents: (a) original image D64, (b) Detected Area, (c) Detected Area after morphology mathematic application,
(d) Edge detection,(e) Area occupied by the date fruit extraction, (f) Histogram Image .
• Mature parts extraction.
g) Detected area .
h)Detected area after morphological operation
I) Edges detection
Date fruit D111.
• Immature parts extraction.
(a) Original Image,
b
) there is no yellow color region detectedso
A
Im=
00
Figure.16. the examples of processing results; the Column contents: (a) Original
Image, (b) Yellow region extraction.
a)
Original Image, (d) mature region extraction
e
)Detected Area and morphology mathematic application , a negligible area .Fig.17. The examples of processing results; Column contents: (c) Original Image, (d) mature
region extraction,(e) Mature region extraction and morphology mathematic application
• The Mathematical Content for Sorting Date Fruit Based on Repined Area.
In this article, all areas of the matured part of date fruit are less than T1=40% of total fruit Area, which is considered as insufficiently mature and will never complete the maturity. If the area of the mature part of date fruit is greater than T1=40% and less than T2=75% of total fruit area the date fruit is considered as insufficiently mature but maturation can be achieved by artificial heat treatment or traditional exposing to the sun; if the area of matured part is greater than T3=75% and less than T4=90% of the total fruit area , the fruit is considered mature and can reach the Over ripe state by itself , if the area of the mature part is greater than 90%of the total fruit area, the fruit is considered as overripe in the recognition procedure.
336
IF ( m
%
m
A
Pg
S
=
>threshold T3area)=> date fruit is overripe.
IF (
(
m%)
m
A
Pg
S
>threshold T2) &&
%
m m
A
Pg
S
=
<=threshold T3) => datefruit is ripe.
IF ( m
%
m
A
Pg
S
=
>=threshold T1) && (%
m m
A
Pg
S
=
<=threshold T2) => datefruit can be artificially ripened.
IF ( m
%
m
A
Pg
S
=
<threshold T1) => date fruit is [image:13.612.92.393.71.703.2]unripe so it can’t be ripened artificially so, destination for animal husbandry.
Fig. 19. This curve presents the percentage of the mature part in relation to the total area of each date fruit in the
sample D11 to D41.
Fig.20. this curve presents the percentage of the immature part in relation to the total area of each date fruit in the
sample D11 to D41.
[image:13.612.91.302.374.505.2]In this paper the sample for training was D1 to D9; and the sample test was D10 to D210, and the sorting rate of type of fruit date was significant.
Table 1: Fruits Maturity Classes
classes (a) (b) ( c) (d)
number of fruits classify
70 23 40 67
(a ) Unripened or defect fruit.
(b) Unripe with the appearance of insufficiently mature part of date fruit.
(c ) Not completely mature but likely to be artificially or naturally matured after harvest.
(d)Overripe dates fruit.
5. CONCLUSION
The color changes of a fruit surface during the maturation can be used as features to measure the ripeness state. Often, unripe fruits show greenish surface color which changes to yellowish color when they ripen gradually with honey color so we can predict the final gustative quality. These color patterns are similar within fruit categories.
In this work, by applying image segmentation based on color detection, changes of surface color with the maturity of date fruits were studied. Dates fruit was selected to show the color variation during ripening period Fig.1. Although The variation of color with maturity was clearly, due to the variation in the background light.
In this paper a novel inspection approach was proposed to detect external defects and level maturity of date fruits in sorting dates after harvest. The approach consists of color detection method based on HSV space color, segmentation, morphologic operation, feature extraction, and dates fruit sorting. The combination of color detection method and morphological operation is capable of segmenting the suspect region of interest and extracting structure features such as color and area and perimeter.
[image:13.612.93.301.551.685.2]REFERENCES
[1]Kress-Rogers E (ed.), ‘’Instrumentation and Sensors for the Food Industry’’, Butterworths-Heine-mann Ltd., Oxford, UK, 1993, p.375-415.
[2] Huanwen Chen,Yanping Sun,§ Arno Wortmann, Haiwei Gu,§ and Renato Zenobi ‘’Differentiation of Maturity and Quality of Fruit Using Noninvasive Extractive Electrospray Ionization Quadrupole Time-of-Flight Mass Spectrometry”. Anal. Chem. 2007, 79, 1447-1455.
[3] Yousef Al Ohali, ‘’Computer Vision Based Date
Fruit Grading System: Design and
Implementation ‘’. Department of Computer Science, College of Computer and Information Science, King Saud University, Riyadh, Saudi Arabia, accepted 22 March 2010.
[4] Ohta.Y., T. Kanade, and T. Sakai.’’ Color Information for Region Segmentation’’
Computer Graphics and Image Processing, 13(3):222–241, July 1980.
[5] Cheng.H.D., X.H. Jiang, Y. Sun, J. Wang, ‘’Color Image Segmentation: Advances and Prospects’’, Pattern Recognition Vol. 34 (12) (2001), pp. 2259–2281.
[6] Pal. N, Pal.S,’’ A Review on Image Segmentation Techniques’’, Pattern Recognition, Vol.26 (9) (1993), pp.1277-1294. [7] Ana Lúcia Soares Chaves and Paulo Celso de
Mello-Farias ; ‘’Ethylene and Fruit Ripening: From Illumination Gas to the Control of Gene Expression, more than a Century of Discoveries’’. Genetics and Molecular Biology, 29, 3, 508-515 (2006).
[8] Reid, M.S. ‘’Maturation and maturity indices’’.
In: La Rue, J.H.; Johnson, R.S.; (eds) Peaches, Plums and Nectarines: Growing and Handling for Fresh Market. University of California , Department of Agriculture and Natural Resources ,Publication No. 3331. pp. 21-28 (1992).
[9] Parker, D.D.; Moulton, K.; Zilberman, D.; Johnson, R. S. ’’The profitability of gearing production toward selected quality characteristics in tree fruit’’. In: Final Report, California Tree Fruit Agreement(1990). [10] Bruhn, C. ‘’Consumer Perception of Quality’’.
Perishables Handling – Postharvest
Technology of Fresh Horticultural Crops. Newsletter No. 72.. pp 4-9(1991).
[11] Kader, A. A. Mitcham, B. & Hess-Pierce, B. ‘’Optimum Procedures for Ripening Bananas’’. Perishables Handling Newsletter
80:12-13(1994).
[12] Kanali, C., Murase, H., Honami, N.,”Three-dimensional shape recognition using a charge simulation method to process image features”,
Journal of Agricultural Engineering Research, 70, pp. 195-208, 1998.
[13] Foley.J., A. van Dam, S. Feiner, and J. Hughes,
Computer Graphics: Principles and Practice, Second Edition, Addision-Wesley, 1996 . [14] Halimi A., El kouraychi A, Bouzid .A, and
Roukhe A.’’ Defects detection and extraction in textile imageries using Mathematical Morphology and geometrical features’’.
Journal of Signal Processing Theory and
Applications (2012) 1: 1-16
.doi:10.7726/jspta.2012.1001.
[15] WANG Hongzhi, DONG Ying,’’ An Improved Image Segmentation Algorithm Based on Otsu Method’’, International Symposium on Photoelectronic Detection and Imaging 2007:
Related Technologies and Applications, Edited by Liwei Zhou, Proc. of SPIE Vol. 6625, 66250I, (2008) · 0277-786X/08/$18 · doi: 10.1117/12.790781.