ORIGINAL RESEARCH
A Serial Dilution Study of Gadolinium-Based MR
Imaging Contrast Agents
A.G. Bleicher E. Kanal
BACKGROUND AND PURPOSE:With the approval of gadobenate dimeglumine, higher relaxivity MR contrast agents were introduced into the clinical environment, and multiple in vivo studies compared the efficacy and safety with the previously approved agents. An in vitro study was conducted to demonstrate differences between the various agents to confirm published values and for imaging-sequence optimization.
MATERIALS AND METHODS: A contrast phantom was made with serial dilutions of commercially available formulations of 5 US Food and Drug Administration–approved gadolinium-based MR imaging contrast agents in human serum substitute. Dilution factors ranging from 1:8 to 1:4096 were included in the phantom. Spin-echo sequences were performed at 1.5T and 3T with varying TRs and TEs.
RESULTS: At physiologic concentrations and by using short TRs and TEs, gadobenate demonstrated the highest signal intensities, confirming greater R1 relaxivity. At higher concentrations and with longer TR and TE values, the greatest signal intensity loss was appreciated for gadobenate, confirming greater R2 relaxivity.
CONCLUSION:Using rigorous in vitro methodology and serial dilution techniques, this study confirms the reported higher R1 and R2 relaxivities of gadobenate relative to the other agents at 1.5T and 3T.
W
ith the development and subsequent introduction in June 1988 of gadopentetate dimeglumine, the first US Food and Drug Administration (FDA)–approved MR imag-ing contrast agent, clinical MR imagimag-ing underwent significant changes.1Aside from the increased diagnostic yield of con-trast-enhanced T1-weighted imaging (T1WI), it made way for the development of advanced imaging, including intravenous contrast bolus MR angiography and perfusion-weighted MR imaging (PWI) techniques. Several gadolinium-based MR im-aging contrast agents were subsequently introduced into the clinical arena, but each was very similar to previously FDA-approved gadolinium-based MR imaging contrast agents (GBMCAs) in the mechanism of action, biodistribution, and biologic half-lives. They even shared similar safety profiles un-til the more recently discovered associations with the subse-quent development of nephrogenic systemic fibrosis in pa-tients with renal failure.2-5 Gadobenate dimeglumine, approved by the FDA in November 2004, represents the first FDA-approved GBMCA with noticeably higher R1 and R2 relaxivities and slightly different biodistribution and excretion pathways from those seen in the 4 older FDA-approved GBMCAs.6-8Because of weak and transient protein binding, this agent has been reported to possess enhanced (R1 and R2) relaxivities and, therefore, faster transverse and longitudinal relaxation and recovery rates compared with the other FDA-approved GBMCAs.7-10In clinical trials, it has been found to confer
greater conspicuity and detectability to lesions within the cen-tral nervous system and associated cerebral vasculature, among other reported benefits.11-16However, even in the in-traindividual crossover studies, biodistribution of contrast within each patient, therefore the local concentration of con-trast, cannot be determined or controlled. This was of partic-ular interest, given the slightly different biodistribution re-ported for gadobenate relative to the other agents, with 3%–5% of the administered gadobenate dose undergoing bil-iary clearance.6,17-19An in vitro study would potentiate more precise measurements of contrast concentration and correla-tion with corresponding signal intensities on any given MR imaging sequence. Such a study would allow more precise and quantifiable detection of differences between GBMCAs and optimization of imaging sequences to maximize the clinical benefits of each agent.
To this end, we designed an in vitro serial dilution study of each of the 5 FDA-approved GBMCAs currently available for clinical practice in the United States. These solutions would be simultaneously imaged with numerous MR imaging pulse se-quences and imaging parameters to assess their relative signal intensities. These imaging studies would be repeated on both 1.5T and 3T MR imaging systems to evaluate the relative be-havior of these agents at field strengths commonly used in clinical practice. It was hypothesized that these experiments would confirm published claims of relative relaxivities for these various agents and would demonstrate similar signal-intensity measurements at a given concentration, field strength, and pulse sequence for the older 4 GBMCAs and different values for gadobenate that would reflect its published higher R1 an R2 relaxivity values.
Materials and Methods
Serial dilutions of commercially obtained clinical use formulations of the 5 GBMCAs were performed by using Seronorm (Sero AS, Billing-stad, Norway) human serum substitute as the diluent. Each of 10 serial dilutions was a 50% dilution of the prior concentration pre-pared into 5 mL of Seronorm within plastic 15-mL Falcon tubes (BD
Received August 24, 2007; accepted after revision October 6.
From the Department of Radiology, Division of Neuroradiology, the University of Pittsburgh Medical Center, Pittsburgh, Pa.
This work was supported by a grant of Seronorm and a grant to support data entry provided by Bracco Diagnostics.
Paper previously presented in part at: Annual Meeting of the American Society of Neuroradiology, May 6 –12, 2006; San Diego, Calif.
Please address correspondence to Andrew G. Bleicher, MD, University of Pittsburgh Medical Center, Department of Radiology, Division of Neuroradiology, 200 Lothrop St, Room D-132, Pittsburgh, PA 15213; e-mail: [email protected]
Biosciences, Franklin Lakes, NJ) to a maximal dilution factor of 1:4096. For each of the 5 GBMCAs studied, 10 tubes were imaged, representing dilution factors ranging from 1:8 to 1:4096, which were linearly arranged in their polystyrene holder in ascending order of dilution gradient. Several control test tubes of saline and other solu-tions were secured to the outside of the holder. Thus, the imaged phantom consisted of a polystyrene holder with 50 tubes containing 10 dilutions of each of the 5 FDA-approved GBMCAs, 1 agent per 10-tube column and progressively higher dilution factors in each row, with control solutions appended to the sides of the polystyrene holder.
Scanning Technique
The phantom was scanned by using axial image planes with FOVs of 28 –32 cm, imaging matrix of 256⫻256, and section thicknesses of 5 mm. All imaging sequences were repeated in the identical fashion at both 1.5T and 3T at room temperature in clinical whole-body scan-ners (1.5T LX 9.1; 3T LX VH4; both GE Healthcare, Milwaukee, Wis). The phantom was leveled in the center of a transmit-receive head coil positioned at magnet isocenter. At each field strength, single-echo spin-echo MR imaging sequences were executed with varying TEs and TRs in a controlled fashion as outlined in Table 1. For each scanning session per field strength studied, center frequency and receiver and transmission gains were kept constant, being determined and fixed at long-TR test sequences.
Measurements
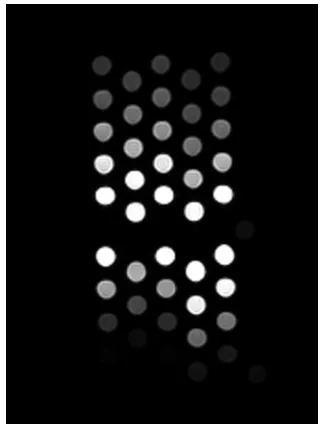
Five axial images were acquired in multisection mode for each se-quence. Of these, the middle image (image 3) was chosen for analysis so as to measure the region expected to have the most representative contrast concentration and minimal artifact from partial volume av-eraging for each tube studied. Images were imported into MIPAV software (http://mipav.cit.nih.gov/), and region-of-interest measure-ments were obtained from the center of each visible sample (Fig 1).20 Region-of-interest intensity and SD values were recorded for each of the 50 test tubes and controls on the selected central image of each of the sequences studied at both 1.5T and 3T. When the sequence pro-duced no grossly detectable signal intensity within a given test tube, the position of the region of interest used to measure the signal inten-sity for that tube was selected by copying and pasting the position used in other sequences, which demonstrated signal intensity from that
same tube. Data entry was double-checked for accuracy and repro-ducibility by repeating ⬎10% of the measurements (randomly selected).
Results
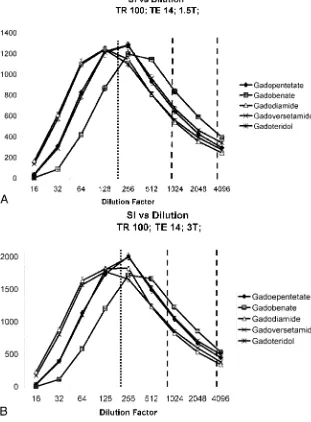
At TR values that were short relative to the anticipated T1 values of the materials tested, all contrast agents demonstrated the lowest intensities at the highest concentrations/lowest di-lution factors studied. For all agents, signal intensities in-creased, peaked, and subsequently diminished as dilution fac-tors ranged from high to low (Fig 2). The dilution factor at which signal intensity peaked varied across each GBMCA, TR, and TE studied. For example, at TR⫽100 and TE⫽14, peak signal intensity for gadodiamide was seen at a dilution factor of 1:128, whereas it peaked at 1:256 for gadobenate.
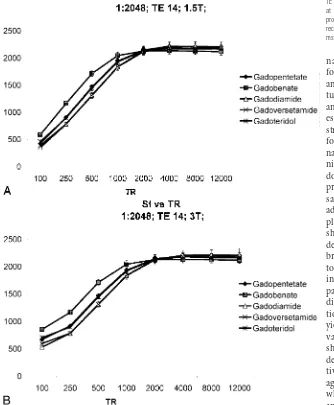
With parameters typical for clinical contrast-enhanced T1WI, Figure 2 shows that the highest signal intensities mea-sured were for gadobenate, followed by gadopentetate and ga-doteridol, followed by gadoversetamide and gadodiamide. Figure 3 demonstrates that at similar dilution factors, increas-ing TR yielded higher signal intensities for all 5 agents until it reached or exceeded 1000 ms. Although the relative order of signal intensities among the agents studies was maintained, the percentage increase in signal intensity (relative to the low-est measured value) decreased as the TR was lengthened.
[image:2.594.336.497.41.255.2]With low dilution factors typical for PWI, Figure 2 demon-strates that the lowest signal intensities and greatest T2(*) shortening effects were observed for gadobenate, followed by gadopentetate and gadoteridol, followed once again by ga-doversetamide and gadodiamide. For PWI applications, plot-ting signal intensity versus TE for a given TR (Fig 4) demon-strated that the rate of signal-intensity decrease with increasing TE values was greatest for gadobenate. As T2-weighting was increased with longer TEs, signal-intensity loss was greatest for gadobenate. This was demonstrated by the use of 95% confidence intervals (Table 2), in which no significant differences existed between the measurements at TE⫽20 and Table 1: Imaging parameters for spin-echo sequences performed at
1.5T and 3T
TR (msec) TE (msec)
100 14
250 14
500 14
1000 14
2000 14
4000 14
8000 14
12,000 14
1000 20
2000 20
4000 20
8000 20
1000 100
2000 100
4000 100
8000 100
Fig 1.Sample image demonstrates the phantom at 3T, by using spin-echo technique (TR⫽ 100, TE⫽14).
BRAIN
ORIGINAL
[image:2.594.53.283.67.244.2]no overlap existed between the confidence intervals of gado-benate and the other agents at TE⫽100. Most interesting, significant differences were also observed between gadoteridol and gadopentetate versus gadodiamide and gadoversetamide (Table 3).
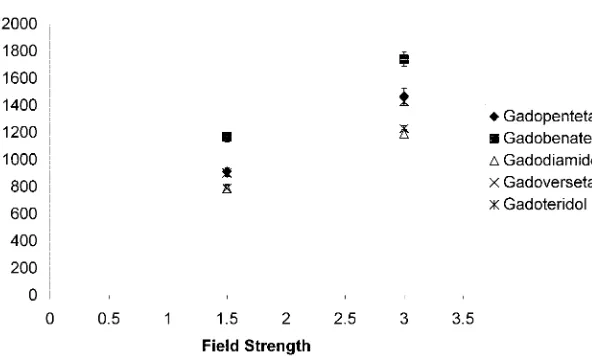
By comparing signal intensities for a physiologic concen-tration with scanning parameters representative of contrast-enhanced T1WI at field strengths of 1.5T and 3T, Figure 5 demonstrates (as expected) higher signal intensities for all agents at 3T than at 1.5T. The relative benefit of gadobenate compared with the other agents was maintained at 3T as it had been seen at 1.5T. The signal-intensity benefit at 3T for gado-benate compared with the other agents was statistically similar to that seen at 1.5T for this agent compared with the other agents.
Discussion
This study was performed to investigate the claim that gado-benate has uniquely higher R1 and R2 relaxivities when com-pared with the older FDA-approved commercially available GBMCAs. With an in vitro approach and serial dilution tech-nique, a rigorous experimental methodology was expected to
reveal any differences that may exist among these agents without subjecting the study to any of the variables that affect in vivo studies.
In humans, these agents all distribute throughout the extracellular fluid space, which corresponds to approximately 19 –20 L of fluid in a 70-kg patient. As previously noted, 3%–5% of the adminis-tered dose of gadobenate undergoes bili-ary clearance.18Discounting the effects of local concentration or renal clearance, standard doses of these agents to a 70-kg patient would correspond very roughly to a dilution of 14 mL into 20,000 mL, or ⬃1:1,400-dilution value at equilibrium. Adding some of the effects of first-pass and clearance effects, approximate dilu-tion values in most enhancing tissues in the first 5–10 minutes following adminis-tration, during which clinical imaging is typically performed, would correspond to contrast concentrations of very roughly between 1:1000 and 1:4000. In this phys-iologically functioning range, we find sig-nificant T1 shortening effects (which cor-respond with increased signal intensity on clinical T1WI) for each of the agents tested at 1.5T and 3T (Fig 2).
Although most clinical imaging takes place at “physio-logic” dilution factors in the range of 1:000 –1:4000, PWI, typ-ically performed as a first-pass study, takes place at much lower dilution factors. During cerebral PWI, the entire brain is repeatedly examined every 2–3 seconds as contrast washes in, through, and then out of the tissues of interest. At such high concentrations, T2(*) effects of the infused contrast agents predominate. For sequences emphasizing T2-weighting, ar-rival of the first-pass contrast bolus, therefore, results in sig-nal-intensity loss and returns to near baseline with washout of the agent from the vascular/capillary tree. Each of the agents demonstrates T2(*) shortening effects, illustrated by low mea-sured signal intensities at low dilution factors (Fig 2).
Our data support the claim that when diluted in a protein-containing solution, such as the human serum substitute Se-ronorm, at identical concentrations, gadobenate yielded greater signal intensities at physiologic concentrations on typ-ical T1WI sequences (ie, short TE, short TR sequences) than did the other 4 GBMCAs (Fig 3). Gadobenate also demon-strated even greater differences in its T2 shortening effects as demonstrated by lower signal intensities at given dilution
[image:3.594.54.365.49.471.2]tors as might represent those used in clinical PWI imaging and as represented by the greater observed negative slope in mea-sured signal intensity with increasing TE values (Fig 4). For clinical application, this would allow smaller contrast doses yet equivalent contrast-to-noise ratios (CNR) compared with that produced at PWI with the other GBMCAs. Alternately, similar doses could provide greater CNR and increased sensi-tivity on PWI compared with other GBMCAs.
These data confirm the higher R1 and R2 relaxivities of gadobenate relative to the older agents, both at 1.5T as well as at 3T, in which the differences in measured signal intensities were even greater than those observed at 1.5T (Fig 5). With the increasing numbers of 3T scanners being installed, this obser-vation has potential direct clinical significance as R1 relaxivity effects are converted into signal intensities and image con-trast-to-noise ratios on diagnostic studies in humans. The higher signal intensity-to-noise ratios available at 3T com-pared with 1.5T are synergistically potentiated by the higher signal intensities measured at 3T compared with 1.5T in this study, which would translate into greater enhancement on clinical scans.
In a clinical setting, increased relaxivity can be converted into any of several clinical benefits. These include greater
sig-nal intensity-to-noise ratios and, there-fore, CNRs between enhancing tissues and nonenhancing background struc-tures, thus increasing resolving power and lesion detectability. These might be especially beneficial for detecting small structures/lesions, such as tiny metastatic foci and/or smaller vessels in contrast dy-namic bolus MR angiographic tech-niques. Alternatively, lower administered doses might result in similar CNRs, thus providing a cost savings and/or increasing safety by permitting less of the agent to be administered to patients with, for exam-ple, renal disease. With a dose relation-ship now being established between the development of nephrogenic systemic fi-brosis in patients with renal failure and total administered GBMCA, administer-ing lower doses seems to provide a direct patient safety benefit in this regard.21 Ad-ditionally, scanning-parameter optimiza-tion for the higher relaxivity agent may yield its own benefits, such as shorter TR values, providing increasing CNRs in shorter scanning acquisition times. This is demonstrated in Figure 2, where the rela-tive benefit of gadobenate over the other agents is maximized as TR is shortened, which also yields shorter scanning times and increased clinical scanner through-put. By switching from spin-echo to gradient-echo imaging, TR can be further shortened while maintaining T1 contrast by using minimal TE values and relatively larger flip angles.
A second, unexpected result relates to the older GBMCAs. It was initially accepted that the other 4 agents had essentially equivalent relaxivities and, as such, were largely interchange-able for clinical use. As demonstrated in Tinterchange-able 3, for a given concentration, gadopentetate and gadoteridol had statistically significant greater degrees of T1 shortening and, therefore, signal intensities than did gadodiamide and gadoversetamide at the same dilution factors. Although this unexpected finding is of unknown and questionable clinical significance, the ob-servation remains of at least academic interest. Each of these agents had intensities and, therefore, relaxivities statistically significantly lower than those measured for gadobenate.
Limitations
All imaging was performed at room temperature, not at phys-iologic temperatures in a 37°C water bath. Despite our aware-ness of the fact that phantom temperatures play a role in de-termining the relaxivity and thus signal intensities observed, we recognized that this effect would be similar for each agent studied and therefore would not introduce any drug-specific
[image:4.594.51.385.53.458.2]bias into our results. As such, this would not be expected to impact the relative analyses performed in this study and would, therefore, not play a significant role in our attempt to assess relative behaviors of each of these agents in humans.
Conclusions
Using rigorous in vitro methodology and serial dilution tech-niques, this study confirms the reported higher R1 and R2 relaxivities of gadobenate relative to gadopentetate, gadodia-mide, gadoversetagadodia-mide, and gadoteridol. These differences were present at both 1.5T and 3T. These data help explain the Table 2: T2(*) shortening effects as demonstrated by prolonging TE*
Agent
TE⫽20 TE⫽100
Mean SD 95% CI Mean SD 95% CI
Gadopentetate 3239 82 3074–3404 1984 87 1810–2157
Gadobenate 3119 44 3032–3206 1632 51 1529–1734†
Gadodiamide 3272 77 3117–3426 2125 75 1976–2273
Gadoversetamide 3265 55 3156–3374 2150 52 2045–2254
Gadoteridol 3176 52 3072–3280 2029 45 1939–2119
Note:—CI indicates confidence interval. * TR⫽8000; B0⫽3T; dilution factor⫽1:2048.
[image:5.594.50.503.39.490.2]† A statistically significant difference (P⬍.05) exists between the measured values at TE⫽100 that does not exist at TE⫽20 for gadobenate compared with the other agents because there is no overlap between 95% CIs. All numbers reported are rounded to the nearest integer.
Table 3: Effects of differences between perceived relaxivities among low relaxivity agents*†
Agent Mean SD 95% CI
Gadopentetate 912 27 857–967
Gadoteridol 901 23 854–947
Gadodiamide 786 30 725–846
Gadoversetamide 788 22 743–833
Note:—CI indicates confidence interval.
* TR⫽250; TE⫽14; B0⫽1.5T; dilution factor⫽1:2048.
† A statistically significant difference (P⬍.05) exists between the measured values for gadopentetate and gadoteridol relative to gadoversetamide and gadodiamide because there is no overlap between 95% CIs. All numbers reported are rounded to the nearest integer.
[image:5.594.54.534.486.561.2] [image:5.594.303.534.628.684.2]potential clinical benefits of higher relaxivity agents and confirm the results seen in the human in vivo crossover trials already reported.12-15These results also support the prediction that higher R2 values would provide similar vantages over lower R2 relaxivity agents for PWI per ad-ministered dose/volume of GBMCA and would yield higher CNR and/or shorter scanning times for similar diagnostic CNR end points.
References
1. de Haen C.Conception of the first magnetic resonance imaging contrast agents: a brief history.Top Magn Reson Imaging2001;12:221–30
2. Thomsen HS.European Society of Urogenital Radiology guidelines on con-trast media application.Curr Opin Urol2007;17:70 –76
3. Thomsen HS, Marckmann P, Logager VB.Enhanced computed tomography or magnetic resonance imaging: a choice between contrast medium-induced ne-phropathy and nephrogenic systemic fibrosis?Acta Radiol2007;48:593–96 4. Kirchin MA, Runge VM.Contrast agents for magnetic resonance imaging:
safety update.Top Magn Reson Imaging2003;14:426 –35
5. Duff G. Gadolinium-containing MRI contrast agents and nephrogenic systemic fibrosis (NSF): Update—Direct Healthcare Professional Communication. In: Co H, ed.Medicines.2007; Available at: http://www. mhra.gov.uk/home/idcplg?IdcService⫽SS_GET_PAGE&useSecondary⫽true& ssDocName⫽CON2030229&ssTargetNodeId⫽221
6. de Haen C, Cabrini M, Akhnana L, et al.Gadobenate dimeglumine 0.5 M so-lution for injection (MultiHance) pharmaceutical formulation and physico-chemical properties of a new magnetic resonance imaging contrast medium.
J Comput Assist Tomogr1999;23(suppl 1):S161– 68
7. Pintaske J, Martirosian P, Graf H, et al.Relaxivity of gadopentetate dimeglu-mine (Magnevist), gadobutrol (Gadovist), and gadobenate dimegludimeglu-mine (MultiHance) in human blood plasma at 0.2, 1.5, and 3 Tesla.Invest Radiol
2006;41:213–21
8. Kirchin MA, Pirovano GP, Spinazzi A. Gadobenate dimeglumine (Gd-BOPTA): an overview.Invest Radiol1998;33:798 – 809
9. Giesel FL, von Tengg-Kobligk H, Wilkinson ID, et al.Influence of human se-rum albumin on longitudinal and transverse relaxation rates (r1 and r2) of magnetic resonance contrast agents.Invest Radiol2006;41:222–28 10. Laurent S, Elst LV, Muller RN.Comparative study of the physicochemical
properties of six clinical low molecular weight gadolinium contrast agents.
Contrast Media Mol Imaging 20062006;1:128 –37
11. Colosimo C, Demaerel P, Tortori-Donati P, et al.Comparison of gadobenate dimeglumine (Gd-BOPTA) with gadopentetate dimeglumine (Gd-DTPA) for enhanced MR imaging of brain and spine tumours in children.Pediatr Radiol
2005;35:501–10. Epub 2005 Jan 28
12. Essig M, Lodemann KP, Le-Huu M, et al.Intraindividual comparison of gado-benate dimeglumine and gadobutrol for cerebral magnetic resonance perfu-sion imaging at 1.5 T.Invest Radiol2006;41:256 – 63
13. Essig M, Tartaro A, Tartaglione T, et al.Enhancing lesions of the brain: intra-individual crossover comparison of contrast enhancement after gadobenate dimeglumine versus established gadolinium comparators. Acad Radiol
2006;13:744 –51
14. Kuhn MJ, Picozzi P, Maldjian JA, et al.Evaluation of intraaxial enhancing brain tumors on magnetic resonance imaging: intraindividual crossover comparison of gadobenate dimeglumine and gadopentetate dimeglumine for visualization and assessment, and implications for surgical intervention.
J Neurosurg2007;106:557– 66
15. Maravilla KR, Maldjian JA, Schmalfuss IM, et al.Contrast enhancement of central nervous system lesions: multicenter intraindividual crossover com-parative study of two MR contrast agents.Radiology2006;240:389 – 400 16. Shellock FG, Parker JR, Pirovano G, et al.Safety characteristics of gadobenate
dimeglumine: clinical experience from intra- and interindividual comparison studies with gadopentetate dimeglumine. J Magn Reson Imaging
2006;24:1378 – 85
17. Gandhi SN, Brown MA, Wong JG, et al.MR contrast agents for liver imaging: what, when, how.Radiographics2006;26:1621–36
18. Knopp MV, Giesel FL, Radeleff J, et al.Bile-tagged 3D magnetic resonance colonography after exclusive intravenous administration of gadobenate dimeglumine, a contrast agent with partial hepatobiliary excretion.Invest Ra-diol2001;36:619 –23
19. Lim JS, Kim MJ, Jung YY, et al.Gadobenate dimeglumine as an intrabiliary contrast agent: comparison with mangafodipir trisodium with respect to non-dilated biliary tree depiction.Korean J Radiol2005;6:229 –34
20. McAuliffe MJ, Lalonde FM, McGarry D, et al.Medical Image Processing, Analysis, & Visualization in Clinical Research: Proceedings of the Fourteenth IEEE Sympo-sium on Computer-Based Medical Systems, Bethesda, Md, 26 –27 July 2001: IEEE Computer Society; Los Alamitos, CA; 2001:6
21. Marckmann P, Skov L, Rossen K, et al.Case-control study of gadodiamide-related nephrogenic systemic fibrosis.Nephrol Dial Transplant2007;22:3174 – 78. Epub 2007 May 4
[image:6.594.53.349.72.253.2]